SlideShare a Scribd company logo
News ReleaseFOR IMMEDIATE RELEASE:
Metro Vancouver home sales set record pace in June
VANCOUVER, B.C. – July 3, 2015 – Last month was the highest selling June, and the second
highest overall monthly total, on record for the Real Estate Board of Greater Vancouver
(REBGV).
The REBGV reports that residential property sales in Metro Vancouver* reached 4,375 on the
Multiple Listing Service® (MLS®) in June 2015. This represents a 28.4 per cent increase
compared to the 3,406 sales recorded in June 2014, and an increase of 7.9 per cent compared to
the 4,056 sales in May 2015.
Last month’s sales were 29.1 per cent above the 10-year sales average for the month. It’s the
fourth straight month with over 4,000 sales, which is a first in the REBGV’s history. The
previous highest number of residential home sales was 4,434, recorded in May 2005.
“Demand in our detached home market continues to drive activity across Metro Vancouver,”
Darcy McLeod, REBGV president said. “There were more detached home sales in the region last
month than we’ve seen during the month of June in more than 10 years.”
The MLS® Home Price Index composite benchmark price for all residential properties in Metro
Vancouver is currently $694,000. This represents a 10.3 per cent increase compared to June
2014.
“Housing market activity comes in cycles; we're in an up cycle right now that looks similar to the
mid-2000s,” McLeod said. “It would be easy to point to one factor that's causing this cycle, but
the truth is that it's a number of different factors.
"Conditions today are being driven by low interest rates, a declining supply of detached homes, a
growing population, a provincial economy that's outperforming the rest of Canada, pent-up
demand from previous years and, perhaps most importantly, the fact that we live in a highly
desirable region," McLeod said.
New listings for detached, attached and apartment properties in Metro Vancouver totalled 5,803
in June. This represents an 8.7 per cent increase compared to the 5,339 new listings reported in
June 2014.
"We’re seeing a steady stream of new listings entering the market, but the overall number of
homes for sale is not keeping up with buyer demand," McLeod said.
The total number of properties currently listed for sale on the region’s MLS® is 12,181, a 23.9
per cent decline compared to June 2014 and a 1.3 per cent decline compared to May 2015. This
is the lowest active listing total for June since 2006.
The sales-to-active-listings ratio in June was 35.9 per cent. This is the highest that this ratio has
been in Metro Vancouver since June 2006. A seller’s market typically occurs when this ratio
exceeds 20 per cent for a sustained period of time.
“The competition in today’s market means that buyers have less time to make decisions,”
McLeod said. “Given this, it’s important to work with your REALTOR® to gain insight into the
local market, to get quick access to new MLS® listings, to develop a buying strategy that meets
your needs and risk appetite, and to receive other services and protections that come from having
professional representation.”
Sales of detached properties in June 2015 reached 1,920, an increase of 31.3 per cent from the
1,462 detached sales recorded in June 2014, and a 74.2 per cent increase from the 1,102 units
sold in June 2013. The benchmark price for a detached property in Metro Vancouver increased
14.8 per cent from June 2014 to $1,123,900.
Sales of apartment properties reached 1,774 in June 2015, an increase of 35.6 per cent compared
to the 1,308 sales in June 2014, and an increase of 66.1 per cent compared to the 1,068 sales in
June 2013. The benchmark price of an apartment property increased 5.3 per cent from June 2014
to $400,200.
Attached property sales in June 2015 totalled 681, an increase of 7.1 per cent compared to the
636 sales in June 2014, and a 44.3 per cent increase from the 472 attached properties sold in June
2013. The benchmark price of an attached unit increased 7.1 per cent between June 2014 and
2015 to $506,900.
*Editor’s Note: Areas covered by Real Estate Board of Greater Vancouver include: Whistler, Sunshine Coast,
Squamish, West Vancouver, North Vancouver, Vancouver, Burnaby, New Westminster, Richmond, Port Moody,
Port Coquitlam, Coquitlam, New Westminster, Pitt Meadows, Maple Ridge, and South Delta.
-30-
The real estate industry is a key economic driver in British Columbia. In 2014, 33,116 homes changed ownership in
the Board’s area, generating $2.136 billion in economic spin-off activity and an estimated 16,227 jobs. The total
dollar value of residential sales transacted through the MLS® system in Metro Vancouver totalled $27.3 billion in
2014. The Real Estate Board of Greater Vancouver is an association representing nearly 12,000 REALTORS® and
their companies. The Board provides a variety of member services, including the Multiple Listing Service®. For
more information on real estate, statistics, and buying or selling a home, contact a local REALTOR® or visit
www.rebgv.org.
For more information please contact:
Craig Munn
Manager, Communication
Real Estate Board of Greater Vancouver
604.730.3146
cmunn@rebgv.org
Property Type Area
Benchmark
Price
Price
Index
1 Month
Change %
3 Month
Change %
6 Month
Change %
1 Year
Change %
3 Year
Change %
5 Year
Change %
10 Year
Change %
Residential / Composite Lower Mainland $610,800 172.2 1.2% 4.4% 7.5% 8.6% 10.0% 17.0% 65.1%
Greater Vancouver $694,000 181.6 1.4% 5.0% 8.4% 10.3% 12.0% 20.6% 73.4%
Bowen Island $614,800 133.3 2.4% 3.9% 4.3% 4.8% -1.6% -1.2% 25.2%
Burnaby East $657,200 181.4 2.3% 6.8% 10.1% 10.9% 15.0% 21.7% 73.6%
Burnaby North $588,000 176.7 1.8% 4.7% 8.3% 8.3% 12.1% 20.2% 69.7%
Burnaby South $643,500 181.9 0.9% 4.2% 6.3% 9.1% 10.6% 21.4% 74.2%
Coquitlam $582,400 172.3 1.1% 5.4% 8.5% 11.4% 13.9% 20.2% 66.0%
Ladner $614,400 170.9 2.1% 6.8% 9.6% 12.3% 11.3% 18.0% 66.6%
Maple Ridge $414,600 140.1 1.0% 2.9% 4.6% 5.9% 5.7% 3.9% 36.8%
New Westminster $404,300 172.2 2.0% 4.4% 6.4% 6.7% 7.9% 14.1% 63.4%
North Vancouver $754,400 170.2 0.8% 3.8% 8.8% 11.4% 14.0% 20.0% 63.3%
Pitt Meadows $424,400 155.3 0.3% 4.3% 6.2% 8.4% 13.4% 11.0% 51.1%
Port Coquitlam $446,700 158.3 0.9% 6.1% 7.2% 9.9% 10.2% 12.3% 52.7%
Port Moody $586,200 162.1 1.0% 3.5% 7.5% 9.7% 14.5% 15.3% 55.9%
Richmond $650,900 188.6 1.6% 5.3% 8.8% 10.4% 10.2% 18.2% 81.5%
Squamish $448,300 146.1 -0.1% 2.8% 7.7% 10.3% 14.9% 10.3% 39.8%
Sunshine Coast $370,800 129.9 0.9% 4.3% 5.3% 4.1% -0.2% -4.3% 23.1%
Tsawwassen $705,000 176.6 2.5% 7.9% 11.1% 15.2% 13.5% 20.9% 69.5%
Vancouver East $723,800 212.0 2.2% 6.6% 9.6% 11.9% 16.5% 31.4% 102.9%
Vancouver West $940,900 198.3 1.1% 4.4% 8.4% 10.7% 14.4% 26.1% 85.5%
West Vancouver $1,919,600 206.0 1.6% 5.7% 14.6% 12.0% 16.8% 42.9% 96.6%
Whistler $521,200 121.1 -0.4% 4.0% 6.4% 12.2% 8.1% 0.8% 17.2%
Single Family Detached Lower Mainland $891,800 189.4 1.5% 5.7% 10.1% 12.2% 14.6% 28.2% 83.0%
Greater Vancouver $1,123,900 207.3 1.7% 6.7% 11.9% 14.8% 16.7% 34.4% 100.1%
Bowen Island $614,800 133.3 2.4% 3.9% 4.3% 4.8% -1.6% -1.2% 25.2%
Burnaby East $902,900 201.9 3.4% 9.1% 14.6% 14.8% 18.7% 34.7% 90.7%
Burnaby North $1,148,500 222.1 2.6% 8.2% 14.4% 15.3% 21.2% 43.8% 115.0%
Burnaby South $1,178,500 225.6 1.4% 7.5% 11.8% 15.8% 16.0% 44.4% 117.1%
Coquitlam $861,200 190.8 1.9% 6.7% 11.7% 15.0% 19.2% 32.2% 84.9%
Ladner $726,500 175.3 1.9% 7.6% 10.3% 14.6% 13.5% 21.4% 71.2%
Maple Ridge $505,100 143.9 1.2% 3.9% 5.7% 7.1% 8.6% 8.0% 41.5%
New Westminster $789,300 195.8 2.7% 9.3% 13.4% 13.8% 15.6% 29.4% 85.9%
North Vancouver $1,176,600 187.3 0.8% 5.9% 12.6% 16.2% 20.1% 32.2% 78.7%
Pitt Meadows $560,500 158.0 1.2% 5.4% 7.3% 10.0% 12.5% 12.3% 54.1%
Port Coquitlam $662,100 176.6 2.4% 8.8% 13.1% 15.5% 17.0% 24.0% 72.1%
Port Moody $1,005,600 185.7 1.4% 7.1% 9.8% 11.9% 18.8% 29.0% 81.0%
Richmond $1,144,700 229.6 1.5% 6.4% 11.5% 16.5% 14.2% 32.8% 121.8%
Squamish $591,100 157.1 -0.4% 1.6% 8.7% 9.5% 15.3% 20.9% 46.1%
Sunshine Coast $368,800 129.2 0.9% 4.4% 5.1% 4.2% -0.3% -4.8% 22.6%
Tsawwassen $866,600 186.6 2.2% 8.9% 12.2% 17.2% 17.0% 27.4% 76.7%
Vancouver East $1,093,900 241.8 2.2% 7.8% 12.8% 19.2% 26.6% 52.2% 133.6%
Vancouver West $2,599,700 266.9 1.8% 6.2% 11.7% 15.0% 17.8% 46.4% 159.4%
West Vancouver $2,320,400 220.6 1.3% 6.3% 15.7% 12.6% 19.1% 52.2% 109.5%
Whistler $1,008,500 139.6 -1.5% 0.3% 5.4% 5.0% 16.6% 10.9% 31.9%
HOW TO READ THE TABLE:
• Benchmark Price: Estimated sale price of a benchmark property. Benchmarks represent a typical property within each market.
• Price Index: Index numbers estimate the percentage change in price on typical and constant quality properties over time. All figures are based on past sales.
• x Month/Year Change %: Percentage change of index over a period of x month(s)/year(s) *
In January 2005, the indexes are set to 100.
Townhome properties are similar to Attached properties, a category that was used in the previous MLSLink HPI, but do not included duplexes.
The above info is deemed reliable, but is not guaranteed. All dollar amounts in CDN.
June 2015*
* MLS®, Multiple Listing Service®, and all related graphics are trademarks of The Canadian Real Estate Association 1 of 14
Property Type Area
Benchmark
Price
Price
Index
1 Month
Change %
3 Month
Change %
6 Month
Change %
1 Year
Change %
3 Year
Change %
5 Year
Change %
10 Year
Change %
June 2015*
Townhouse Lower Mainland $418,300 151.4 0.7% 3.2% 4.9% 5.1% 4.5% 6.1% 46.7%
Greater Vancouver $506,900 163.8 1.2% 4.5% 5.9% 7.1% 8.3% 11.6% 57.7%
Burnaby East $455,000 163.2 3.1% 4.3% 6.4% 7.3% 7.8% 12.3% 60.0%
Burnaby North $436,600 162.8 1.2% 6.4% 7.0% 4.9% 8.9% 9.1% 53.9%
Burnaby South $437,000 156.8 0.8% 6.5% 2.1% 2.6% 3.2% 7.2% 52.4%
Coquitlam $414,200 152.2 0.3% 2.3% 3.9% 6.6% 8.3% 8.1% 45.2%
Ladner $493,100 163.4 0.9% 5.6% 7.7% 6.8% 9.2% 13.6% 55.3%
Maple Ridge $282,400 137.2 1.4% 0.5% 1.2% 4.1% 2.5% -1.4% 31.5%
New Westminster $441,900 166.0 1.8% 4.7% 6.3% 8.1% 10.2% 16.2% 60.1%
North Vancouver $650,100 155.6 2.6% 4.6% 7.8% 7.4% 9.1% 9.7% 50.8%
Pitt Meadows $363,100 157.1 1.0% 8.0% 9.6% 12.7% 12.7% 11.1% 52.8%
Port Coquitlam $397,400 150.7 -0.5% 4.4% 5.1% 6.3% 6.3% 6.5% 42.8%
Port Moody $447,400 151.2 1.0% 3.1% 4.0% 7.5% 8.9% 7.7% 43.0%
Richmond $546,900 176.8 1.3% 3.9% 6.1% 7.7% 8.5% 13.6% 71.7%
Squamish $384,900 139.7 1.3% 6.2% 7.0% 7.7% 25.5% 7.8% 39.7%
Tsawwassen $488,100 161.3 1.6% 5.1% 10.3% 10.5% 5.4% 10.3% 53.3%
Vancouver East $562,100 185.3 0.2% 5.5% 6.1% 5.6% 7.7% 17.4% 71.3%
Vancouver West $805,500 182.2 1.6% 4.4% 6.5% 7.7% 13.0% 21.6% 76.9%
Whistler $530,300 141.8 1.7% 6.3% 8.0% 11.4% 12.5% 18.7% 41.8%
Apartment Lower Mainland $359,800 157.1 0.7% 2.3% 4.1% 4.3% 4.8% 5.9% 48.5%
Greater Vancouver $400,200 160.9 0.8% 2.5% 4.5% 5.3% 6.6% 8.1% 51.8%
Burnaby East $426,300 161.8 -2.5% 2.0% 1.6% 3.9% 16.3% 5.0% 52.6%
Burnaby North $357,000 150.9 1.1% 0.4% 2.3% 2.2% 4.7% 6.0% 44.8%
Burnaby South $409,200 164.3 0.5% 1.5% 3.1% 5.7% 7.8% 11.4% 56.3%
Coquitlam $272,700 150.1 -0.2% 4.1% 4.7% 6.9% 5.6% 5.0% 43.8%
Ladner $342,200 162.2 4.0% 5.5% 9.1% 9.0% 5.4% 10.6% 61.7%
Maple Ridge $172,300 124.4 -0.9% 0.2% 3.0% 0.5% -4.6% -8.1% 20.5%
New Westminster $288,000 164.0 1.7% 2.2% 3.5% 3.4% 4.4% 8.0% 55.3%
North Vancouver $370,600 150.8 0.2% 0.1% 3.1% 5.3% 5.6% 6.5% 45.3%
Pitt Meadows $255,500 151.0 -1.0% 0.7% 2.6% 4.1% 17.1% 10.6% 46.3%
Port Coquitlam $236,300 140.1 0.1% 3.4% -0.1% 4.9% 3.7% 0.8% 34.8%
Port Moody $354,900 147.9 0.2% -1.1% 6.3% 6.9% 11.2% 6.9% 42.3%
Richmond $362,600 153.1 1.4% 3.4% 5.3% 2.0% 3.2% 1.7% 46.1%
Squamish $278,300 134.0 1.2% 4.4% 9.3% 29.2% 5.0% -4.9% 30.6%
Tsawwassen $352,200 148.5 3.6% 5.2% 8.7% 9.4% 3.6% 2.5% 48.1%
Vancouver East $330,300 182.2 2.5% 4.4% 4.8% 2.9% 5.4% 9.6% 72.7%
Vancouver West $528,000 170.9 0.4% 2.6% 5.6% 7.5% 10.7% 14.2% 57.1%
West Vancouver $646,300 141.2 4.4% 1.4% 4.6% 5.9% 1.9% -0.1% 37.5%
Whistler $270,300 88.6 -1.4% 5.4% 7.9% 31.1% 9.2% -24.0% -15.3%
HOW TO READ THE TABLE:
• Benchmark Price: Estimated sale price of a benchmark property. Benchmarks represent a typical property within each market.
• Price Index: Index numbers estimate the percentage change in price on typical and constant quality properties over time. All figures are based on past sales.
• x Month/Year Change %: Percentage change of index over a period of x month(s)/year(s)
In January 2005, the indexes are set to 100. *
Townhome properties are similar to attached properties, a category that was used in the previous MLSLink HPI, but do not included duplexes.
Lower Mainland includes areas serviced by both Real Estate Board of Greater Vancouver & Fraser Valley Real Estate Board.
The above info is deemed reliable, but is not guaranteed. All dollar amounts in CDN.
* MLS®, Multiple Listing Service®, and all related graphics are trademarks of The Canadian Real Estate Association 2 of 14
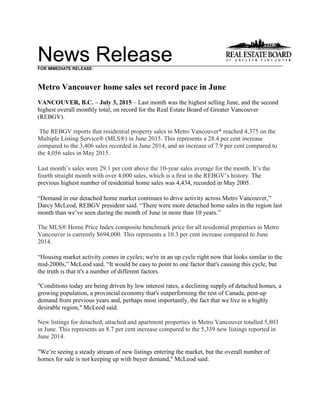
C:DATAMonthEndHpiexporthi_resgv-hpi2.tifGreaterVancouver
5YearTrend
60
80
100
120
140
160
180
200
220
Jun 2010
Aug 2010
Oct 2010
Dec 2010
Feb 2011
Apr 2011
Jun 2011
Aug 2011
Oct 2011
Dec 2011
Feb 2012
Apr 2012
Jun 2012
Aug 2012
Oct 2012
Dec 2012
Feb 2013
Apr 2013
Jun 2013
Aug 2013
Oct 2013
Dec 2013
Feb 2014
Apr 2014
Jun 2014
Aug 2014
Oct 2014
Dec 2014
Feb 2015
Apr 2015
Jun 2015
Price
Index
ResidentialDetachedTownhouseApartment
Jan2005HPI=100
6222015MLS®
SALESFacts
Burnaby
Coquitlam
Delta-South
Islands-Gulf
MapleRidge/PittMeadows
NewWestminster
NorthVancouver
PortCoquitlam
PortMoody/Belcarra
Richmond
Squamish
SunshineCoast
VancouverEast
VancouverWest
WestVancouver/HoweSound
Whistler/Pemberton
Detached17719975718746156783323842106221236102171,920
Attached965690711361342511727845881318681
Apartment24413026045109120553719018919955716191,774
Detached$1,286,000$890,000$862,500n/a$548,000$870,000$1,264,000$659,000$1,065,000$1,229,000$665,000$395,000$1,238,048$2,967,500$2,520,000n/a
Attached$534,950$519,000n/an/a$329,900n/a$673,000$421,875$440,000$568,500$424,900n/a$725,000$962,400n/an/an/a
Apartment$383,000$342,000$358,000n/a$219,900$325,000$419,950$267,500$379,900$339,900n/an/a$382,900$554,000n/an/a
Detached153167685190361496439224345920621198201,723
Attached109631006817563415141311243941624733
Apartment1849831032109123573017414519450227201,600
Detached$1,212,000$891,000$832,500n/a$560,500$806,500$1,300,000$650,870$999,900$1,155,500$659,500$360,250$1,200,000$2,888,000$2,370,000$919,000
Attached$603,000$490,000n/an/a$326,000n/a$717,000$396,000n/a$570,000$419,900n/a$686,000$885,738n/a$489,000n/a
Apartment$401,500$325,000$359,000n/a$210,000$306,000$434,900$237,525$367,500$360,500n/an/a$412,000$504,500$779,000$252,000
Detached112146707134481354836166316717717594161,462
Attached9961505194743261132085071924636
Apartment1905710038789438241416814544221161,308
Detached$975,000$763,750$690,500n/a$490,450$696,800$1,015,000$545,000$910,500$1,027,000$467,500$390,000$998,000$2,300,000$2,135,000n/a
Attached$520,000$480,500n/an/a$287,000n/a$620,000$389,000$418,000$538,000$367,450n/a$635,421$915,500n/a$557,500n/a
Apartment$360,000$291,944n/an/a$229,000$292,500$361,688$227,403$309,500$372,000n/an/a$340,450$484,250$709,000n/a
Detached887840376259261988533071771,2261803451,0971,142575929,246
Attached5432986003418431518210967912844290492661343,765
Apartment1,107581132018754264427014998685419832,6781051438,633
Detached$1,228,000$870,300$820,000$400,000$535,000$798,950$1,275,000$640,000$960,000$1,166,500$636,250$392,000$1,167,850$2,720,000$2,345,000$1,040,000
Attached$530,000$501,200$499,900n/a$318,900$454,400$679,000$408,000$414,000$560,000$411,500$274,500$715,000$919,500$1,054,575$562,500n/a
Apartment$388,000$322,000$345,000n/a$215,450$306,000$412,000$244,200$368,000$350,000$253,000$230,000$374,900$515,000$737,500$270,000
Detached57368930121655181703257136848136267900972420687,127
Attached391266410245572101811325137024266323411292,889
Apartment88836786019139744717215072947387392,193881256,657
Detached$1,000,000$760,000$680,000$370,000$489,900$700,000$1,067,500$560,500$890,000$998,000$523,250$376,000$950,000$2,320,000$2,120,000$1,189,000
Attached$514,300$480,000$459,000n/a$302,000$422,000$659,500$384,000$419,500$528,800$356,431$239,900$649,500$862,633$1,290,000$567,500n/a
Apartment$371,800$294,888$337,500n/a$219,018$300,500$377,000$242,250$337,500$350,000$235,500$255,235$342,500$490,000$775,000$235,000
Note:MedianSellingPricesarenotreportedforareaswithlessthan20salesorfortheGulfIslands
Median
Selling
Price
Number
of
Sales
Median
Selling
Price
May
2015
June
2014
Jan.-
Jun.2015
Jan.-
Jun.2014
Median
Selling
Price
Number
of
Sales
Median
Selling
Price
Number
of
Sales
June
2015
Number
of
Sales
Median
Selling
Price
Number
of
Sales
June
2015
Year-to-date
Year-to-date
6222015MLS®
LISTINGSFacts
Burnaby
Coquitlam
Delta-South
Islands-Gulf
MapleRidge/PittMeadows
NewWestminster
NorthVancouver
PortCoquitlam
PortMoody/Belcarra
Richmond
Squamish
SunshineCoast
VancouverEast
VancouverWest
WestVancouver/HoweSound
Whistler/Pemberton
Detached230230751020959194773934932120256287216512,434
Attached141841107517565519166203811061242888
Apartment364195300951511419944306151023473426372,481
Detached77%87%100%70%89%78%80%101%85%68%131%88%86%82%47%33%
Attached68%67%82%n/a95%76%109%62%132%70%135%267%56%83%108%43%n/a
Apartment67%67%87%n/a47%72%85%56%84%62%120%90%85%76%62%51%
Detached219222791921042193805229850130288289183352,389
Attached1336211088166644191502613731171633867
Apartment300141300591521689545323171024072446352,385
Detached70%75%86%26%90%86%77%80%75%75%68%45%72%73%54%57%
Attached82%102%91%n/a77%106%85%77%79%94%119%92%59%80%100%73%n/a
Apartment61%70%103%n/a54%72%73%60%67%54%82%50%81%69%59%57%
Detached201183732120042177505428431123245328166462,224
Attached1396511055165443321531318691181334833
Apartment29013031057162160564026973523373428502,282
Detached56%80%96%33%67%114%76%96%67%58%100%54%72%53%57%35%
Attached71%94%45%n/a93%56%87%100%81%74%154%44%72%60%69%71%n/a
Apartment66%44%32%n/a67%48%59%68%60%52%86%23%62%60%75%32%
Detached1,3101,152454641,2502521,1773932621,8022346841,5271,8811,20218213,826
Attached79840275148912238525913388415865396739911935,190
Apartment1,88898517304019641,0645032501,916107571,4314,28719723214,455
Detached68%73%83%39%74%79%72%78%68%68%77%50%72%61%48%51%
Attached68%74%80%0%70%69%82%70%82%77%81%68%73%67%73%69%n/a
Apartment59%59%76%n/a47%56%61%54%60%51%79%72%69%62%53%62%
Detached1,2531,164532901,2403011,1593492541,7432447571,4382,0241,04118513,774
Attached6863976624469134926117890211554447671811964,942
Apartment1,67486114904028931,0814322541,76982961,3834,32020623313,835
Detached46%59%57%23%53%60%61%74%54%49%56%35%63%48%40%37%
Attached57%67%62%0%55%63%60%69%74%57%61%44%60%48%51%66%n/a
Apartment53%43%58%n/a48%44%41%40%59%41%57%40%53%51%43%54%
*Year-to-datelistingsrepresentacumulativetotaloflistingsratherthantotalactivelistings.
Number
of
Listings
June
2015
Number
of
Listings
%Salesto
Listings
Number
of
Listings
%Salesto
Listings
Number
of
Listings
%Salesto
Listings
May
2015
June
2014
Jan.-
Jun.2015
Jan.-
Jun.2014
%Salesto
Listings
Number
of
Listings
%Salesto
Listings
June
2015
Year-to-date*
Year-to-date*
Listing & Sales Activity Summary
Listings Sales
1 2 3 Col. 2 & 3 5 6 7 Col. 6 & 7 9 10 Col. 9 & 10
Jun May Jun Percentage Jun May Jun Percentage Apr 2014 - Apr 2015 - Percentage
2014 2015 2015 Variance 2014 2015 2015 Variance Jun 2014 Jun 2015 Variance
BURNABY % % %
DETACHED 201 219 230 5.0 112 153 177 15.7 344 492 43.0
ATTACHED 139 133 141 6.0 99 109 96 -11.9 244 310 27.0
APARTMENTS 290 300 364 21.3 190 184 244 32.6 513 637 24.2
COQUITLAM
DETACHED 183 222 230 3.6 146 167 199 19.2 437 529 21.1
ATTACHED 65 62 84 35.5 61 63 56 -11.1 154 179 16.2
APARTMENTS 130 141 195 38.3 57 98 130 32.7 206 330 60.2
DELTA
DETACHED 73 79 75 -5.1 70 68 75 10.3 198 225 13.6
ATTACHED 11 11 11 0.0 5 10 9 -10.0 33 38 15.2
APARTMENTS 31 30 30 0.0 10 31 26 -16.1 52 80 53.8
MAPLE RIDGE/PITT MEADOWS
DETACHED 200 210 209 -0.5 134 190 187 -1.6 394 571 44.9
ATTACHED 55 88 75 -14.8 51 68 71 4.4 150 223 48.7
APARTMENTS 57 59 95 61.0 38 32 45 40.6 100 111 11.0
NORTH VANCOUVER
DETACHED 177 193 194 0.5 135 149 156 4.7 421 472 12.1
ATTACHED 54 66 56 -15.2 47 56 61 8.9 129 175 35.7
APARTMENTS 160 168 141 -16.1 94 123 120 -2.4 257 352 37.0
NEW WESTMINSTER
DETACHED 42 42 59 40.5 48 36 46 27.8 119 119 0.0
ATTACHED 16 16 17 6.3 9 17 13 -23.5 32 47 46.9
APARTMENTS 162 152 151 -0.7 78 109 109 0.0 221 319 44.3
PORT MOODY/BELCARRA
DETACHED 54 52 39 -25.0 36 39 33 -15.4 93 111 19.4
ATTACHED 32 19 19 0.0 26 15 25 66.7 81 67 -17.3
APARTMENTS 40 45 44 -2.2 24 30 37 23.3 94 94 0.0
PORT COQUITLAM
DETACHED 50 80 77 -3.8 48 64 78 21.9 156 198 26.9
ATTACHED 43 44 55 25.0 43 34 34 0.0 105 97 -7.6
APARTMENTS 56 95 99 4.2 38 57 55 -3.5 95 170 78.9
RICHMOND
DETACHED 284 298 349 17.1 166 224 238 6.3 455 715 57.1
ATTACHED 153 150 166 10.7 113 141 117 -17.0 298 402 34.9
APARTMENTS 269 323 306 -5.3 141 174 190 9.2 405 551 36.0
SUNSHINE COAST
DETACHED 123 130 120 -7.7 67 59 106 79.7 183 225 23.0
ATTACHED 18 13 3 -76.9 8 12 8 -33.3 11 33 200.0
APARTMENTS 35 10 10 0.0 8 5 9 80.0 21 23 9.5
SQUAMISH
DETACHED 31 50 32 -36.0 31 34 42 23.5 82 106 29.3
ATTACHED 13 26 20 -23.1 20 31 27 -12.9 44 77 75.0
APARTMENTS 7 17 15 -11.8 6 14 18 28.6 24 49 104.2
VANCOUVER EAST
DETACHED 245 288 256 -11.1 177 206 221 7.3 530 647 22.1
ATTACHED 69 73 81 11.0 50 43 45 4.7 152 162 6.6
APARTMENTS 233 240 234 -2.5 145 194 199 2.6 408 563 38.0
VANCOUVER WEST
DETACHED 328 289 287 -0.7 175 211 236 11.8 536 667 24.4
ATTACHED 118 117 106 -9.4 71 94 88 -6.4 199 285 43.2
APARTMENTS 734 724 734 1.4 442 502 557 11.0 1252 1543 23.2
WHISTLER/PEMBERTON
DETACHED 46 35 51 45.7 16 20 17 -15.0 36 56 55.6
ATTACHED 34 33 42 27.3 24 24 18 -25.0 69 65 -5.8
APARTMENTS 50 35 37 5.7 16 20 19 -5.0 65 71 9.2
WEST VANCOUVER/HOWE SOUND
DETACHED 166 183 216 18.0 94 98 102 4.1 252 309 22.6
ATTACHED 13 16 12 -25.0 9 16 13 -18.8 24 39 62.5
APARTMENTS 28 46 26 -43.5 21 27 16 -40.7 53 60 13.2
GRAND TOTALS
DETACHED 2203 2370 2424 2.3 1455 1718 1913 11.4 4236 5442 28.5
ATTACHED 833 867 888 2.4 636 733 681 -7.1 1725 2199 27.5
APARTMENTS 2282 2385 2481 4.0 1308 1600 1774 10.9 3766 4953 31.5
ResidentialAverageSalePrices-January1977toJune2015
0
200
400
600
800
1000
1200
1400
1600
197719781979198019811982198319841985198619871988198919901991199219931994199519961997199819992000200120022003200420052006200720082009201020112012201320142015
DETACHEDCONDOMINIUMATTACHEDAPARTMENTS
INTHOUSANDS($)
NOTE:From1977-1984condominiumaverageswerenotseparatedintoattached&apartment.
$626,014
$479,937
$1,442,296

More Related Content

What's hot

REBGV September 2016 Stats Package Mike Stewart Vancouver Realtor
REBGV September 2016 Stats Package Mike Stewart Vancouver RealtorREBGV September 2016 Stats Package Mike Stewart Vancouver Realtor
REBGV September 2016 Stats Package Mike Stewart Vancouver Realtor
Mike Stewart
 
October 2016 REBGV Statistics Package Vancouver BC Mike Stewart Realtor
October 2016 REBGV Statistics Package Vancouver BC Mike Stewart RealtorOctober 2016 REBGV Statistics Package Vancouver BC Mike Stewart Realtor
October 2016 REBGV Statistics Package Vancouver BC Mike Stewart Realtor
Mike Stewart
 
January 2017 Rebgv Statistics Package Mike Stewart Vancouver Realtor
January 2017 Rebgv Statistics Package Mike Stewart Vancouver RealtorJanuary 2017 Rebgv Statistics Package Mike Stewart Vancouver Realtor
January 2017 Rebgv Statistics Package Mike Stewart Vancouver Realtor
Mike Stewart
 
December 2016 rebgv statistics package mike stewart vancouver realtor
December 2016 rebgv statistics package mike stewart vancouver realtorDecember 2016 rebgv statistics package mike stewart vancouver realtor
December 2016 rebgv statistics package mike stewart vancouver realtor
Mike Stewart
 
March 2017 Rebgv Stats Package Mike Stewart
March 2017 Rebgv Stats Package Mike StewartMarch 2017 Rebgv Stats Package Mike Stewart
March 2017 Rebgv Stats Package Mike Stewart
Mike Stewart
 
February 2017 REBGV Statistics Package Mike Stewart Realtor
February 2017 REBGV Statistics Package Mike Stewart RealtorFebruary 2017 REBGV Statistics Package Mike Stewart Realtor
February 2017 REBGV Statistics Package Mike Stewart Realtor
Mike Stewart
 
April 2017 Real Estate Board of Greater Vancouver Statistics Package with Charts
April 2017 Real Estate Board of Greater Vancouver Statistics Package with ChartsApril 2017 Real Estate Board of Greater Vancouver Statistics Package with Charts
April 2017 Real Estate Board of Greater Vancouver Statistics Package with Charts
Mike Stewart
 
May 2017 REBGV Stats
May 2017 REBGV Stats May 2017 REBGV Stats
May 2017 REBGV Stats
Mike Stewart
 
August 2017 REBGV Stats Mike Stewart Realtor
August 2017 REBGV Stats Mike Stewart RealtorAugust 2017 REBGV Stats Mike Stewart Realtor
August 2017 REBGV Stats Mike Stewart Realtor
Mike Stewart
 
Rebgv stats-pkg-june-2019
Rebgv stats-pkg-june-2019Rebgv stats-pkg-june-2019
Rebgv stats-pkg-june-2019
Vicky Aulakh
 
Real Estate Board of Greater Vancouver Statistics Package July 2021
Real Estate Board of Greater Vancouver Statistics Package July 2021Real Estate Board of Greater Vancouver Statistics Package July 2021
Real Estate Board of Greater Vancouver Statistics Package July 2021
Vicky Aulakh
 
Metro Vancouver Statistics Report October 2021
Metro Vancouver Statistics Report October 2021Metro Vancouver Statistics Report October 2021
Metro Vancouver Statistics Report October 2021
VickyAulakh1
 
REBGV Statistics Package April 2021
REBGV Statistics Package April 2021REBGV Statistics Package April 2021
REBGV Statistics Package April 2021
Vicky Aulakh
 
Real Estate Board of Greater Vancouver Statistics Package October 2021
Real Estate Board of Greater Vancouver Statistics Package October 2021Real Estate Board of Greater Vancouver Statistics Package October 2021
Real Estate Board of Greater Vancouver Statistics Package October 2021
VickyAulakh1
 
Real Estate Board of Greater Vancouver Statistics Package - November 2021
Real Estate Board of Greater Vancouver Statistics Package - November 2021Real Estate Board of Greater Vancouver Statistics Package - November 2021
Real Estate Board of Greater Vancouver Statistics Package - November 2021
VickyAulakh1
 
Real Estate Board of Greater Vancouver Statistics Package August 2021
Real Estate Board of Greater Vancouver Statistics Package August 2021Real Estate Board of Greater Vancouver Statistics Package August 2021
Real Estate Board of Greater Vancouver Statistics Package August 2021
Vicky Aulakh
 
Rebgv stats-pkg-february-2019
Rebgv stats-pkg-february-2019Rebgv stats-pkg-february-2019
Rebgv stats-pkg-february-2019
Kathryn Huang
 
Rebgv stats-pkg-march-2019
Rebgv stats-pkg-march-2019Rebgv stats-pkg-march-2019
Rebgv stats-pkg-march-2019
Kathryn Huang
 
REBGV Statistics Package May 2020
REBGV Statistics Package May 2020REBGV Statistics Package May 2020
REBGV Statistics Package May 2020
Vicky Aulakh
 
REBGV STATS PACKAGE JULY 2017
REBGV STATS PACKAGE JULY 2017REBGV STATS PACKAGE JULY 2017
REBGV STATS PACKAGE JULY 2017
Marcella Riccardi
 

What's hot (20)

REBGV September 2016 Stats Package Mike Stewart Vancouver Realtor
REBGV September 2016 Stats Package Mike Stewart Vancouver RealtorREBGV September 2016 Stats Package Mike Stewart Vancouver Realtor
REBGV September 2016 Stats Package Mike Stewart Vancouver Realtor
 
October 2016 REBGV Statistics Package Vancouver BC Mike Stewart Realtor
October 2016 REBGV Statistics Package Vancouver BC Mike Stewart RealtorOctober 2016 REBGV Statistics Package Vancouver BC Mike Stewart Realtor
October 2016 REBGV Statistics Package Vancouver BC Mike Stewart Realtor
 
January 2017 Rebgv Statistics Package Mike Stewart Vancouver Realtor
January 2017 Rebgv Statistics Package Mike Stewart Vancouver RealtorJanuary 2017 Rebgv Statistics Package Mike Stewart Vancouver Realtor
January 2017 Rebgv Statistics Package Mike Stewart Vancouver Realtor
 
December 2016 rebgv statistics package mike stewart vancouver realtor
December 2016 rebgv statistics package mike stewart vancouver realtorDecember 2016 rebgv statistics package mike stewart vancouver realtor
December 2016 rebgv statistics package mike stewart vancouver realtor
 
March 2017 Rebgv Stats Package Mike Stewart
March 2017 Rebgv Stats Package Mike StewartMarch 2017 Rebgv Stats Package Mike Stewart
March 2017 Rebgv Stats Package Mike Stewart
 
February 2017 REBGV Statistics Package Mike Stewart Realtor
February 2017 REBGV Statistics Package Mike Stewart RealtorFebruary 2017 REBGV Statistics Package Mike Stewart Realtor
February 2017 REBGV Statistics Package Mike Stewart Realtor
 
April 2017 Real Estate Board of Greater Vancouver Statistics Package with Charts
April 2017 Real Estate Board of Greater Vancouver Statistics Package with ChartsApril 2017 Real Estate Board of Greater Vancouver Statistics Package with Charts
April 2017 Real Estate Board of Greater Vancouver Statistics Package with Charts
 
May 2017 REBGV Stats
May 2017 REBGV Stats May 2017 REBGV Stats
May 2017 REBGV Stats
 
August 2017 REBGV Stats Mike Stewart Realtor
August 2017 REBGV Stats Mike Stewart RealtorAugust 2017 REBGV Stats Mike Stewart Realtor
August 2017 REBGV Stats Mike Stewart Realtor
 
Rebgv stats-pkg-june-2019
Rebgv stats-pkg-june-2019Rebgv stats-pkg-june-2019
Rebgv stats-pkg-june-2019
 
Real Estate Board of Greater Vancouver Statistics Package July 2021
Real Estate Board of Greater Vancouver Statistics Package July 2021Real Estate Board of Greater Vancouver Statistics Package July 2021
Real Estate Board of Greater Vancouver Statistics Package July 2021
 
Metro Vancouver Statistics Report October 2021
Metro Vancouver Statistics Report October 2021Metro Vancouver Statistics Report October 2021
Metro Vancouver Statistics Report October 2021
 
REBGV Statistics Package April 2021
REBGV Statistics Package April 2021REBGV Statistics Package April 2021
REBGV Statistics Package April 2021
 
Real Estate Board of Greater Vancouver Statistics Package October 2021
Real Estate Board of Greater Vancouver Statistics Package October 2021Real Estate Board of Greater Vancouver Statistics Package October 2021
Real Estate Board of Greater Vancouver Statistics Package October 2021
 
Real Estate Board of Greater Vancouver Statistics Package - November 2021
Real Estate Board of Greater Vancouver Statistics Package - November 2021Real Estate Board of Greater Vancouver Statistics Package - November 2021
Real Estate Board of Greater Vancouver Statistics Package - November 2021
 
Real Estate Board of Greater Vancouver Statistics Package August 2021
Real Estate Board of Greater Vancouver Statistics Package August 2021Real Estate Board of Greater Vancouver Statistics Package August 2021
Real Estate Board of Greater Vancouver Statistics Package August 2021
 
Rebgv stats-pkg-february-2019
Rebgv stats-pkg-february-2019Rebgv stats-pkg-february-2019
Rebgv stats-pkg-february-2019
 
Rebgv stats-pkg-march-2019
Rebgv stats-pkg-march-2019Rebgv stats-pkg-march-2019
Rebgv stats-pkg-march-2019
 
REBGV Statistics Package May 2020
REBGV Statistics Package May 2020REBGV Statistics Package May 2020
REBGV Statistics Package May 2020
 
REBGV STATS PACKAGE JULY 2017
REBGV STATS PACKAGE JULY 2017REBGV STATS PACKAGE JULY 2017
REBGV STATS PACKAGE JULY 2017
 

Similar to June 2015 rebgv stats package mike stewart

Supply response emerges in Metro Vancouver’s active housing market
Supply response emerges in Metro Vancouver’s active housing marketSupply response emerges in Metro Vancouver’s active housing market
Supply response emerges in Metro Vancouver’s active housing market
AlexanderMackenzie13
 
REBGV STATS PACKAGE JUNE 2017
REBGV STATS PACKAGE JUNE 2017REBGV STATS PACKAGE JUNE 2017
REBGV STATS PACKAGE JUNE 2017
vanrealtor1
 
March 2020 REBGV Statistics Package
March 2020 REBGV Statistics PackageMarch 2020 REBGV Statistics Package
March 2020 REBGV Statistics Package
Mike Stewart
 
March 2020-rebgv-stats-pkg
March 2020-rebgv-stats-pkgMarch 2020-rebgv-stats-pkg
March 2020-rebgv-stats-pkg
Matt Scalena
 
Real Estate Board of Greater Vancouver Statistics Package March 2021
Real Estate Board of Greater Vancouver Statistics Package March 2021Real Estate Board of Greater Vancouver Statistics Package March 2021
Real Estate Board of Greater Vancouver Statistics Package March 2021
Vicky Aulakh
 
Greater Vancouver Realtors Statistics Package April 2024
Greater Vancouver Realtors Statistics Package April 2024Greater Vancouver Realtors Statistics Package April 2024
Greater Vancouver Realtors Statistics Package April 2024
VickyAulakh1
 
Rebgv stats-pkg-january-2019
Rebgv stats-pkg-january-2019Rebgv stats-pkg-january-2019
Rebgv stats-pkg-january-2019
Kathryn Huang
 
2018 dec-stats-pkg
2018 dec-stats-pkg2018 dec-stats-pkg
2018 dec-stats-pkg
Sherryl Jacobs
 
Rebgv stats-pkg-december-2018
Rebgv stats-pkg-december-2018Rebgv stats-pkg-december-2018
Rebgv stats-pkg-december-2018
Kathryn Huang
 
October 2017 REBGV Stats Mike Stewart Vancouver Realtor
October 2017 REBGV Stats Mike Stewart Vancouver RealtorOctober 2017 REBGV Stats Mike Stewart Vancouver Realtor
October 2017 REBGV Stats Mike Stewart Vancouver Realtor
Mike Stewart
 
Vancouver real estate stats package, August 2013
Vancouver real estate stats package, August 2013Vancouver real estate stats package, August 2013
Vancouver real estate stats package, August 2013
Matt Collinge
 
2021 June REBGV Stats Package
2021 June REBGV Stats Package2021 June REBGV Stats Package
2021 June REBGV Stats Package
AlexanderMackenzie13
 
2021 June - REBGV Statistics Package
2021 June - REBGV Statistics Package2021 June - REBGV Statistics Package
2021 June - REBGV Statistics Package
Vicky Aulakh
 
REBGV Stats Package February 2021
REBGV Stats Package February 2021REBGV Stats Package February 2021
REBGV Stats Package February 2021
Vicky Aulakh
 
Rebgv stats-pkg-may-2019
Rebgv stats-pkg-may-2019Rebgv stats-pkg-may-2019
Rebgv stats-pkg-may-2019
Kathryn Huang
 
May-2019 Stats Package for Greater Vancouver
May-2019 Stats Package for Greater VancouverMay-2019 Stats Package for Greater Vancouver
May-2019 Stats Package for Greater Vancouver
BC PRIME Realty
 
REBGV Statistic Package December 2020
REBGV Statistic Package December 2020REBGV Statistic Package December 2020
REBGV Statistic Package December 2020
Vicky Aulakh
 
Rebgv stats-pkg-february-2019
Rebgv stats-pkg-february-2019Rebgv stats-pkg-february-2019
Rebgv stats-pkg-february-2019
Sherryl Jacobs
 
Real Estate Board of Greater Vancouver - Statistics Package for July 2021
Real Estate Board of Greater Vancouver - Statistics Package for July 2021Real Estate Board of Greater Vancouver - Statistics Package for July 2021
Real Estate Board of Greater Vancouver - Statistics Package for July 2021
Alexander Mackenzie, PMP
 
Rebgv stats-pkg-november-2018
Rebgv stats-pkg-november-2018Rebgv stats-pkg-november-2018
Rebgv stats-pkg-november-2018
Kathryn Huang
 

Similar to June 2015 rebgv stats package mike stewart (20)

Supply response emerges in Metro Vancouver’s active housing market
Supply response emerges in Metro Vancouver’s active housing marketSupply response emerges in Metro Vancouver’s active housing market
Supply response emerges in Metro Vancouver’s active housing market
 
REBGV STATS PACKAGE JUNE 2017
REBGV STATS PACKAGE JUNE 2017REBGV STATS PACKAGE JUNE 2017
REBGV STATS PACKAGE JUNE 2017
 
March 2020 REBGV Statistics Package
March 2020 REBGV Statistics PackageMarch 2020 REBGV Statistics Package
March 2020 REBGV Statistics Package
 
March 2020-rebgv-stats-pkg
March 2020-rebgv-stats-pkgMarch 2020-rebgv-stats-pkg
March 2020-rebgv-stats-pkg
 
Real Estate Board of Greater Vancouver Statistics Package March 2021
Real Estate Board of Greater Vancouver Statistics Package March 2021Real Estate Board of Greater Vancouver Statistics Package March 2021
Real Estate Board of Greater Vancouver Statistics Package March 2021
 
Greater Vancouver Realtors Statistics Package April 2024
Greater Vancouver Realtors Statistics Package April 2024Greater Vancouver Realtors Statistics Package April 2024
Greater Vancouver Realtors Statistics Package April 2024
 
Rebgv stats-pkg-january-2019
Rebgv stats-pkg-january-2019Rebgv stats-pkg-january-2019
Rebgv stats-pkg-january-2019
 
2018 dec-stats-pkg
2018 dec-stats-pkg2018 dec-stats-pkg
2018 dec-stats-pkg
 
Rebgv stats-pkg-december-2018
Rebgv stats-pkg-december-2018Rebgv stats-pkg-december-2018
Rebgv stats-pkg-december-2018
 
October 2017 REBGV Stats Mike Stewart Vancouver Realtor
October 2017 REBGV Stats Mike Stewart Vancouver RealtorOctober 2017 REBGV Stats Mike Stewart Vancouver Realtor
October 2017 REBGV Stats Mike Stewart Vancouver Realtor
 
Vancouver real estate stats package, August 2013
Vancouver real estate stats package, August 2013Vancouver real estate stats package, August 2013
Vancouver real estate stats package, August 2013
 
2021 June REBGV Stats Package
2021 June REBGV Stats Package2021 June REBGV Stats Package
2021 June REBGV Stats Package
 
2021 June - REBGV Statistics Package
2021 June - REBGV Statistics Package2021 June - REBGV Statistics Package
2021 June - REBGV Statistics Package
 
REBGV Stats Package February 2021
REBGV Stats Package February 2021REBGV Stats Package February 2021
REBGV Stats Package February 2021
 
Rebgv stats-pkg-may-2019
Rebgv stats-pkg-may-2019Rebgv stats-pkg-may-2019
Rebgv stats-pkg-may-2019
 
May-2019 Stats Package for Greater Vancouver
May-2019 Stats Package for Greater VancouverMay-2019 Stats Package for Greater Vancouver
May-2019 Stats Package for Greater Vancouver
 
REBGV Statistic Package December 2020
REBGV Statistic Package December 2020REBGV Statistic Package December 2020
REBGV Statistic Package December 2020
 
Rebgv stats-pkg-february-2019
Rebgv stats-pkg-february-2019Rebgv stats-pkg-february-2019
Rebgv stats-pkg-february-2019
 
Real Estate Board of Greater Vancouver - Statistics Package for July 2021
Real Estate Board of Greater Vancouver - Statistics Package for July 2021Real Estate Board of Greater Vancouver - Statistics Package for July 2021
Real Estate Board of Greater Vancouver - Statistics Package for July 2021
 
Rebgv stats-pkg-november-2018
Rebgv stats-pkg-november-2018Rebgv stats-pkg-november-2018
Rebgv stats-pkg-november-2018
 

More from Mike Stewart

1_FINTRAC_clientinfo_2021.pdf
1_FINTRAC_clientinfo_2021.pdf1_FINTRAC_clientinfo_2021.pdf
1_FINTRAC_clientinfo_2021.pdf
Mike Stewart
 
Mike Stewart PREC Listing Contract
Mike Stewart PREC Listing ContractMike Stewart PREC Listing Contract
Mike Stewart PREC Listing Contract
Mike Stewart
 
November 2017 rebgv stats mike stewart real estate agent
November 2017 rebgv stats mike stewart real estate agentNovember 2017 rebgv stats mike stewart real estate agent
November 2017 rebgv stats mike stewart real estate agent
Mike Stewart
 
September 2017 rebgv statistics package mike stewart realtor
September 2017 rebgv statistics package mike stewart realtorSeptember 2017 rebgv statistics package mike stewart realtor
September 2017 rebgv statistics package mike stewart realtor
Mike Stewart
 
July 2017 Real Estate Board of Greater Vancouver Stats Package Mike Stewart r...
July 2017 Real Estate Board of Greater Vancouver Stats Package Mike Stewart r...July 2017 Real Estate Board of Greater Vancouver Stats Package Mike Stewart r...
July 2017 Real Estate Board of Greater Vancouver Stats Package Mike Stewart r...
Mike Stewart
 
June 2017 REBGV Statistics Package
June 2017 REBGV Statistics PackageJune 2017 REBGV Statistics Package
June 2017 REBGV Statistics Package
Mike Stewart
 
15% tax on international buyers in vancouver
15% tax on international buyers in vancouver15% tax on international buyers in vancouver
15% tax on international buyers in vancouver
Mike Stewart
 
REBGV Stats for December 2011 Courtesy Mike Stewart Vancouver Realtor
REBGV Stats for December 2011 Courtesy Mike Stewart Vancouver RealtorREBGV Stats for December 2011 Courtesy Mike Stewart Vancouver Realtor
REBGV Stats for December 2011 Courtesy Mike Stewart Vancouver Realtor
Mike Stewart
 
October 2011 REBGV Stats Mike Stewart
October 2011 REBGV Stats Mike StewartOctober 2011 REBGV Stats Mike Stewart
October 2011 REBGV Stats Mike Stewart
Mike Stewart
 
REBGV Stats for Sept 2011 Mike Stewart
REBGV Stats for Sept 2011 Mike StewartREBGV Stats for Sept 2011 Mike Stewart
REBGV Stats for Sept 2011 Mike Stewart
Mike Stewart
 

More from Mike Stewart (10)

1_FINTRAC_clientinfo_2021.pdf
1_FINTRAC_clientinfo_2021.pdf1_FINTRAC_clientinfo_2021.pdf
1_FINTRAC_clientinfo_2021.pdf
 
Mike Stewart PREC Listing Contract
Mike Stewart PREC Listing ContractMike Stewart PREC Listing Contract
Mike Stewart PREC Listing Contract
 
November 2017 rebgv stats mike stewart real estate agent
November 2017 rebgv stats mike stewart real estate agentNovember 2017 rebgv stats mike stewart real estate agent
November 2017 rebgv stats mike stewart real estate agent
 
September 2017 rebgv statistics package mike stewart realtor
September 2017 rebgv statistics package mike stewart realtorSeptember 2017 rebgv statistics package mike stewart realtor
September 2017 rebgv statistics package mike stewart realtor
 
July 2017 Real Estate Board of Greater Vancouver Stats Package Mike Stewart r...
July 2017 Real Estate Board of Greater Vancouver Stats Package Mike Stewart r...July 2017 Real Estate Board of Greater Vancouver Stats Package Mike Stewart r...
July 2017 Real Estate Board of Greater Vancouver Stats Package Mike Stewart r...
 
June 2017 REBGV Statistics Package
June 2017 REBGV Statistics PackageJune 2017 REBGV Statistics Package
June 2017 REBGV Statistics Package
 
15% tax on international buyers in vancouver
15% tax on international buyers in vancouver15% tax on international buyers in vancouver
15% tax on international buyers in vancouver
 
REBGV Stats for December 2011 Courtesy Mike Stewart Vancouver Realtor
REBGV Stats for December 2011 Courtesy Mike Stewart Vancouver RealtorREBGV Stats for December 2011 Courtesy Mike Stewart Vancouver Realtor
REBGV Stats for December 2011 Courtesy Mike Stewart Vancouver Realtor
 
October 2011 REBGV Stats Mike Stewart
October 2011 REBGV Stats Mike StewartOctober 2011 REBGV Stats Mike Stewart
October 2011 REBGV Stats Mike Stewart
 
REBGV Stats for Sept 2011 Mike Stewart
REBGV Stats for Sept 2011 Mike StewartREBGV Stats for Sept 2011 Mike Stewart
REBGV Stats for Sept 2011 Mike Stewart
 

Recently uploaded

Torun Center Residences Istanbul - Listing Turkey
Torun Center Residences Istanbul - Listing TurkeyTorun Center Residences Istanbul - Listing Turkey
Torun Center Residences Istanbul - Listing Turkey
Listing Turkey
 
Investing In The US As A Canadian… And How To Do It RIGHT!! (feat. Erwin Szet...
Investing In The US As A Canadian… And How To Do It RIGHT!! (feat. Erwin Szet...Investing In The US As A Canadian… And How To Do It RIGHT!! (feat. Erwin Szet...
Investing In The US As A Canadian… And How To Do It RIGHT!! (feat. Erwin Szet...
Volition Properties
 
How to Scan Tenants in NYC - You Should Know!
How to Scan Tenants in NYC - You Should Know!How to Scan Tenants in NYC - You Should Know!
How to Scan Tenants in NYC - You Should Know!
BelgiumManagement
 
Optimizing Your MCA Lead Capture Process for Better Results
Optimizing Your MCA Lead Capture Process for Better ResultsOptimizing Your MCA Lead Capture Process for Better Results
Optimizing Your MCA Lead Capture Process for Better Results
Lead Generation Media
 
Green Homes, Islamabad Presentation .pdf
Green Homes, Islamabad Presentation .pdfGreen Homes, Islamabad Presentation .pdf
Green Homes, Islamabad Presentation .pdf
ticktoktips
 
Hawthorn Module 1 Coverted to Slide Show - 04.06.2024.docx
Hawthorn Module 1 Coverted to Slide Show - 04.06.2024.docxHawthorn Module 1 Coverted to Slide Show - 04.06.2024.docx
Hawthorn Module 1 Coverted to Slide Show - 04.06.2024.docx
anothershaneroberts
 
2BHK-3BHK NEW FLAT FOR SALE IN TUPUDANA,RANCHI.
2BHK-3BHK NEW FLAT FOR SALE IN TUPUDANA,RANCHI.2BHK-3BHK NEW FLAT FOR SALE IN TUPUDANA,RANCHI.
2BHK-3BHK NEW FLAT FOR SALE IN TUPUDANA,RANCHI.
aashiyanastardevelop
 
One FNG by Group 108 Sector 142 Noida Construction Update
One FNG by Group 108 Sector 142 Noida Construction UpdateOne FNG by Group 108 Sector 142 Noida Construction Update
One FNG by Group 108 Sector 142 Noida Construction Update
One FNG
 
Brigade Insignia at Yelahanka Brochure.pdf
Brigade Insignia at Yelahanka Brochure.pdfBrigade Insignia at Yelahanka Brochure.pdf
Brigade Insignia at Yelahanka Brochure.pdf
SachinChauhan191
 
Presentation to Windust Meadows HOA Board of Directors June 4, 2024: Focus o...
Presentation to Windust Meadows HOA Board of Directors June 4, 2024:  Focus o...Presentation to Windust Meadows HOA Board of Directors June 4, 2024:  Focus o...
Presentation to Windust Meadows HOA Board of Directors June 4, 2024: Focus o...
Joseph Lewis Aguirre
 
Simpolo Company Profile & Corporate Logo
Simpolo Company Profile & Corporate LogoSimpolo Company Profile & Corporate Logo
Simpolo Company Profile & Corporate Logo
simpolosparkteam
 
Architectural & Interior design portfolio.pdf
Architectural & Interior design portfolio.pdfArchitectural & Interior design portfolio.pdf
Architectural & Interior design portfolio.pdf
susantebinum
 
Killer Referans Bahcesehir Catalog Listing Turkey
Killer Referans Bahcesehir Catalog Listing TurkeyKiller Referans Bahcesehir Catalog Listing Turkey
Killer Referans Bahcesehir Catalog Listing Turkey
Listing Turkey
 
Sense Levent Kagithane Catalog - Listing Turkey
Sense Levent Kagithane Catalog - Listing TurkeySense Levent Kagithane Catalog - Listing Turkey
Sense Levent Kagithane Catalog - Listing Turkey
Listing Turkey
 
Rixos Tersane Istanbul Residences Brochure_May2024_ENG.pdf
Rixos Tersane Istanbul Residences Brochure_May2024_ENG.pdfRixos Tersane Istanbul Residences Brochure_May2024_ENG.pdf
Rixos Tersane Istanbul Residences Brochure_May2024_ENG.pdf
Listing Turkey
 
Urbanrise Paradise on Earth - Unveiling Unprecedented Luxury in Exquisite Vil...
Urbanrise Paradise on Earth - Unveiling Unprecedented Luxury in Exquisite Vil...Urbanrise Paradise on Earth - Unveiling Unprecedented Luxury in Exquisite Vil...
Urbanrise Paradise on Earth - Unveiling Unprecedented Luxury in Exquisite Vil...
JagadishKR1
 
Elegant Evergreen Homes - Luxury Apartments Redefining Comfort in Yelahanka, ...
Elegant Evergreen Homes - Luxury Apartments Redefining Comfort in Yelahanka, ...Elegant Evergreen Homes - Luxury Apartments Redefining Comfort in Yelahanka, ...
Elegant Evergreen Homes - Luxury Apartments Redefining Comfort in Yelahanka, ...
JagadishKR1
 
Riverview City Loni Kalbhor Pune Brochure
Riverview City Loni Kalbhor Pune BrochureRiverview City Loni Kalbhor Pune Brochure
Riverview City Loni Kalbhor Pune Brochure
kishor21012022
 
Deutsche EuroShop | Company Presentation | 06/24
Deutsche EuroShop | Company Presentation | 06/24Deutsche EuroShop | Company Presentation | 06/24
Deutsche EuroShop | Company Presentation | 06/24
Deutsche EuroShop AG
 
How to keep your Home naturally Cool and Warm
How to keep your Home naturally Cool and WarmHow to keep your Home naturally Cool and Warm
How to keep your Home naturally Cool and Warm
Vinra Construction
 

Recently uploaded (20)

Torun Center Residences Istanbul - Listing Turkey
Torun Center Residences Istanbul - Listing TurkeyTorun Center Residences Istanbul - Listing Turkey
Torun Center Residences Istanbul - Listing Turkey
 
Investing In The US As A Canadian… And How To Do It RIGHT!! (feat. Erwin Szet...
Investing In The US As A Canadian… And How To Do It RIGHT!! (feat. Erwin Szet...Investing In The US As A Canadian… And How To Do It RIGHT!! (feat. Erwin Szet...
Investing In The US As A Canadian… And How To Do It RIGHT!! (feat. Erwin Szet...
 
How to Scan Tenants in NYC - You Should Know!
How to Scan Tenants in NYC - You Should Know!How to Scan Tenants in NYC - You Should Know!
How to Scan Tenants in NYC - You Should Know!
 
Optimizing Your MCA Lead Capture Process for Better Results
Optimizing Your MCA Lead Capture Process for Better ResultsOptimizing Your MCA Lead Capture Process for Better Results
Optimizing Your MCA Lead Capture Process for Better Results
 
Green Homes, Islamabad Presentation .pdf
Green Homes, Islamabad Presentation .pdfGreen Homes, Islamabad Presentation .pdf
Green Homes, Islamabad Presentation .pdf
 
Hawthorn Module 1 Coverted to Slide Show - 04.06.2024.docx
Hawthorn Module 1 Coverted to Slide Show - 04.06.2024.docxHawthorn Module 1 Coverted to Slide Show - 04.06.2024.docx
Hawthorn Module 1 Coverted to Slide Show - 04.06.2024.docx
 
2BHK-3BHK NEW FLAT FOR SALE IN TUPUDANA,RANCHI.
2BHK-3BHK NEW FLAT FOR SALE IN TUPUDANA,RANCHI.2BHK-3BHK NEW FLAT FOR SALE IN TUPUDANA,RANCHI.
2BHK-3BHK NEW FLAT FOR SALE IN TUPUDANA,RANCHI.
 
One FNG by Group 108 Sector 142 Noida Construction Update
One FNG by Group 108 Sector 142 Noida Construction UpdateOne FNG by Group 108 Sector 142 Noida Construction Update
One FNG by Group 108 Sector 142 Noida Construction Update
 
Brigade Insignia at Yelahanka Brochure.pdf
Brigade Insignia at Yelahanka Brochure.pdfBrigade Insignia at Yelahanka Brochure.pdf
Brigade Insignia at Yelahanka Brochure.pdf
 
Presentation to Windust Meadows HOA Board of Directors June 4, 2024: Focus o...
Presentation to Windust Meadows HOA Board of Directors June 4, 2024:  Focus o...Presentation to Windust Meadows HOA Board of Directors June 4, 2024:  Focus o...
Presentation to Windust Meadows HOA Board of Directors June 4, 2024: Focus o...
 
Simpolo Company Profile & Corporate Logo
Simpolo Company Profile & Corporate LogoSimpolo Company Profile & Corporate Logo
Simpolo Company Profile & Corporate Logo
 
Architectural & Interior design portfolio.pdf
Architectural & Interior design portfolio.pdfArchitectural & Interior design portfolio.pdf
Architectural & Interior design portfolio.pdf
 
Killer Referans Bahcesehir Catalog Listing Turkey
Killer Referans Bahcesehir Catalog Listing TurkeyKiller Referans Bahcesehir Catalog Listing Turkey
Killer Referans Bahcesehir Catalog Listing Turkey
 
Sense Levent Kagithane Catalog - Listing Turkey
Sense Levent Kagithane Catalog - Listing TurkeySense Levent Kagithane Catalog - Listing Turkey
Sense Levent Kagithane Catalog - Listing Turkey
 
Rixos Tersane Istanbul Residences Brochure_May2024_ENG.pdf
Rixos Tersane Istanbul Residences Brochure_May2024_ENG.pdfRixos Tersane Istanbul Residences Brochure_May2024_ENG.pdf
Rixos Tersane Istanbul Residences Brochure_May2024_ENG.pdf
 
Urbanrise Paradise on Earth - Unveiling Unprecedented Luxury in Exquisite Vil...
Urbanrise Paradise on Earth - Unveiling Unprecedented Luxury in Exquisite Vil...Urbanrise Paradise on Earth - Unveiling Unprecedented Luxury in Exquisite Vil...
Urbanrise Paradise on Earth - Unveiling Unprecedented Luxury in Exquisite Vil...
 
Elegant Evergreen Homes - Luxury Apartments Redefining Comfort in Yelahanka, ...
Elegant Evergreen Homes - Luxury Apartments Redefining Comfort in Yelahanka, ...Elegant Evergreen Homes - Luxury Apartments Redefining Comfort in Yelahanka, ...
Elegant Evergreen Homes - Luxury Apartments Redefining Comfort in Yelahanka, ...
 
Riverview City Loni Kalbhor Pune Brochure
Riverview City Loni Kalbhor Pune BrochureRiverview City Loni Kalbhor Pune Brochure
Riverview City Loni Kalbhor Pune Brochure
 
Deutsche EuroShop | Company Presentation | 06/24
Deutsche EuroShop | Company Presentation | 06/24Deutsche EuroShop | Company Presentation | 06/24
Deutsche EuroShop | Company Presentation | 06/24
 
How to keep your Home naturally Cool and Warm
How to keep your Home naturally Cool and WarmHow to keep your Home naturally Cool and Warm
How to keep your Home naturally Cool and Warm
 

June 2015 rebgv stats package mike stewart