This document is a report that examines state support for academically talented low-income students in the United States. It analyzes state policies and student outcomes using 18 indicators related to identifying gifted students, resources for advanced learners, policies supporting talent development, tracking student progress, the percentage of students achieving advanced levels, and excellence gaps between low-income and other students. The report finds that few states have comprehensive policies to support advanced learning, especially for low-income students. It includes state-by-state grades on policy inputs and student outcomes and recommends that states take steps to better identify and support high-ability students from all economic backgrounds.


![23
EQUAL TALENTS, UNEQUAL OPPORTUNITIES JACK KENT COOKE FOUNDATION
all educators to have exposure to the needs of advanced students
in teacher and administrator preparation coursework, and monitor
and audit LEA gifted and talented programs for quality. Provide for
dual enrollment for high school students in college level coursework
either in local cooperating higher educational institutions, providing
AP courses or facilitating dual enrollment in bricks-and-mortar and
online college courses.
RECOMMENDATION 4:
Hold LEAs accountable for the performance of high-ability
students from all economic backgrounds.
State K-12 accountability systems often drive the discussion of
priorities in local school districts. Include in state accountability
systems measures of growth for high-ability students and other
indicators of excellence, identifying separately low-income and
other students.
CONCLUSION
The data indicators used in this report are the so-called “low
hanging fruit.” They were chosen because they were (relatively) easy
to collect and compile. They also represent steps which all states can
take to support advanced learning, without significant additional
effort or cost. Some of these policy interventions may actually save
states money, e.g., permitting acceleration moves students through
the system more quickly, thereby reducing the number of years a
student receives educational services.13
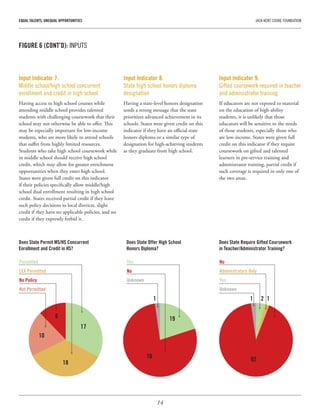
Yet even easy-to-implement policies such as permitting acceleration
are not universal. Rather, we repeatedly found that very smart
students from all income backgrounds are largely being ignored.
Although conventional wisdom holds that the United States
has moved away from the traditional, “one size fits all” model of
education, states are not creating systems that will allow advanced
students to move through the grades at a developmentally
appropriate pace. Individualized learning programs, which
theoretically would benefit high performers from all income
brackets, are simply not yet in place. Very few states require
that exceptionally high performing students have an Individual
Educational Plan, which is required for special education students.
Our most vulnerable high-ability students are paying a steep
price for this policy silence. Students from higher-income families
are more likely to live in districts where services are valued and
provided; and if not, they are more likely to have families that
seek out supplemental services such as afterschool, weekend, and
summer programs or leave public school entirely to pursue advanced
instruction in private schools or through homeschooling. Those
students are more likely to perform at advanced levels regardless of
state-level policy support; low-income students are much less likely
to do so.14
That high-ability, low-income children disproportionately
fall behind is not surprising; nor is it adequately documented or
squarely addressed.
The Cooke Foundation intends to conduct this study regularly.
The current set of indicators will be updated, and future iterations
will include surveys of state education agencies so as to broaden the
range of indicators that may be included. Our intention to refine the
analysis is, of course, no reason to delay action; children go through
their public school experiences once.
The alternative—to accept the excellence gap as inevitable—is a
recipe for long-term social and economic decline. The country
recently reached the point where roughly half its students are low-
income. As suggested by the evidence of the extraordinary support
that better-resourced families can provide their children, ever fewer
high-ability low-income students are performing at advanced
levels.15
If those two trends continue, it is reasonable to question
how the United States will satisfy its insatiable need for talent. We
are laying the groundwork for a persistent talent underclass. In the
final analysis the problem is stark: if we fail to reduce the barriers
to excellence for talent development of our brightest students, our
economic preeminence will be fundamentally jeopardized.
13 Some forms of acceleration may also require less differentiation on the part of
teachers, as students are placed in a more appropriate challenge level given their
ability in a specific subject.
14 Furthermore, although students from higher-income families may outperform
students from lower-income families in the United States, both groups of students
lag behind in international comparisons, even when controlling for family
socioeconomic status (Plucker et al., 2013).
15 Regarding low-income students, see http://nces.ed.gov/programs/digest/d13/
tables/dt13_204.10.asp and DeNavas-Walt, C., & Proctor, B. D. (2014). Income
and poverty in the United States: 2013 [U.S. Census Bureau, Current population
reports, P60-249]. Washington, DC: U.S. Government Printing Office.;
regarding performance of high-ability students, see Plucker et al. (2013).](https://image.slidesharecdn.com/d98c14f7-0f6d-42b3-b512-6ca0c2d89498-160613215706/85/JKCF-ETUO-Report-v2-23-320.jpg)