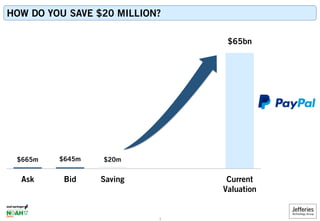
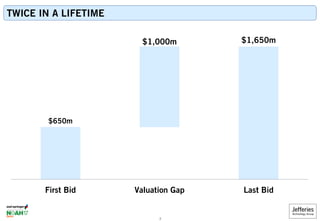
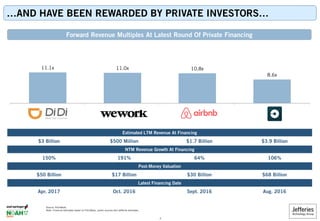
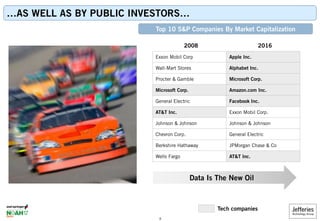
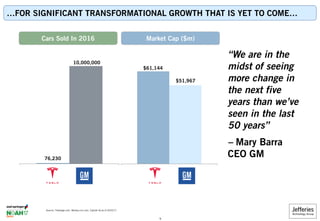
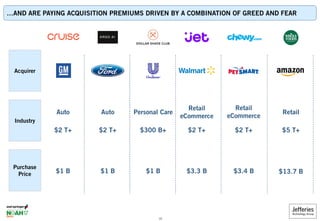
…unveiling aggressive new technology acquirers
Storm Duncan / Joint Global Head Of Technology M&A
Quit trying to buy me, I’m
busy disrupting you…
GET YOUR TICKET TODAY!
www.noah-conference.com
6-7
Old Billingsgate, London Tempodrom, Berlin
JUN20182-3 NOV2017
SAVE THE DATE
HOW DO YOU SAVE $20 MILLION?
$665m $645m $20m
$65bn
Ask Bid Saving Current
Valuation
1
TWICE IN A LIFETIME
$650m
$1,000m $1,650m
First Bid Valuation Gap Last Bid
2
FOOL ME ONCE, FOOL ME TWICE
Acquisition Price: $1.65 billion
Now:
#2 largest search engine
3.25 billion hours of video
watched each month
#3 most visited site
1 billion mobile video views
per day
1.3 billion users
#1 largest global media
company
3
TECHNOLOGY TRANSFORMATION FROM VERTICAL…
We Sell
Books
We Do
Search
We Sell
Software
We Rent
DVDs
We Do
Wireless
We Build
Computers
Yesterday
We Sell
Computers
4
TECHNOLOGY TRANSFORMATION FROM VERTICAL TO HORIZONTAL
We Sell
Books
We Do
Search
We Sell
Software
We Rent
DVDs
We Do
Wireless
We Build
Computers
We Sell
Everything
We Organize
Everything
We Build AI
We Build Platforms
For Everything
We Create
Entertainment
We’re A Network
Platform
Yesterday Today
We Sell
Computers
We Sell A
Lifestyle
5
Potential
Size
TheDisruptors
Source: PitchBook and CapitalIQ as of 6/20/17.
1) Bccresearch.
2) Investopedia.
3) PWC, US healthcare market size.
4) Plunkett Research.
5) Statista, Above The Crowd, July 2014.
6) 247wallstreet.
($30B)
($1.7B)
($12.3B)
($8.5B)
($1.7B)
(NA)
$13T(2)
($2.3B)
($60B)
($700M)
($3.5B)
($4.3B)
(NA)
($5.1B)
($91B)
$7T
($68B)
($50B)
($5.5B)
($3.5B)
($61B)
$0.3T(1)
($20.4B)
($25B-$50B)
(NA)
(6)
($474B)
($3.1B)
($38B)
$6T(4)
($1.2B)
($4B)
$3T(3)
($860M)
($343M)
($820M)
($361M)
(NA)
…THEREBY COMPLETELY DISRUPTING THE WORLD…
Finance Healthcare Retail Urban TransportComms. Media / Travel / Ent.
$3T(5)
($440B)
($350B)
($337B)
($90B)(6)
($62B)
($67B)
TheDisrupted
($39B)
($22B)
($8B)
($2.8B)
(NA)
(NA)
(NA)
(NA)
($56B)
($10.2B)
($4B)
($8.9B)
($238B)
(NA)
($729M)
($7.7B)
($228B)
($1.4B)
($177B)
($50.2B)
(NA)
($30.7B)
(NA)
6
…AND HAVE BEEN REWARDED BY PRIVATE INVESTORS…
Forward Revenue Multiples At Latest Round Of Private Financing
Estimated LTM Revenue At Financing
NTM Revenue Growth At Financing
Post-Money Valuation
Latest Financing Date
$1.7 Billion
64%
$30 Billion
Sept. 2016
$3 Billion
150%
$50 Billion
Apr. 2017
$500 Million
191%
$17 Billion
Oct. 2016
$3.9 Billion
106%
$68 Billion
Aug. 2016
11.1x 11.0x 10.8x
8.6x
Source: PitchBook.
Note: Financial estimates based on PitchBook, public sources and Jefferies estimates.
7
…AS WELL AS BY PUBLIC INVESTORS…
Top 10 S&P Companies By Market Capitalization
Tech companies
2008 2016
Exxon Mobil Corp Apple Inc.
Wall-Mart Stores Alphabet Inc.
Procter & Gamble Microsoft Corp.
Microsoft Corp. Amazon.com Inc.
General Electric Facebook Inc.
AT&T Inc. Exxon Mobil Corp.
Johnson & Johnson Johnson & Johnson
Chevron Corp. General Electric
Berkshire Hathaway JPMorgan Chase & Co
Wells Fargo AT&T Inc.
Data Is The New Oil
8
Market Cap ($m)Cars Sold In 2016
“We are in the
midst of seeing
more change in
the next five
years than we’ve
seen in the last
50 years”
– Mary Barra
CEO GM
Source: Theverge.com, Money.cnn.com, Capital IQ as of 6/20/17.
76,230
…FOR SIGNIFICANT TRANSFORMATIONAL GROWTH THAT IS YET TO COME…
10,000,000
$61,144
$51,967
9
…AND ARE PAYING ACQUISITION PREMIUMS DRIVEN BY A COMBINATION OF GREED AND FEAR
Industry
Purchase
Price
Acquirer
$1 B $1 B $1 B
$2 T+
Auto
$300 B+
Personal Care
$13.7 B
$5 T+
Retail
$3.3 B
$2 T+
Retail
eCommerce
$3.4 B
$2 T+
Retail
eCommerce
$2 T+
Auto
10
NON-TECHNOLOGY BUYERS HAVE BEEN IN TWO MINDS…
11
…BUT HAVE FINALLY PICKED UP COURAGE
By Industry
Non-
Tech
51%
Tech
49%
Tech / Non-Tech Buyers
Non-Tech: 51%
12
31% 31%
27% 27% 26%
25% 24%
23%
18%
13%
3%
JEFF / CS DB BAML MS Citi GS JPM Qatalyst UBS Barclays CS
108 28 70 99 31 99 84 36 25 39
1-Day Premium
# of Transactions
Industry Median
4
Source: Dealogic – Dataset includes public U.S. Technology M&A transactions since January 1, 1999 with target company TEV’s >$100 million.
1999 – 2016 Median Technology M&A Public Sell-Side Premiums
JEFFERIES HAS CONSISTENTLY DELIVERED BEST OUTCOME
13
JEFFERIES TECHNOLOGY GROUP
OUTCOME ADVISORS
14
Important Disclosure
This document is being furnished for informational purposes only and does not constitute an offer to sell or the solicitation of an offer to purchase
any security, future or other financial instrument or product. It is not intended to form the basis of an investment decision and has not been
verified. Jefferies International Limited (“Jefferies”) makes no recommendation or representation as to, and accepts no responsibility or liability
for, the accuracy or completeness of the information contained herein or any other information, whether written or oral, made available and any
liability therefore is expressly disclaimed. Such information is presented as of the date and, if applicable, time indicated and Jefferies does not
accept any responsibility for updating any such information.
Any simulations, projections, valuations and statistical analyses contained herein have been provided to assist the recipient in the evaluation of the
matters described herein; such simulations, projections, valuations and analyses may be based on subjective assessments and assumptions and
may utilise one among alternative methodologies that produce differing results; accordingly, such simulations, projections, valuations and
statistical analyses are not to be viewed as facts and should not be relied upon as an accurate representation of future events. No representation or
warranty is given as to any of the simulations or analyses, or as to the achievement or reasonableness of any future projections or estimates,
contained in this document.
Jefferies and its affiliates, officers, directors, employees and agents may from time to time hold long or short positions in, buy or sell (on a
principal basis or otherwise), or act as market maker in any securities, futures or other financial instruments or products related to matters
discussed herein and may make trading decisions that are different from or contrary to any of those which may be discussed. Jefferies is not an
adviser as to legal, taxation, accounting or regulatory matters in any jurisdiction, and is not providing any advice as to any such matter to the
recipient. Recipients of this document should take their own independent advice with respect to such matters.
In the UK, this document is intended for use only by persons who have professional experience in matters relating to investments falling within
Articles 19(5) and 49(2)(a) to (d) of the Financial Services and Markets Act 2000 (Financial Promotion) Order 2005 (as amended), or by persons
to whom it can be otherwise lawfully distributed. Recipients of this document in jurisdictions outside the United Kingdom should inform
themselves about and observe any applicable legal requirements in relation to the receipt of this document.
Jefferies International Limited is authorised and regulated in the United Kingdom by the Financial Conduct Authority. Its registered office is at
Vintners Place, 68 Upper Thames Street, London EC4V 3BJ; telephone +44 20 7029 8000; facsimile +44 20 7029 8010.
15
Selected Completed NOAH Transactions
Focus on Leading European Internet companies
Covering over 400 companies across 25 online
verticals, a broad range of over 500 investors as
well as 100+ online-focused corporates
Deep understanding of industry dynamics
Ability to add value beyond banking advice
Facilitates overall process and minimizes
management distraction
NOAH Advisors is globally well connected
and has direct access to virtually all key
players in the industry
Knowledge of and strong relationships with
potential buyers’ key decision makers
Proactively finds and unlocks attractive
investment opportunities for leading investors
Annual NOAH Conference in its 8th year
Over 40 years of combined relevant M&A experience
Routine execution of M&A and financing transactions
with sizes of several billion euros
30 successfully completed NOAH Advisors transactions
underline successful transfer of M&A competencies to
the Internet sector
Entrepreneurial mind-set, focused on growing the
business and establishing a reputation for excellence
Ability to deliver top results in short time frames
Highly success-based compensation structures align
interests of clients and NOAH Advisors, and demonstrate
conviction to deliver top results
Creative deal solutions
December 2014
September 2014
October 2014
May 2014
Sale of 100% of
for $800m to
Exclusive Financial Advisor to
Fotolia and the Selling Shareholders
Sale of 100% of
for €80m to
Exclusive Financial Advisor to
Trovit and its Shareholders
Sale of controlling stake in
to
Exclusive Financial Advisor to
Facile.it and its Shareholders
sold 100% of
for $228m to a joint venture between
Exclusive Financial Advisor to Yad2
and its Shareholders
Unique Industry Know-How
Unmatched Network and Relationships
Strong Investment Banking Competence
Full Commitment - We Are Entrepreneurs!
EUROPE’S LEADING INTERNET
CORPORATE FINANCE BOUTIQUE
September 2016
October 2016December 2016
May 2016
Investment in
by
Financial Advisor to Oakley Capital Exclusive Financial Advisor to
10Bis and its Shareholders
®
Marco Rodzynek
Managing Director & Founder
marco.rodzynek@noah-advisors.com
Jan Brandes
Managing Director
jan.brandes@noah-advisors.com
Justus Lumpe
Managing Director
justus.lumpe@noah-advisors.com
The NOAH Advisors Core Banking Team
Nikhil Parmar
Director
nikhil.parmar@noah-advisors.com
10Bis
Acquisition of a Majority Stake in
by
from
at a valuation of €300m
Investment in
Exclusive Financial Advisor to KäuferPortal
and its Shareholders
by
84% Ownership
Financial Advisor to Silver Lake
Investment in
by

Jefferies - NOAH17 Berlin

  • 1.
    …unveiling aggressive newtechnology acquirers Storm Duncan / Joint Global Head Of Technology M&A Quit trying to buy me, I’m busy disrupting you…
  • 2.
    GET YOUR TICKETTODAY! www.noah-conference.com 6-7 Old Billingsgate, London Tempodrom, Berlin JUN20182-3 NOV2017 SAVE THE DATE
  • 3.
    HOW DO YOUSAVE $20 MILLION? $665m $645m $20m $65bn Ask Bid Saving Current Valuation 1
  • 4.
    TWICE IN ALIFETIME $650m $1,000m $1,650m First Bid Valuation Gap Last Bid 2
  • 5.
    FOOL ME ONCE,FOOL ME TWICE Acquisition Price: $1.65 billion Now: #2 largest search engine 3.25 billion hours of video watched each month #3 most visited site 1 billion mobile video views per day 1.3 billion users #1 largest global media company 3
  • 6.
    TECHNOLOGY TRANSFORMATION FROMVERTICAL… We Sell Books We Do Search We Sell Software We Rent DVDs We Do Wireless We Build Computers Yesterday We Sell Computers 4
  • 7.
    TECHNOLOGY TRANSFORMATION FROMVERTICAL TO HORIZONTAL We Sell Books We Do Search We Sell Software We Rent DVDs We Do Wireless We Build Computers We Sell Everything We Organize Everything We Build AI We Build Platforms For Everything We Create Entertainment We’re A Network Platform Yesterday Today We Sell Computers We Sell A Lifestyle 5
  • 8.
    Potential Size TheDisruptors Source: PitchBook andCapitalIQ as of 6/20/17. 1) Bccresearch. 2) Investopedia. 3) PWC, US healthcare market size. 4) Plunkett Research. 5) Statista, Above The Crowd, July 2014. 6) 247wallstreet. ($30B) ($1.7B) ($12.3B) ($8.5B) ($1.7B) (NA) $13T(2) ($2.3B) ($60B) ($700M) ($3.5B) ($4.3B) (NA) ($5.1B) ($91B) $7T ($68B) ($50B) ($5.5B) ($3.5B) ($61B) $0.3T(1) ($20.4B) ($25B-$50B) (NA) (6) ($474B) ($3.1B) ($38B) $6T(4) ($1.2B) ($4B) $3T(3) ($860M) ($343M) ($820M) ($361M) (NA) …THEREBY COMPLETELY DISRUPTING THE WORLD… Finance Healthcare Retail Urban TransportComms. Media / Travel / Ent. $3T(5) ($440B) ($350B) ($337B) ($90B)(6) ($62B) ($67B) TheDisrupted ($39B) ($22B) ($8B) ($2.8B) (NA) (NA) (NA) (NA) ($56B) ($10.2B) ($4B) ($8.9B) ($238B) (NA) ($729M) ($7.7B) ($228B) ($1.4B) ($177B) ($50.2B) (NA) ($30.7B) (NA) 6
  • 9.
    …AND HAVE BEENREWARDED BY PRIVATE INVESTORS… Forward Revenue Multiples At Latest Round Of Private Financing Estimated LTM Revenue At Financing NTM Revenue Growth At Financing Post-Money Valuation Latest Financing Date $1.7 Billion 64% $30 Billion Sept. 2016 $3 Billion 150% $50 Billion Apr. 2017 $500 Million 191% $17 Billion Oct. 2016 $3.9 Billion 106% $68 Billion Aug. 2016 11.1x 11.0x 10.8x 8.6x Source: PitchBook. Note: Financial estimates based on PitchBook, public sources and Jefferies estimates. 7
  • 10.
    …AS WELL ASBY PUBLIC INVESTORS… Top 10 S&P Companies By Market Capitalization Tech companies 2008 2016 Exxon Mobil Corp Apple Inc. Wall-Mart Stores Alphabet Inc. Procter & Gamble Microsoft Corp. Microsoft Corp. Amazon.com Inc. General Electric Facebook Inc. AT&T Inc. Exxon Mobil Corp. Johnson & Johnson Johnson & Johnson Chevron Corp. General Electric Berkshire Hathaway JPMorgan Chase & Co Wells Fargo AT&T Inc. Data Is The New Oil 8
  • 11.
    Market Cap ($m)CarsSold In 2016 “We are in the midst of seeing more change in the next five years than we’ve seen in the last 50 years” – Mary Barra CEO GM Source: Theverge.com, Money.cnn.com, Capital IQ as of 6/20/17. 76,230 …FOR SIGNIFICANT TRANSFORMATIONAL GROWTH THAT IS YET TO COME… 10,000,000 $61,144 $51,967 9
  • 12.
    …AND ARE PAYINGACQUISITION PREMIUMS DRIVEN BY A COMBINATION OF GREED AND FEAR Industry Purchase Price Acquirer $1 B $1 B $1 B $2 T+ Auto $300 B+ Personal Care $13.7 B $5 T+ Retail $3.3 B $2 T+ Retail eCommerce $3.4 B $2 T+ Retail eCommerce $2 T+ Auto 10
  • 13.
    NON-TECHNOLOGY BUYERS HAVEBEEN IN TWO MINDS… 11
  • 14.
    …BUT HAVE FINALLYPICKED UP COURAGE By Industry Non- Tech 51% Tech 49% Tech / Non-Tech Buyers Non-Tech: 51% 12
  • 15.
    31% 31% 27% 27%26% 25% 24% 23% 18% 13% 3% JEFF / CS DB BAML MS Citi GS JPM Qatalyst UBS Barclays CS 108 28 70 99 31 99 84 36 25 39 1-Day Premium # of Transactions Industry Median 4 Source: Dealogic – Dataset includes public U.S. Technology M&A transactions since January 1, 1999 with target company TEV’s >$100 million. 1999 – 2016 Median Technology M&A Public Sell-Side Premiums JEFFERIES HAS CONSISTENTLY DELIVERED BEST OUTCOME 13
  • 16.
  • 17.
    Important Disclosure This documentis being furnished for informational purposes only and does not constitute an offer to sell or the solicitation of an offer to purchase any security, future or other financial instrument or product. It is not intended to form the basis of an investment decision and has not been verified. Jefferies International Limited (“Jefferies”) makes no recommendation or representation as to, and accepts no responsibility or liability for, the accuracy or completeness of the information contained herein or any other information, whether written or oral, made available and any liability therefore is expressly disclaimed. Such information is presented as of the date and, if applicable, time indicated and Jefferies does not accept any responsibility for updating any such information. Any simulations, projections, valuations and statistical analyses contained herein have been provided to assist the recipient in the evaluation of the matters described herein; such simulations, projections, valuations and analyses may be based on subjective assessments and assumptions and may utilise one among alternative methodologies that produce differing results; accordingly, such simulations, projections, valuations and statistical analyses are not to be viewed as facts and should not be relied upon as an accurate representation of future events. No representation or warranty is given as to any of the simulations or analyses, or as to the achievement or reasonableness of any future projections or estimates, contained in this document. Jefferies and its affiliates, officers, directors, employees and agents may from time to time hold long or short positions in, buy or sell (on a principal basis or otherwise), or act as market maker in any securities, futures or other financial instruments or products related to matters discussed herein and may make trading decisions that are different from or contrary to any of those which may be discussed. Jefferies is not an adviser as to legal, taxation, accounting or regulatory matters in any jurisdiction, and is not providing any advice as to any such matter to the recipient. Recipients of this document should take their own independent advice with respect to such matters. In the UK, this document is intended for use only by persons who have professional experience in matters relating to investments falling within Articles 19(5) and 49(2)(a) to (d) of the Financial Services and Markets Act 2000 (Financial Promotion) Order 2005 (as amended), or by persons to whom it can be otherwise lawfully distributed. Recipients of this document in jurisdictions outside the United Kingdom should inform themselves about and observe any applicable legal requirements in relation to the receipt of this document. Jefferies International Limited is authorised and regulated in the United Kingdom by the Financial Conduct Authority. Its registered office is at Vintners Place, 68 Upper Thames Street, London EC4V 3BJ; telephone +44 20 7029 8000; facsimile +44 20 7029 8010. 15
  • 18.
    Selected Completed NOAHTransactions Focus on Leading European Internet companies Covering over 400 companies across 25 online verticals, a broad range of over 500 investors as well as 100+ online-focused corporates Deep understanding of industry dynamics Ability to add value beyond banking advice Facilitates overall process and minimizes management distraction NOAH Advisors is globally well connected and has direct access to virtually all key players in the industry Knowledge of and strong relationships with potential buyers’ key decision makers Proactively finds and unlocks attractive investment opportunities for leading investors Annual NOAH Conference in its 8th year Over 40 years of combined relevant M&A experience Routine execution of M&A and financing transactions with sizes of several billion euros 30 successfully completed NOAH Advisors transactions underline successful transfer of M&A competencies to the Internet sector Entrepreneurial mind-set, focused on growing the business and establishing a reputation for excellence Ability to deliver top results in short time frames Highly success-based compensation structures align interests of clients and NOAH Advisors, and demonstrate conviction to deliver top results Creative deal solutions December 2014 September 2014 October 2014 May 2014 Sale of 100% of for $800m to Exclusive Financial Advisor to Fotolia and the Selling Shareholders Sale of 100% of for €80m to Exclusive Financial Advisor to Trovit and its Shareholders Sale of controlling stake in to Exclusive Financial Advisor to Facile.it and its Shareholders sold 100% of for $228m to a joint venture between Exclusive Financial Advisor to Yad2 and its Shareholders Unique Industry Know-How Unmatched Network and Relationships Strong Investment Banking Competence Full Commitment - We Are Entrepreneurs! EUROPE’S LEADING INTERNET CORPORATE FINANCE BOUTIQUE September 2016 October 2016December 2016 May 2016 Investment in by Financial Advisor to Oakley Capital Exclusive Financial Advisor to 10Bis and its Shareholders ® Marco Rodzynek Managing Director & Founder marco.rodzynek@noah-advisors.com Jan Brandes Managing Director jan.brandes@noah-advisors.com Justus Lumpe Managing Director justus.lumpe@noah-advisors.com The NOAH Advisors Core Banking Team Nikhil Parmar Director nikhil.parmar@noah-advisors.com 10Bis Acquisition of a Majority Stake in by from at a valuation of €300m Investment in Exclusive Financial Advisor to KäuferPortal and its Shareholders by 84% Ownership Financial Advisor to Silver Lake Investment in by