Recommended
ODP
PDF
Javaコードが速く実⾏される秘密 - JITコンパイラ⼊⾨(JJUG CCC 2020 Fall講演資料)
PPTX
PDF
LogbackからLog4j 2への移行によるアプリケーションのスループット改善 ( JJUG CCC 2021 Fall )
PDF
PDF
PlaySQLAlchemy: SQLAlchemy入門
PDF
怖くないSpring Bootのオートコンフィグレーション
PDF
PDF
より速く より運用しやすく 進化し続けるJVM(Java Developers Summit Online 2023 発表資料)
PPTX
PDF
使ってみよう!JDK Flight Recorder
PDF
Javaトラブルに備えよう #jjug_ccc #ccc_h2
PPTX
PDF
PDF
PDF
Node.js Native ESM への道 〜最終章: Babel / TypeScript Modules との闘い〜
PDF
ツール比較しながら語る O/RマッパーとDBマイグレーションの実際のところ
PDF
YugabyteDBを使ってみよう - part2 -(NewSQL/分散SQLデータベースよろず勉強会 #2 発表資料)
PDF
PDF
Apache Airflow入門 (マーケティングデータ分析基盤技術勉強会)
PPTX
【修正版】Django + SQLAlchemy: シンプルWay
PDF
Garbage First Garbage Collection (G1 GC) #jjug_ccc #ccc_cd6
PDF
RDB技術者のためのNoSQLガイド NoSQLの必要性と位置づけ
PDF
PDF
Grafana LokiではじめるKubernetesロギングハンズオン(NTT Tech Conference #4 ハンズオン資料)
PDF
PPTX
NginxとLuaを用いた動的なリバースプロキシでデプロイを 100 倍速くした
PPTX
PDF
Concurrent Mark-Sweep Garbage Collection #jjug_ccc
PPTX
java.lang.OutOfMemoryError #渋谷java
More Related Content
ODP
PDF
Javaコードが速く実⾏される秘密 - JITコンパイラ⼊⾨(JJUG CCC 2020 Fall講演資料)
PPTX
PDF
LogbackからLog4j 2への移行によるアプリケーションのスループット改善 ( JJUG CCC 2021 Fall )
PDF
PDF
PlaySQLAlchemy: SQLAlchemy入門
PDF
怖くないSpring Bootのオートコンフィグレーション
PDF
What's hot
PDF
より速く より運用しやすく 進化し続けるJVM(Java Developers Summit Online 2023 発表資料)
PPTX
PDF
使ってみよう!JDK Flight Recorder
PDF
Javaトラブルに備えよう #jjug_ccc #ccc_h2
PPTX
PDF
PDF
PDF
Node.js Native ESM への道 〜最終章: Babel / TypeScript Modules との闘い〜
PDF
ツール比較しながら語る O/RマッパーとDBマイグレーションの実際のところ
PDF
YugabyteDBを使ってみよう - part2 -(NewSQL/分散SQLデータベースよろず勉強会 #2 発表資料)
PDF
PDF
Apache Airflow入門 (マーケティングデータ分析基盤技術勉強会)
PPTX
【修正版】Django + SQLAlchemy: シンプルWay
PDF
Garbage First Garbage Collection (G1 GC) #jjug_ccc #ccc_cd6
PDF
RDB技術者のためのNoSQLガイド NoSQLの必要性と位置づけ
PDF
PDF
Grafana LokiではじめるKubernetesロギングハンズオン(NTT Tech Conference #4 ハンズオン資料)
PDF
PPTX
NginxとLuaを用いた動的なリバースプロキシでデプロイを 100 倍速くした
PPTX
Viewers also liked
PDF
Concurrent Mark-Sweep Garbage Collection #jjug_ccc
PPTX
java.lang.OutOfMemoryError #渋谷java
PDF
PPTX
Garbage First Garbage Collector (G1 GC) - Migration to, Expectations and Adva...
PPTX
第七回 渋谷Java� - Apache Shiroを使ってみた
PPTX
Java トラブル解析支援ツール HeapStats のご紹介
PDF
PPTX
Similar to Java 9で進化する診断ツール
PDF
Javaはどのように動くのか~スライドでわかるJVMの仕組み
PPTX
オレ流のOpenJDKの開発環境(JJUG CCC 2019 Fall講演資料)
PPTX
Introduction to JIT Compiler in JVM
ODP
PDF
JJUGナイトセミナー OpenJDK祭り「OpenJ9+OpenJDK」
PDF
Oracle code one 2018 報告会概要
PDF
JavaOne 2016 Java SE Feedback #jjug #j1jp
PDF
HeapStats: Introduction and Technical Preview
PDF
Adaptive optimization of JIT compiler
PPTX
Jjug night seminar201208_lt_cxxからjvm起動
PDF
PDF
PDF
Java SE 8におけるHotSpotの進化 [Java Day Tokyo 2014 C-2]
KEY
関ジャバ JavaOne Tokyo 2012報告会
PDF
JavaOne 2015 JDK Update (Jigsaw) #j1jp
PDF
PDF
Debug Hacks at Security and Programming camp 2011
PDF
Programming camp 2010 debug hacks
PDF
OpenJDK HotSpot C1Compiler Overview
PPT
More from Yasumasa Suenaga
PPTX
PPTX
PDF
PPTX
Panamaを先取り!? JVMCIでJITと遊ぶ
PPTX
HeapStatsのデモ (Java The Night)
PPTX
PPTX
もしも… Javaでヘテロジニアスコアが使えたら…
Java 9で進化する診断ツール 1. 2. 3. 4. 5. 7. 8. 9. 10. コマンド 内容
VM.log ログ出力設定とローテーションの実行
VM.print_touched_methods 実行されたメソッドの一覧表示
VM.classloader_stats クラスローダに関する情報の表示
VM.stringtable StringTable(String#intern()した文字列や解決した
クラス名が入っているテーブル)の概要表示、ダンプ
VM.symboltable SymbolTable(メソッド名等)の概要表示、ダンプ
VM.class_hierarchy Javaヒープ中のクラス階層構造の表示
VM.info javaプロセスの詳細情報、およびマシン情報の表示
VM.dynlibs ロードされている共有ライブラリの出力
VM.set_flag フラグ(-XXオプション)の変更
VMドメイン
11. 12. 14. 15. 16. $ jcmd 1234 VM.log output="file=gc.log"
output_options="filecount=5,filesize=10m"
what="gc=debug"
decorators="time,level"
オプション名 内容
output 出力先
”#<数字>”を指定すると既存のoutputに対する変更を意味する
output_options 出力オプション
what タグやログレベルの設定
decorators ログデコレーションの設定
17. 18. $ jcmd 1234 VM.log list
1234:
Available log levels: off, trace, debug, info, warning, error
Available log decorators: time (t), uptime (u), timemillis (tm), uptimemillis (um), timenanos (tn), uptimenanos
(un), hostname (hn), pid (p), tid (ti), level (l), tags (tg)
Available log tags: add, age, alloc, arguments, annotation, barrier, biasedlocking, bot, breakpoint, census,
class, classhisto, cleanup, compaction, constraints, constantpool, coops, cpu, cset, data, defaultmethods, dump,
ergo, exceptions, exit, freelist, gc, heap, humongous, ihop, iklass, init, itables, jni, jvmti, liveness, load,
loader, logging, mark, marking, methodcomparator, metadata, metaspace, mmu, modules, monitorinflation,
monitormismatch, nmethod, normalize, objecttagging, obsolete, oopmap, os, pagesize, path, phases, plab, promotion,
preorder, protectiondomain, ref, redefine, refine, region, remset, purge, resolve, safepoint, scavenge, scrub,
stacktrace, start, startuptime, state, stats, stringdedup, stringtable, stackmap, subclass, survivor, sweep, task,
thread, tlab, time, timer, update, unload, verification, verify, vmoperation, vtables, workgang
Described tag combinations:
logging: Logging for the log framework itself
Log output configuration:
#0: stdout all=warning uptime,level,tags
#1: stderr all=off uptime,level,tags
#2: gc.log gc=debug filecount=5,filesize=20M level,tags
JDK-8153074
UL: Show output option in VM.log jcmd
19. 20. 21. $ jcmd 1234 VM.info
1234:
#
# JRE version: Java(TM) SE Runtime Environment (9.0+119) (build 9-ea+119)
# Java VM: Java HotSpot(TM) 64-Bit Server VM (9-ea+119, mixed mode, tiered, compressed oops, g1 gc, linux-amd64)
--------------- S U M M A R Y ------------
Command Line: LongSleep
Host: Intel(R) Core(TM) i3-2367M CPU @ 1.40GHz, 2 cores, 1G, Fedora release 23 (Twenty Three)
Time: Mon May 23 20:32:22 2016 JST elapsed time: 16 seconds (0d 0h 0m 16s)
--------------- P R O C E S S ---------------
Heap address: 0x00000000e0e00000, size: 498 MB, Compressed Oops mode: 32-bit
Narrow klass base: 0x0000000000000000, Narrow klass shift: 3
Compressed class space size: 1073741824 Address: 0x0000000100000000
:
22. 23. •
•
$ jcmd 1234 VM.flags -all | grep -E 'manageable|product_rw'
intx CMSAbortablePrecleanWaitMillis = 100 {manageable}
intx CMSTriggerInterval = -1 {manageable}
intx CMSWaitDuration = 2000 {manageable}
bool HeapDumpAfterFullGC = false {manageable}
bool HeapDumpBeforeFullGC = false {manageable}
bool HeapDumpOnOutOfMemoryError = false {manageable}
ccstr HeapDumpPath = {manageable}
uintx MaxHeapFreeRatio = 70 {manageable}
uintx MinHeapFreeRatio = 40 {manageable}
bool PrintClassHistogram = false {manageable}
bool PrintConcurrentLocks = false {manageable}
24. •
$ jcmd 1234 VM.set_flag HeapDumpOnOutOfMemoryError true
1234:
Command executed successfully
$ jcmd 1234 VM.flags
1234:
-XX:CICompilerCount=2 -XX:ConcGCThreads=1 -XX:G1HeapRegionSize=1048576
-XX:+HeapDumpOnOutOfMemoryError -XX:InitialHeapSize=33554432 -XX:MarkStackSize=4194304
-XX:MaxHeapSize=522190848 -XX:MaxNewSize=312475648 -XX:MinHeapDeltaBytes=1048576
-XX:NonNMethodCodeHeapSize=5824844 -XX:NonProfiledCodeHeapSize=122916698
-XX:ProfiledCodeHeapSize=122916698 -XX:ReservedCodeCacheSize=251658240
-XX:+SegmentedCodeCache -XX:+UseCompressedClassPointers -XX:+UseCompressedOops -XX:+UseG1GC
JDK-8155936
Boolean value should be set 1/0 or true/false via
VM.set_flag jcmd
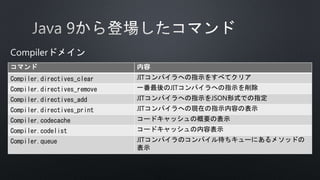
25. 26. 27. 28. $ jcmd 1234 Compiler.directives_add compiler-directive.json
1234:
1 compiler directives added
29. •
$ jcmd 1234 Compiler.directives_print
1234:
Directive:
matching: *String.hashCode
c1 directives:
inline: -
Enable:false Exclude:false BreakAtExecute:false BreakAtCompile:false Log:false PrintAssembly:false PrintInlining:false PrintNMethods:false
BackgroundCompilation:true ReplayInline:false DumpReplay:false DumpInline:false CompilerDirectivesIgnoreCompileCommands:false DisableIntrinsic:
BlockLayoutByFrequency:true PrintOptoAssembly:false PrintIntrinsics:false TraceOptoPipelining:false TraceOptoOutput:false TraceSpilling:false
Vectorize:false VectorizeDebug:false CloneMapDebug:false DoReserveCopyInSuperWordDebug:false IGVPrintLevel:0 MaxNodeLimit:80000
c2 directives:
inline: -
Enable:true Exclude:true BreakAtExecute:false BreakAtCompile:false Log:false PrintAssembly:false PrintInlining:false PrintNMethods:false
BackgroundCompilation:true ReplayInline:false DumpReplay:false DumpInline:false CompilerDirectivesIgnoreCompileCommands:false DisableIntrinsic:
BlockLayoutByFrequency:true PrintOptoAssembly:false PrintIntrinsics:false TraceOptoPipelining:false TraceOptoOutput:false TraceSpilling:false
Vectorize:false VectorizeDebug:false CloneMapDebug:false DoReserveCopyInSuperWordDebug:false IGVPrintLevel:0 MaxNodeLimit:80000
Enable :ディレクティブの明示的設定
Exclude :JIT除外設定
30. 31. •
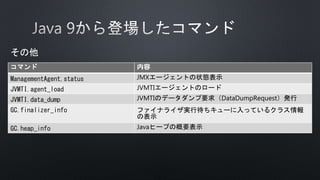
$ jcmd 1234 Compiler.codelist
1234:
53 4 java.lang.String.hashCode()I [0x00007fd2cd776090, 0x00007fd2cd776200 - 0x00007fd2cd776398]
コンパイル
ID
コンパイルレベル
(Tiered Compilation)
メソッド名
nmethod
開始アドレス
コード
開始アドレス
コード
終了アドレス
32. 33. 34. 35. 36. 37. 38. 39. 40. •
•
•
•
•
$ jcmd 1234 GC.heap_info
1234:
garbage-first heap total 32768K, used 1024K [0x00000000e0e00000, 0x00000000e0f00100, 0x0000000100000000)
region size 1024K, 2 young (2048K), 0 survivors (0K)
Metaspace used 3332K, capacity 4486K, committed 4864K, reserved 1056768K
class space used 328K, capacity 386K, committed 512K, reserved 1048576K
42. 43. 44. •
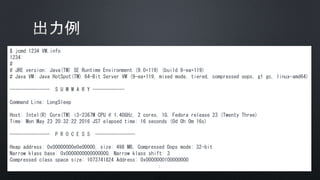
"Attach Listener" #12 daemon prio=9 os_prio=0 tid=0x00007f3224001000 nid=0xb8f7 waiting on condition [0x0000000000000000]
java.lang.Thread.State: RUNNABLE
45. 46. 48. 49. • S A
•
• Java 9からは各種ツールでSAが使えなくなりました!
•
• OpenJDKのdebuginfoパッケージ必須
•
•
•
50. 51. 52. 53. 54. 55. •
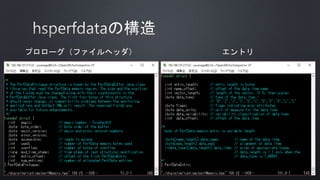
(gdb) x/g ((G1CollectedHeap *)Universe::_collectedHeap)->_g1mm->_full_collection_counters->_time ->_valuep
0x7f8c6884b960: 15535194
例:Full GCの累計実行時間を出してみる(jstatのFGCT相当)
15535194÷1000000000≒0.015 (sec)
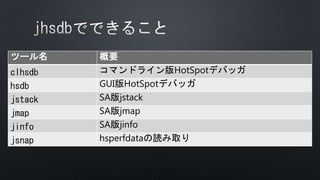
56. 57. •
$ $JAVA_HOME/bin/jhsdb jsnap --exe $JAVA_HOME/bin/java --core core.6937 --all |
grep -a -e sun.gc.collector.1.time -e sun.os.hrt.frequency
sun.gc.collector.1.time=15535194 tick(s)
sun.os.hrt.frequency=1000000000 Hz
15535194÷1000000000≒0.015 (sec)
この実現のためにJDK-8151815ガンバってます!
58. 60. 61. 62. 63. 64. 65. 66. 67. 68. 69. Fedora23 x64の場合
$ dnf download --source binutils
$ rpm -ivh <binutils>
$ cd ~/rpmbuild/SPECS
$ rpmbuild -bp binutils.spec
$ cd <OpenJDK src>/hotspot/src/share/tools/hsdis
$ make BINUTILS=~/rpmbuild/BUILD/<binutils> ARCH=amd64
$ ls build/linux-amd64/hsdis-amd64.so
build/linux-amd64/hsdis-amd64.so
binutilsの
SRPM取得
SRPM展開
hsdisのビルド
hsdis本体
70. 72. 73.


![•
[
{
match: ["*String.hashCode"],
c2: {
Exclude: true
}
}
]](https://image.slidesharecdn.com/jdk9-160524140253/85/Java-9-27-320.jpg)


![•
$ jcmd 1234 Compiler.codelist
1234:
53 4 java.lang.String.hashCode()I [0x00007fd2cd776090, 0x00007fd2cd776200 - 0x00007fd2cd776398]
コンパイル
ID
コンパイルレベル
(Tiered Compilation)
メソッド名
nmethod
開始アドレス
コード
開始アドレス
コード
終了アドレス](https://image.slidesharecdn.com/jdk9-160524140253/85/Java-9-31-320.jpg)


![•
"Attach Listener" #12 daemon prio=9 os_prio=0 tid=0x00007f3224001000 nid=0xb8f7 waiting on condition [0x0000000000000000]
java.lang.Thread.State: RUNNABLE](https://image.slidesharecdn.com/jdk9-160524140253/85/Java-9-44-320.jpg)


![Java SE 8におけるHotSpotの進化 [Java Day Tokyo 2014 C-2]](https://cdn.slidesharecdn.com/ss_thumbnails/javadayc2-171122031842-thumbnail.jpg?width=640&height=640&fit=bounds)


