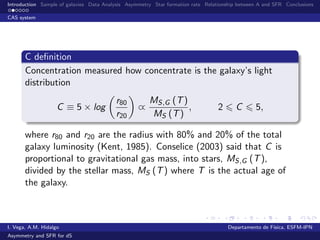
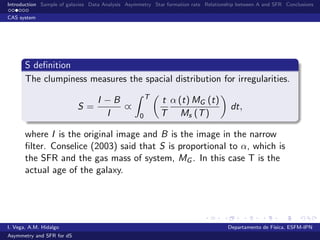
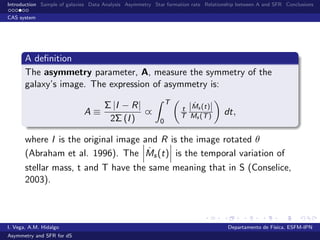
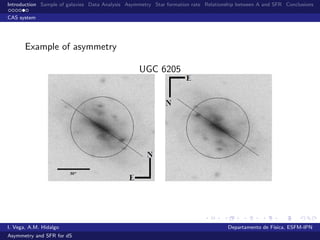
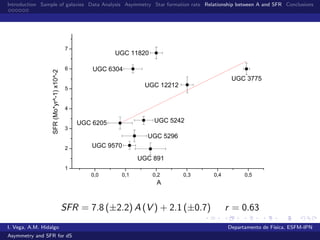
This document discusses the asymmetry and star formation rate of dwarf spiral galaxies. It analyzes the asymmetry parameter (A) and star formation rate (SFR) values of 9 dwarf spiral galaxies using CAS morphological parameters and H-alpha emission fluxes. A positive correlation was found between A and SFR, with SFR increasing linearly with A. The conclusions note some galaxies had unusual Sersic indices possibly related to bars, and that A and SFR were generally correlated for these dwarf spiral galaxies.
![Introduction Sample of galaxies Data Analysis Asymmetry Star formation rate Relationship between A and SFR Conclusions
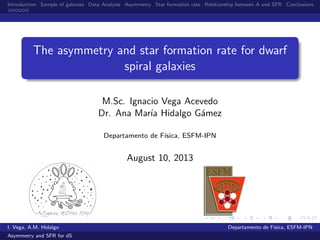
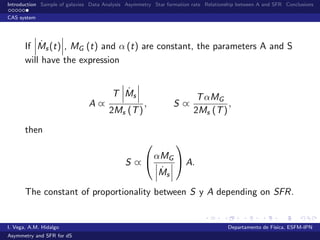
Our sample of galaxies dS
This sample of galaxies follows the definition of dwarf spiral galaxy
given by Hidalgo-G´amez (2004).
Galaxy
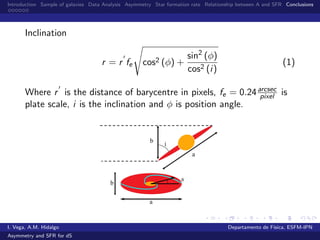
i
[degree]
r25
[kpc]
D
[Mpc]
MB
Av
[mag]
UGC891 63 3.13 9.4 ± 1 -15.32 0.076
UGC3775 27 4.68 20.8 ± 7.7 -15.08 0.305
UGC5242 50 4.86 24.76 ± ... -16.60 0.417
UGC5296 29 3.02 20.28 ± ... -15.08 0.031
UGC6205 41 4.99 18.87 ± ... -16.53 0.043
UGC6304 39 4.72 23.51 ± ... -15.40 0.029
UGC9570 14 ... 29.4 ± ... -15.89 0.029
UGC11820 24 4.96 17.1 ± 2.4 -14.70 0.332
UGC12212 56 3.3 14.7 ± 2.8 -15.11 0.170
Taken from: RC3; Hidalgo-G´amez, 2004; Fitzpatrick, 1999
I. Vega, A.M. Hidalgo Departamento de F´ısica, ESFM-IPN
Asymmetry and SFR for dS](https://image.slidesharecdn.com/4fb65fcf-a933-4c8c-8942-3e5bcd025410-161207230952/85/IVega_Acevedo-10-320.jpg)
![Introduction Sample of galaxies Data Analysis Asymmetry Star formation rate Relationship between A and SFR Conclusions
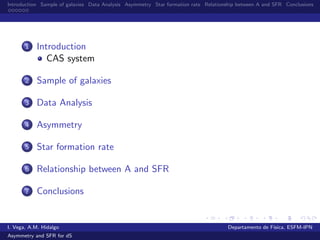
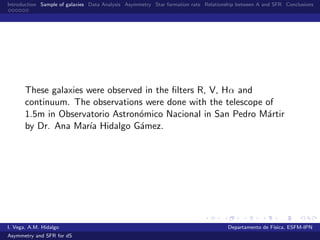
Galaxy
V filter R filter
n r0 [arcsec] rP [arcsec] n r0 [arcsec] rP [arcsec]
UGC 891 0.6 ± 0.4 13.0 ± 2.2 27.3 ± 4.6 0.7 ± 0.3 14.4 ± 2.3 30.2 ± 4.8
UGC 3775 0.5 ± 0.3 10.7 ± 2.5 22.5 ± 5.3 0.6 ± 0.3 11.0 ± 2.0 23.1 ± 4.2
UGC 11820 0.7 ± 0.3 10.6 ± 1.4 22.3 ± 2.9 0.9 ± 0.2 11.6 ± 1.4 24.4 ± 2.9
UGC 5296 2.0 ± 0.2 19.5 ± 2.5 41.0 ± 5.3 1.9 ± 0.2 22.3 ± 2.5 46.8 ± 5.3
UGC 6205 1.6 ± 0.3 20.9 ± 2.3 43.9 ± 4.8 1.7 ± 0.2 22.5 ± 2.6 47.3 ± 5.5
UGC 6304 1.5 ± 0.7 27.1 ± 2.4 56.9 ± 5.0 1.4 ± 0.6 1.4 ± 1.1 2.9 ± 2.3
UGC 9570 1.7 ± 0.2 26.0 ± 2.2 54.6 ± 4.6 1.7 ± 0.4 28.5 ± 2.2 59.9 ± 4.6
UGC 12212 1.5 ± 0.2 15.4 ± 2.1 32.3 ± 4.4 1.3 ± 0.1 16.3 ± 2.3 34.2 ± 4.8
UGC 5242 2.1 ± 0.4 14.8 ± 2.1 31.1 ± 4.4 2.1 ± 0.8 15.8 ± 1.9 33.2 ± 4.0
I. Vega, A.M. Hidalgo Departamento de F´ısica, ESFM-IPN
Asymmetry and SFR for dS](https://image.slidesharecdn.com/4fb65fcf-a933-4c8c-8942-3e5bcd025410-161207230952/85/IVega_Acevedo-13-320.jpg)
![Introduction Sample of galaxies Data Analysis Asymmetry Star formation rate Relationship between A and SFR Conclusions
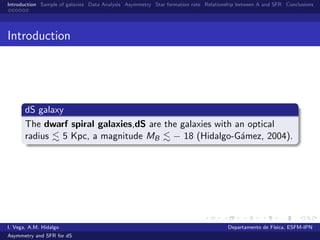
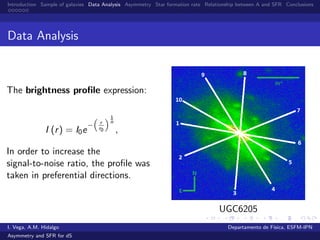
Galaxy
Flux SFR
[erg*cm−2]*10−13 [M yr−1]*10−2
UGC 891 21.9 ± 0.4 1.9 ± 0.3
UGC 3775 14.7 ± 0.2 6.0 ± 0.3
UGC 5242 5.9 ± 0.1 3.4 ± 0.2
UGC 5296 6.3 ± 0.3 2.6 ± 0.3
UGC 6205 9.3 ± 0.1 3.2 ± 0.3
UGC 6304 10.8 ± 0.4 6.0 ± 0.2
UGC 9570 2.6 ± 0.1 2.1 ± 0.2
UGC 11820 2.5 ± 0.5 6.8 ± 0.3
UGC 12212 34.0 ± 0.1 5.2 ± 0.4
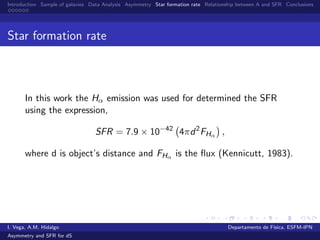
These values of SFR are of the same order as those obtained for
dwarf irregular galaxies (Zhang et al. 2011) and similar for
late-type (Hunter et al. 1998).
I. Vega, A.M. Hidalgo Departamento de F´ısica, ESFM-IPN
Asymmetry and SFR for dS](https://image.slidesharecdn.com/4fb65fcf-a933-4c8c-8942-3e5bcd025410-161207230952/85/IVega_Acevedo-16-320.jpg)
![Introduction Sample of galaxies Data Analysis Asymmetry Star formation rate Relationship between A and SFR Conclusions
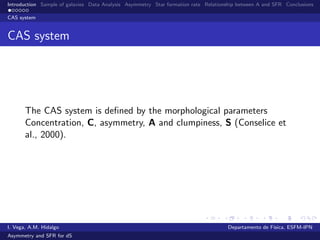
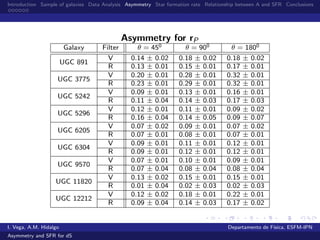
Barycentre [pixel]
Galaxy(1) Filter(2) Bx(3) By(4) Separation(5) [arcsec]
UGC891
V 414 357
0.96
R 417 360
UGC3775
V 249 647
0.96
R 245 644
UGC5242
V 501 463
1.68
R 505 458
UGC5296
V 432 53
0.72
R 433 529
UGC6205
V 479 381
0.72
R 479 378
UGC6304
V 601 376
0.72
R 601 366
UGC9570
V 737 754
0.48
R 739 755
UGC11820
V 668 451
0.96
R 665 465
UGC12212
V 540 473
1.2
R 540 479
I. Vega, A.M. Hidalgo Departamento de F´ısica, ESFM-IPN
Asymmetry and SFR for dS](https://image.slidesharecdn.com/4fb65fcf-a933-4c8c-8942-3e5bcd025410-161207230952/85/IVega_Acevedo-26-320.jpg)


![[PDF] Geneva2017 - Testing Strong Equivalence Principle with Pulsars](https://cdn.slidesharecdn.com/ss_thumbnails/2017-08-14-sepcern2017-171101223326-thumbnail.jpg?width=640&height=640&fit=bounds)


