Download to read offline
![International Research Journal of Engineering and Technology (IRJET) e-ISSN: 2395-0056
Volume: 08 Issue: 03 | Mar 2021 www.irjet.net p-ISSN: 2395-0072
© 2021, IRJET | Impact Factor value: 7.529 | ISO 9001:2008 Certified Journal | Page 87
Contradicting the Hypothesis of Data Analytics with the Help of a
Use-Case Related to Manufacturing Industry
Shweta .M. Devadiga
Department of Computer Science, Maharashtra, India.
---------------------------------------------------------------------***---------------------------------------------------------------------
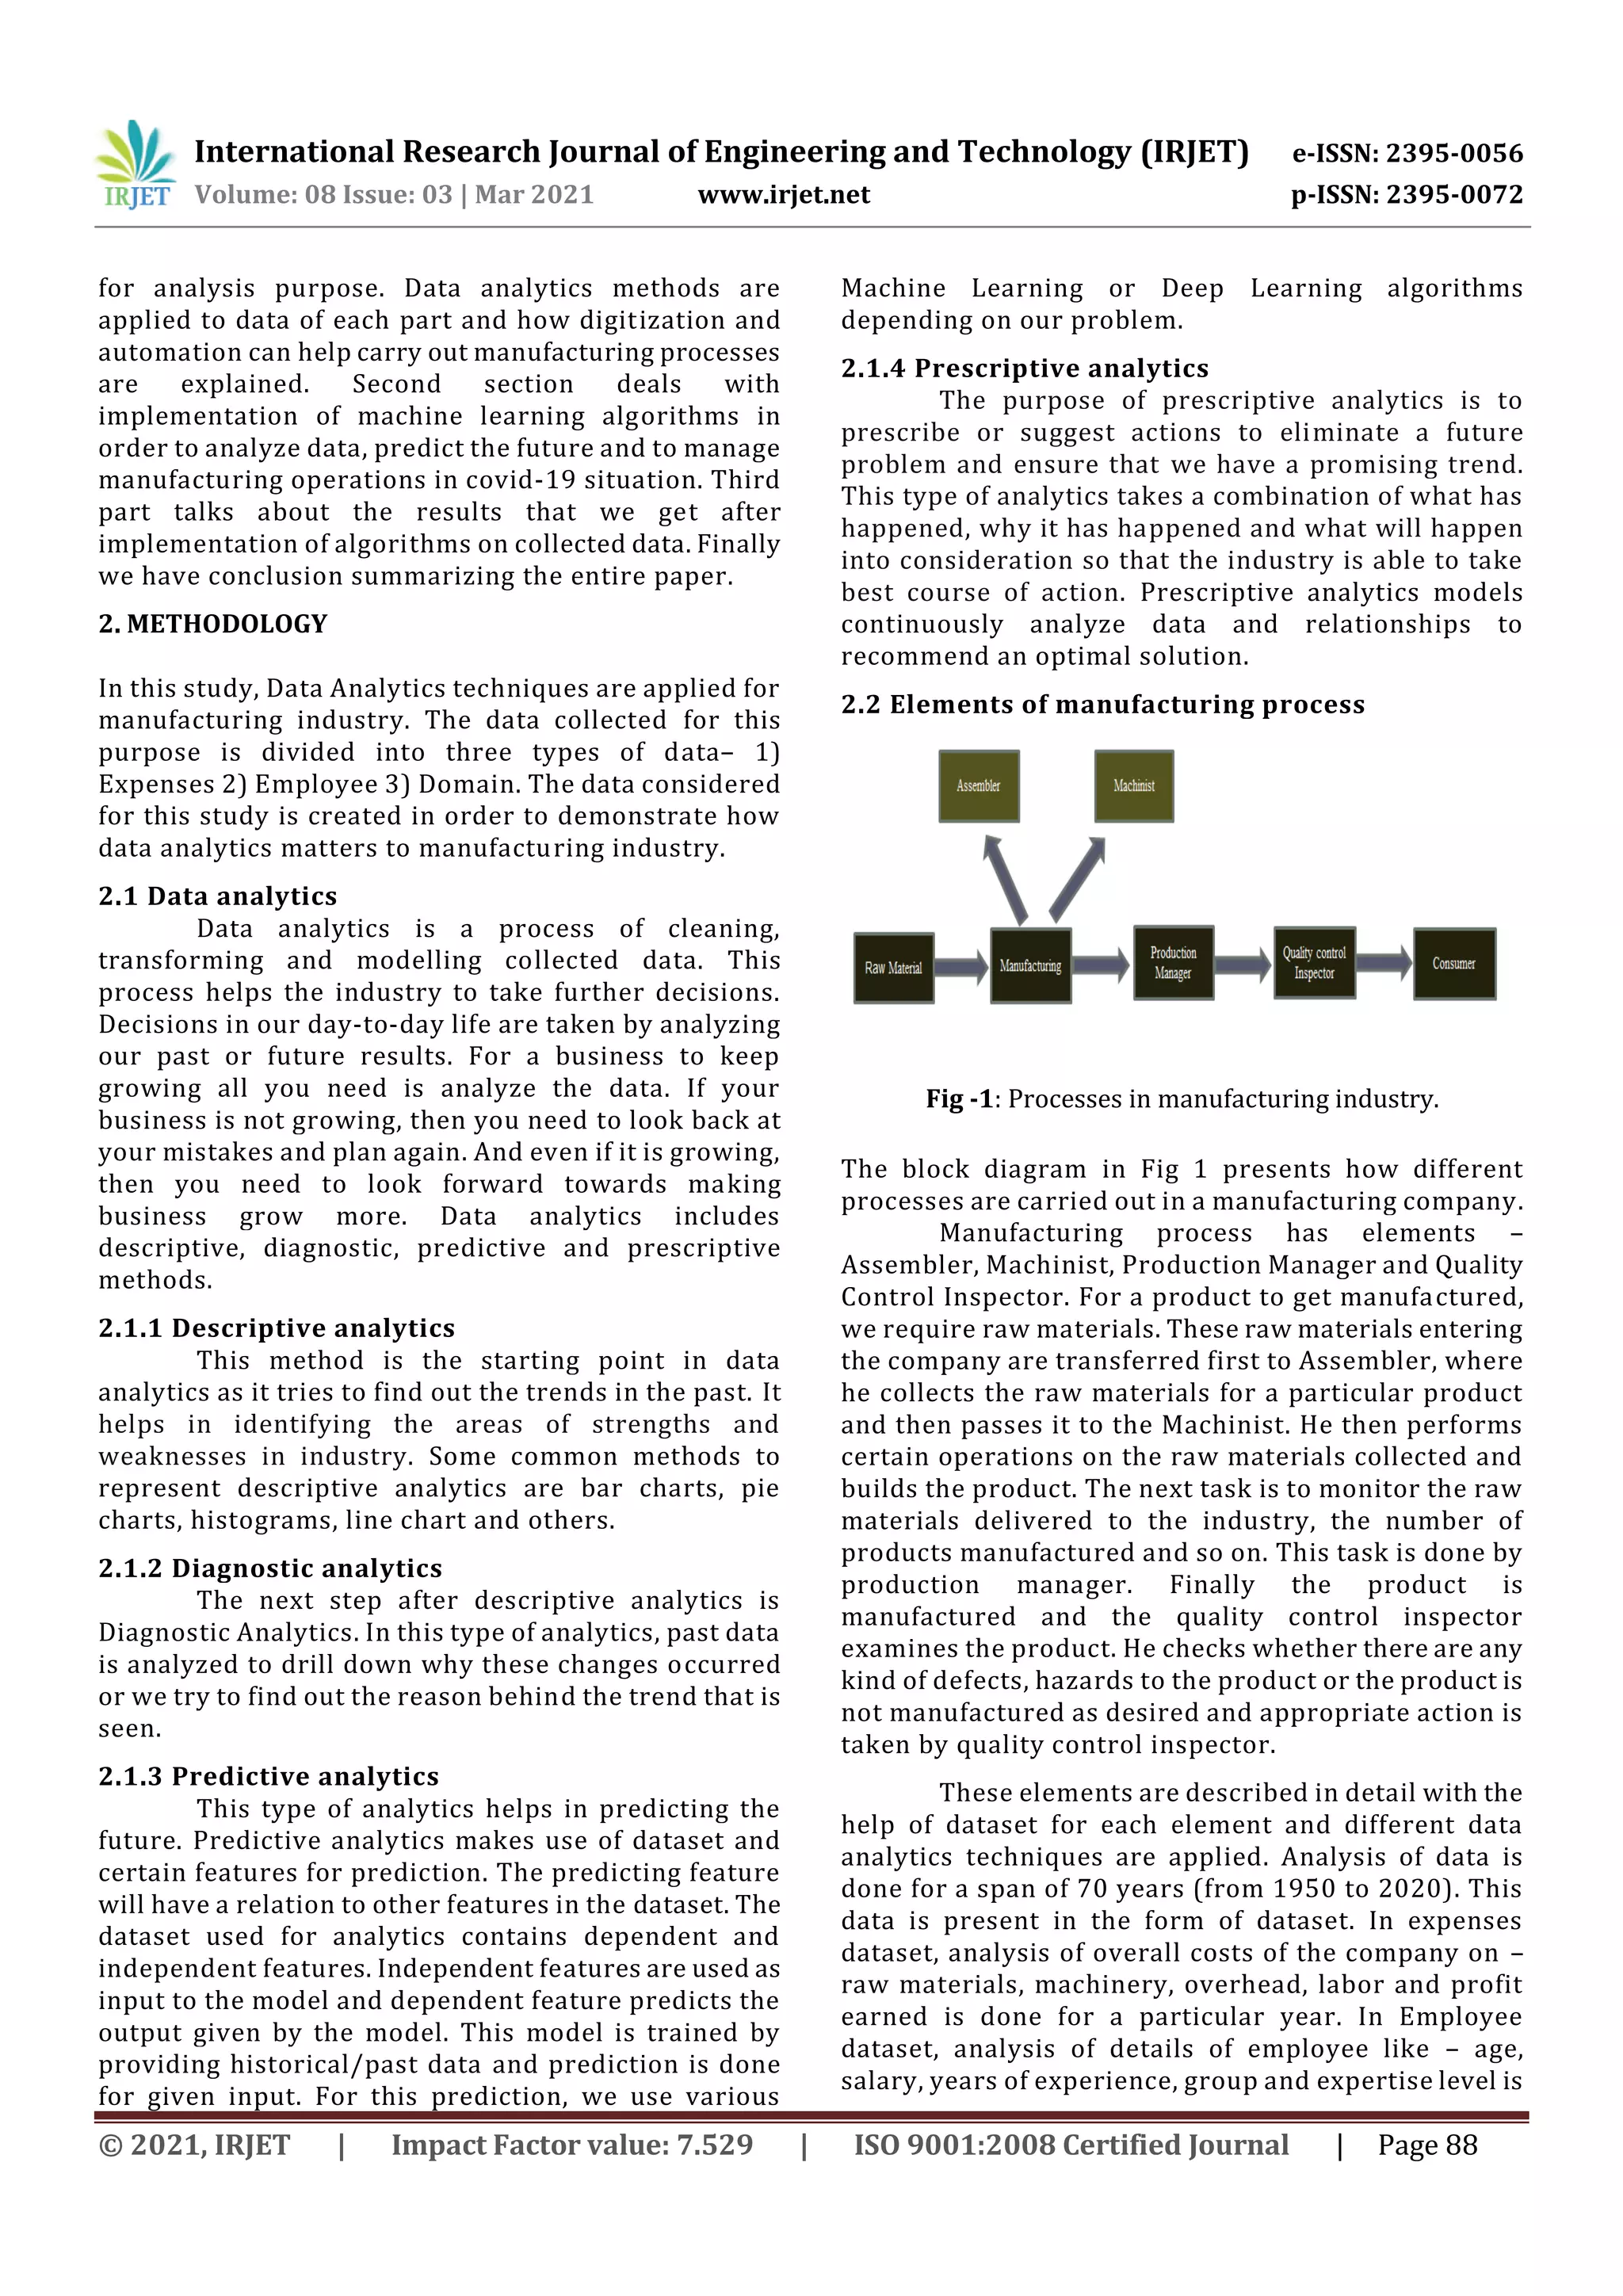
Abstract - Manufacturing industry is now heavily
relying on data analytics for its growth. Data analytics
helps in analyzing the present data which further helps
us in decision making. This research paper attempts to
bring out a flow of how data analytics techniques can
be used to find out trends in manufacturing industry
and forecast future demand. Additionally, Covid-19 has
pushed the industry towards online practices for most
of its operations. This requirement has created need for
automation and tracking at several levels. In the
current research paper, these needs are addressed as
well.
Key Words: Data Analytics, Descriptive analytics,
Diagnostic analytics, Predictive analytics, Prescriptive
analytics, Manufacturing.
1. INTRODUCTION
We are now in the era of fourth Industrial
Revolution which deals with industrial automation.
Industries like chemical, manufacturing, food and
beverage, textile are facing challenges in reducing
waste such as material waste, time resources and
reducing machine downtime. These industries are using
technologies like IOT, Digital Twin, 3D printing, Cloud,
AR/VR and many other automation tools.
Manufacturing industry uses Industrial IOT to
prevent overstocking and understocking of inventory.
In chemical industries, every plant wants to reach
maximum level of performance. Automation can help
reduce risks and improve productivity which in turn
lowers operational costs. Cloud computing can be used
in agricultural activities such as production planning
[1][2], operational planning [1], various management
strategies for indoor farming [2], storage monitoring
[2] and reliable data sharing between farmers and
consumers [2]. Textile industry uses AI for trend
predictions, machine diagnosis and analyzing large
chunk of data collected from manufacturing, purchase,
marketing and logistics.
COVID-19 pandemic has disrupted operations of
manufacturing industries on massive scale. It is forcing
manufacturers to rethink on starting the production
considering safety protocols and using new ways for
manufacturing operations. Owing to this situation the
demand for certain products such as sanitizers, digital
devices, tablets, masks, PPE kits has grown up suddenly
and industries is facing difficulties to meet the demand
from several reasons such as unavailability of sufficient
raw material, skilled labors and manufacturing process.
In order to meet these demands certain industries have
switched to automations and digitization of
manufacturing processes [3].
Automation and digitization of manufacturing
processes essentially involves data analytics. Data
analytics involves collection of lots of data through
various sensors inorder to track the process.
Processing of this data involves cleaning, modeling and
transforming data in order to lay out conclusions. Data
analytics is classified into 4 types – Descriptive,
Diagnostic, Predictive and Prescriptive. Descriptive
analytics can be used to find out the trends in the data
or to find out the current scenario in the industry.
Diagnostic analytics helps us determine the reason
behind the trend that is seen in the data. Predictive
analytics predicts the future outcomes. Prescriptive
analytics allows us to provide suggestions to the
industry in order to improve the productivity.
In this research paper, for every case study
relevant techniques of analytics are applied and the
output of each technique is used as input to the other.
These techniques if performed independently would
not result into productive results. If in case, directly
predictive analytics is applied then our study fails to
identify the critical features and tend to use all the
features which degrades the performance thereby
giving us a faulty result. Similarly, prescriptive
analytics cannot be applied directly to the case study.
Hence, we need to first carry out diagnostic analytics as
it gives us the root cause of the trend that is seen and
then based on the results we move towards
prescriptive. This research paper also focuses on Data
Analytics methods used for the digitization and
automations of the processes relevant to dealing with
COVID -19 situations.
This research paper is organized into 4
sections. In the first section methodology is explained.
In methodology there are 3 parts – Expenses, Employee
and Domain. For these parts sample data is collected](https://image.slidesharecdn.com/irjet-v8i417-220105103203/75/IRJET-Contradicting-the-Hypothesis-of-Data-Analytics-with-the-Help-of-a-Use-Case-Related-to-Manufacturing-Industry-1-2048.jpg)
![International Research Journal of Engineering and Technology (IRJET) e-ISSN: 2395-0056
Volume: 08 Issue: 03 | Mar 2021 www.irjet.net p-ISSN: 2395-0072
© 2021, IRJET | Impact Factor value: 7.529 | ISO 9001:2008 Certified Journal | Page 91
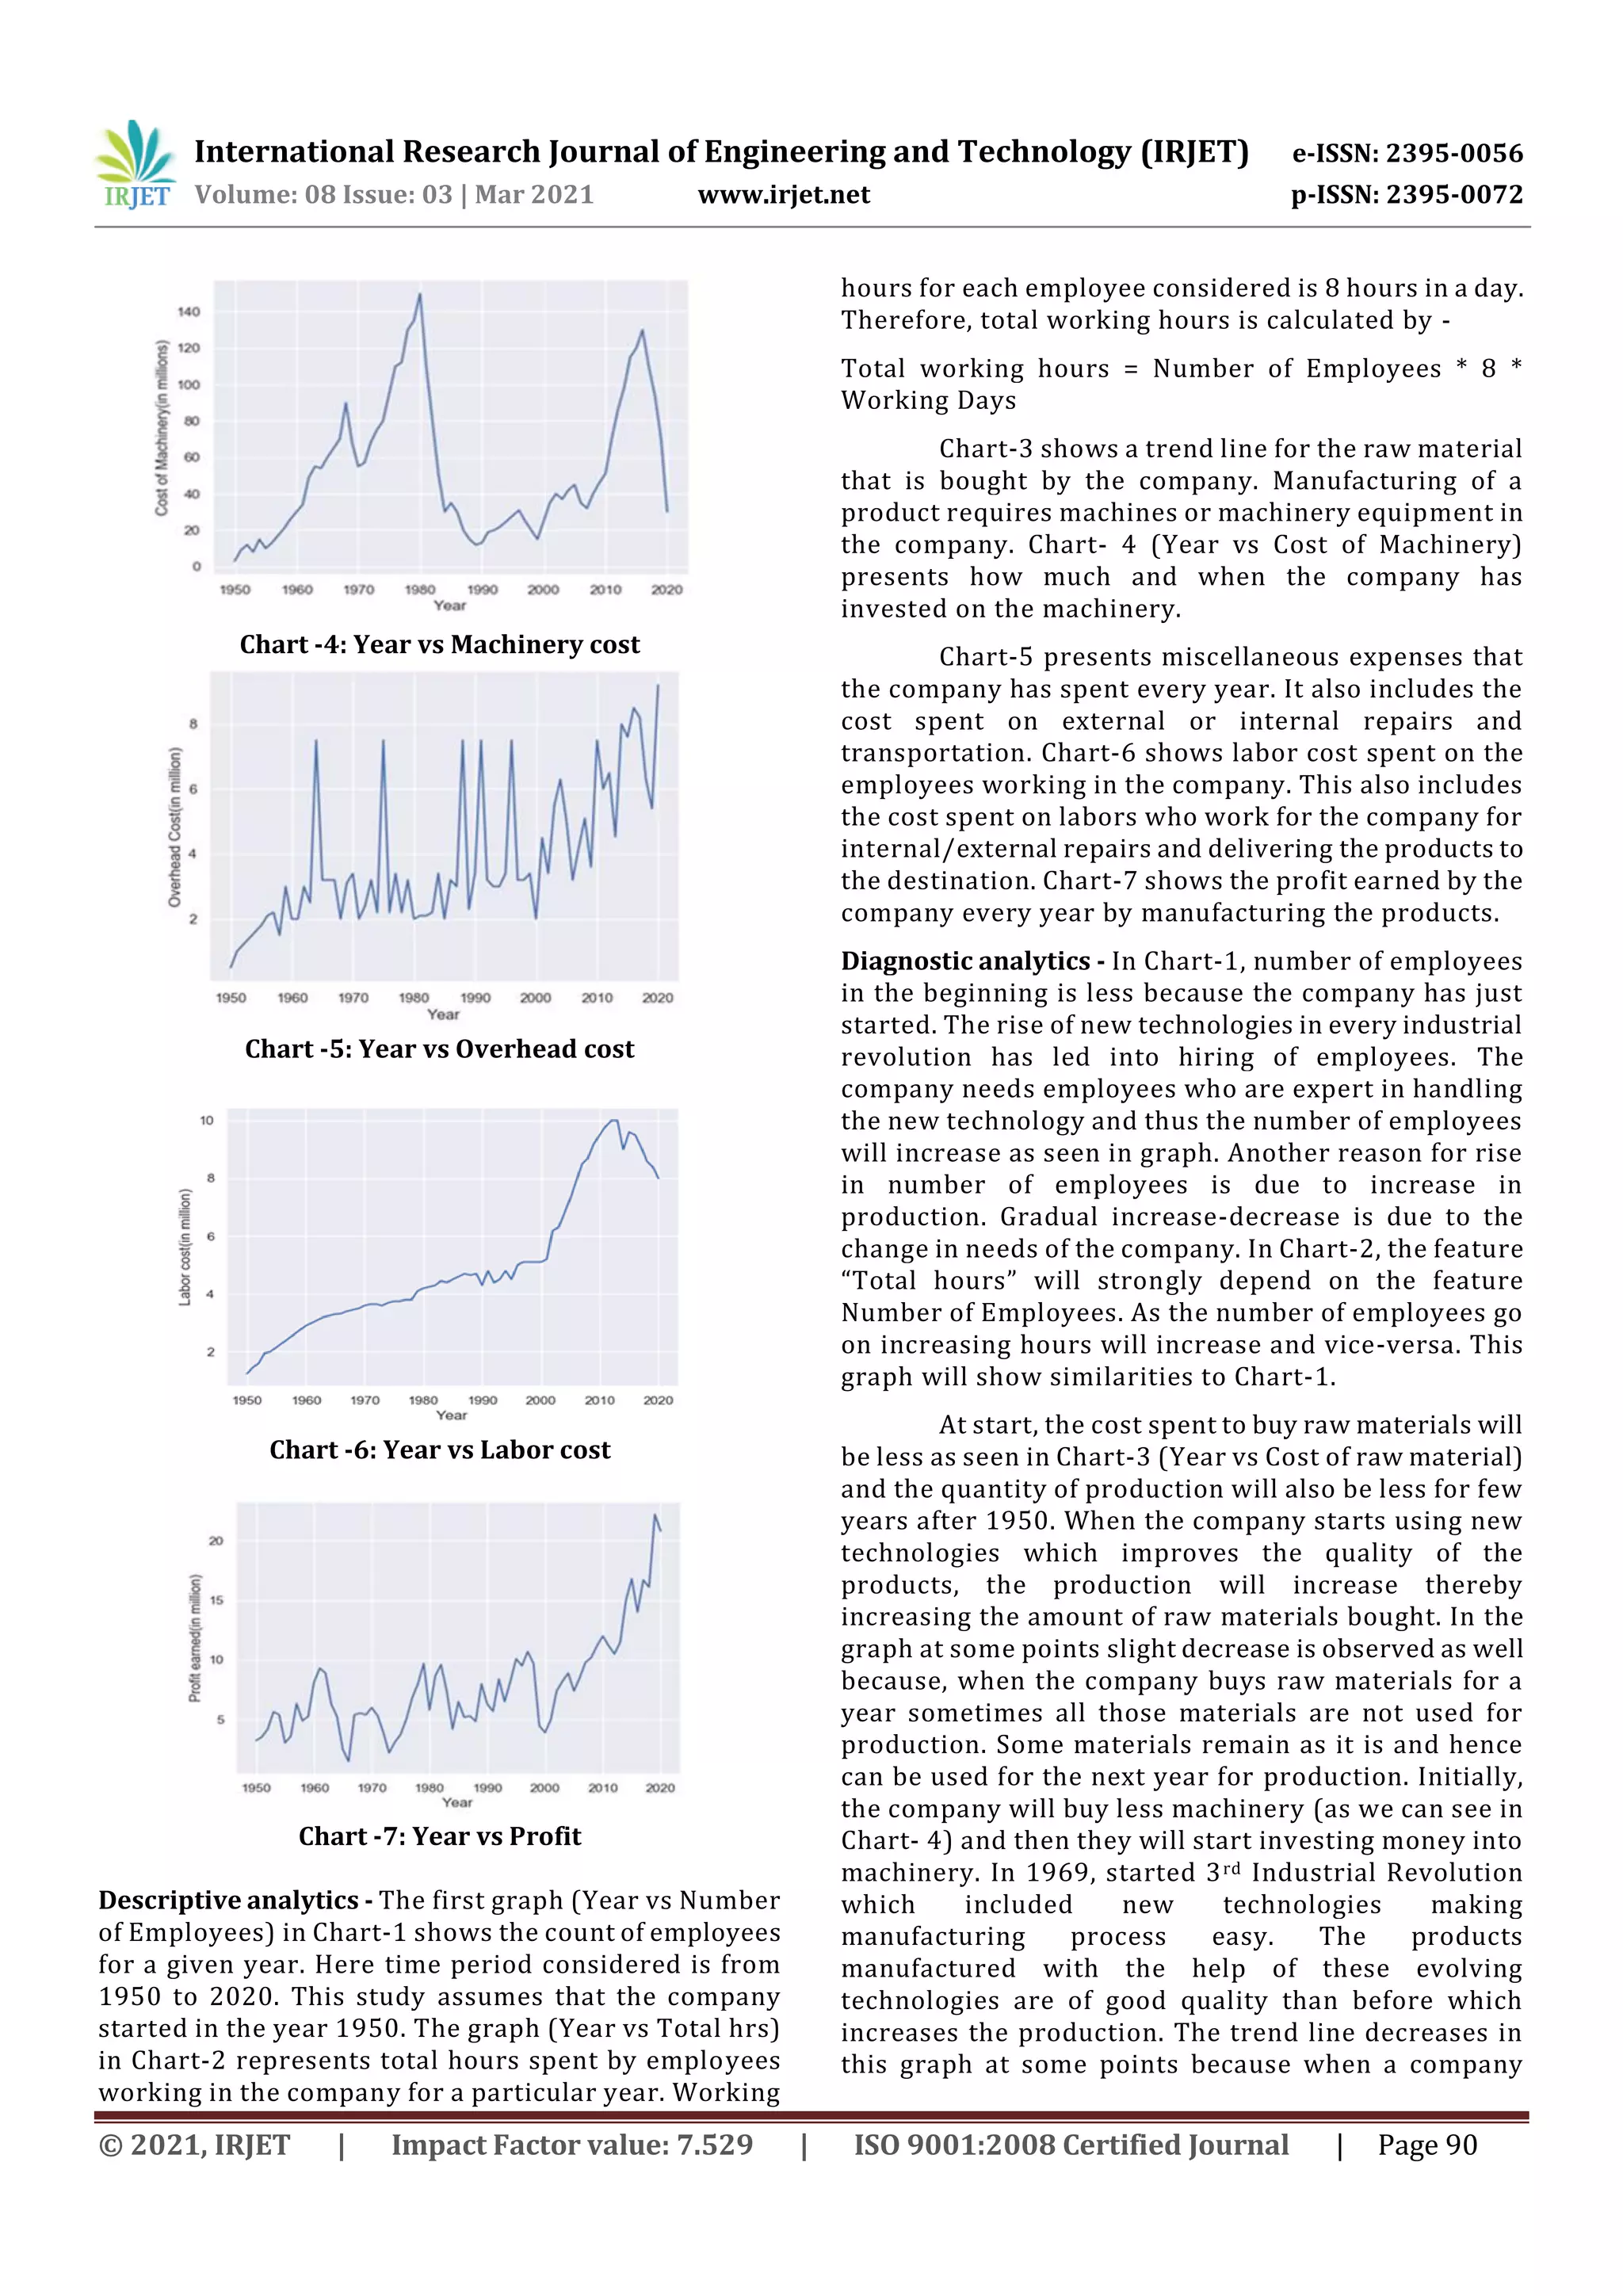
once buys machines or machinery equipment, they use
the same machines for longer period of time.
Overhead costs are the miscellaneous expenses
that the company has to spend. When the company
starts using new technologies, the maintenance cost,
repairing cost, electricity cost and transportation cost
goes on increasing as production increases which can
be seen in Chart- 5. Labor cost depends on the number
of employees working in the company. As the number
goes on increasing labor cost will also increase (as seen
Chart-6). Moreover, as the company starts using new
technologies, the count of labors who work for the
company for maintenance and repairing will go on
increasing which again increases the labor cost.
In Chart-7, initially profit will be less because
the company has just started and the quality of
products will be satisfactory but not so good. As and
when the company introduces new technologies, the
quality of product will also increase thereby making
more profit.
Prescriptive analytics - To maximize profit, to
minimize the number of employees and working hours
which in turn minimizes the labor cost, manufacturers
need to practice Industry 4.0. In the era of Industry 4.0,
currently companies use technologies like IOT, Digital
twin, Data science, Big Data, Augmented reality, Virtual
reality, Cyber-physical systems, 3D printing. More
advanced technologies that a manufacturing industry
can make use of are –
1) Ultrafast 3D printing: - In Industry 4.0 we have
technology called 3D printing but 3D printing has
limited applications. It is time consuming and
expensive when a product is to be built layer by layer,
for example, 3D printer used in Plastic manufacturing
industry. However, the new technology called ultrafast
3D printing can be used which makes use of an ink jet
head to deliver material, which it then fuses with an
infrared lamp. Process is up to 100 times faster than
the current technique [4].
2) Light based manufacture: - This technology can be
used to manufacture electronic components in our
smartphones and computers. This light based method
relies on optical traps (devices using light to
manipulate small objects in liquid). Currently, costly
robots place and solder minute parts of circuitry. As
electronic components get smaller and smaller, it
becomes very difficult and time consuming process.
Therefore, light based manufacture can provide a cheap
and simple alternative [4].
3) Simulation: - Simulation gives us an idea beforehand
regarding how parts would behave. This helps
manufacturers reduce errors and cut costs [4].
4) Smart manufacturing: - In this technology,
companies can use sensors to automate their machines
or the manufacturing process [4]. Some of the sensors
are given below –
a) Moisture sensor: - The quality of raw material that
arrives at the company can be checked with many
parameters, one of them is moisture. Moisture sensor
can be used to measure the volumetric water content in
industrial raw materials.
b) Vibration sensor: - This sensor can be used to
monitor the jerks or vibrations rising from the internal
and external defects. This leads to knowing of defects
before occurrence. Vibration sensors give the machine
condition, abnormal vibrations indicating problems in
the machine. This can help detect early and repair the
machine before it fails.
c) Motion sensor: - Motion sensor is used to detect
movements of objects. Example – Detecting stalling of
conveyors or seizing of bearings [5].
d) Temperature sensor: - Temperature sensor is used to
monitor, control and display the temperature in its
environment. Temperature sensors are used in
industries to monitor and control temperature of
machines which have higher workloads. Example - This
sensor can be used to measure overheating of
machinery which has workload in metal works, plastic
and rubber industry [5].
e) Pressure sensor: - Pressure sensors can be used in
manufacturing environments where high pressures are
required to create a product. The generation of high
pressures can be dangerous, so the levels must be
measured to ensure that the manufacturing process
remains safe. Pressure sensor measures the pressure
applied and converts it into electrical signal, which can
be read by the user. Example - Controlling the pressure
of various gas or liquid in flow pipes and tanks [5].
f) Ultrasonic sensor: - Detects internal holes, cracks,
presence of objects and measures the distance.
g) Barcode: - Barcode is used for product identification
and tracking. It works fast and removes data entry
errors.
h) Force sensor: - It used to measure various
parameters like weight, torque and load. It also helps in
recording torque of rotating machines like engine,
gearbox, rotor, etc. Automated processes can take this
data to provide the most optimal loads for each piece of
machinery [5].
i) Vision sensors: - Used for quality control, monitoring
purposes and completeness control. These are mostly
used in industrial robots for handling systems,
semiconductor manufacturing machines and assembly](https://image.slidesharecdn.com/irjet-v8i417-220105103203/75/IRJET-Contradicting-the-Hypothesis-of-Data-Analytics-with-the-Help-of-a-Use-Case-Related-to-Manufacturing-Industry-5-2048.jpg)
![International Research Journal of Engineering and Technology (IRJET) e-ISSN: 2395-0056
Volume: 08 Issue: 03 | Mar 2021 www.irjet.net p-ISSN: 2395-0072
© 2021, IRJET | Impact Factor value: 7.529 | ISO 9001:2008 Certified Journal | Page 92
lines. Example - Inspection of supply chain and
machinery for quality assurance [5].
j) Particle Sensors/Detectors: - These electronic
devices sense dust and other airborne particulates and
supply signals to inputs of control or display devices.
Example - If rust occurs on machines or dust gets
collected into some internal part [5].
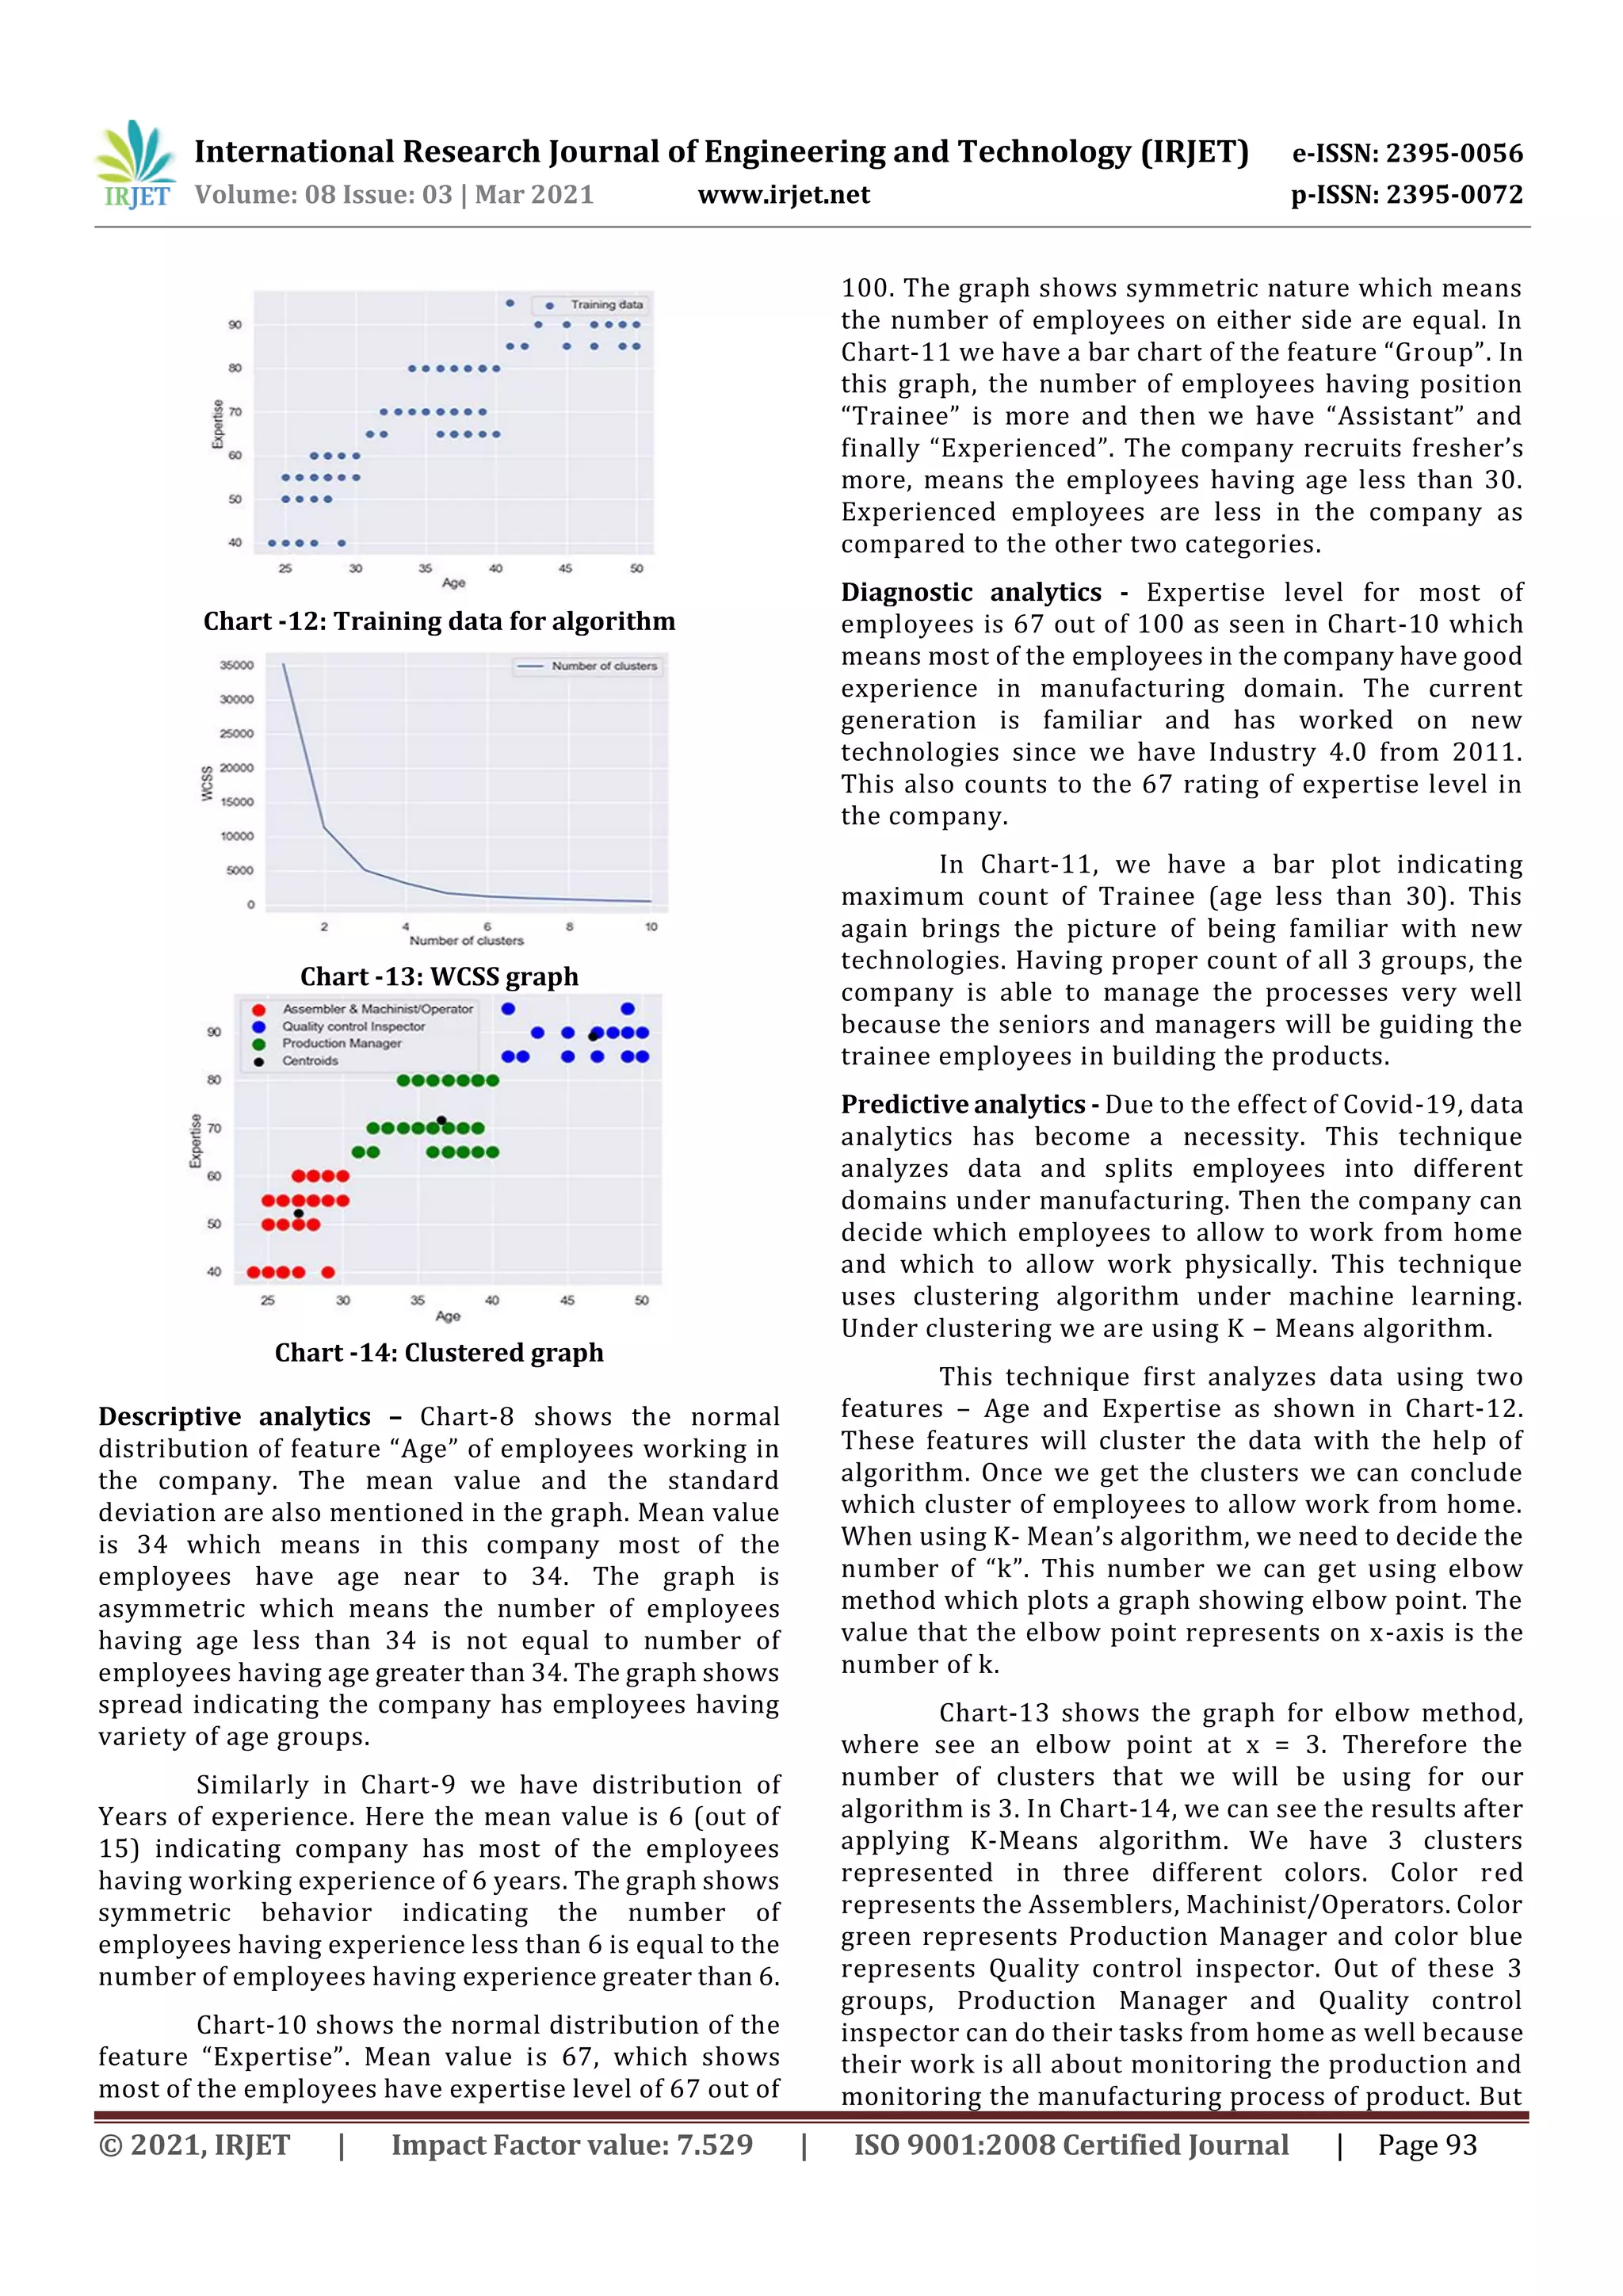
This case study first applied Descriptive analytics
which gave us a trend regarding the current condition
of expenses in the company every year. Further applied
Diagnostic analytics to understand the trend seen for
which descriptive served as a base. Again, applied
Prescriptive analytics to prescribe certain technologies
that can be implemented inorder to improve and bring
out a promising trend.
2.3.1 Case Study-2: Employee data
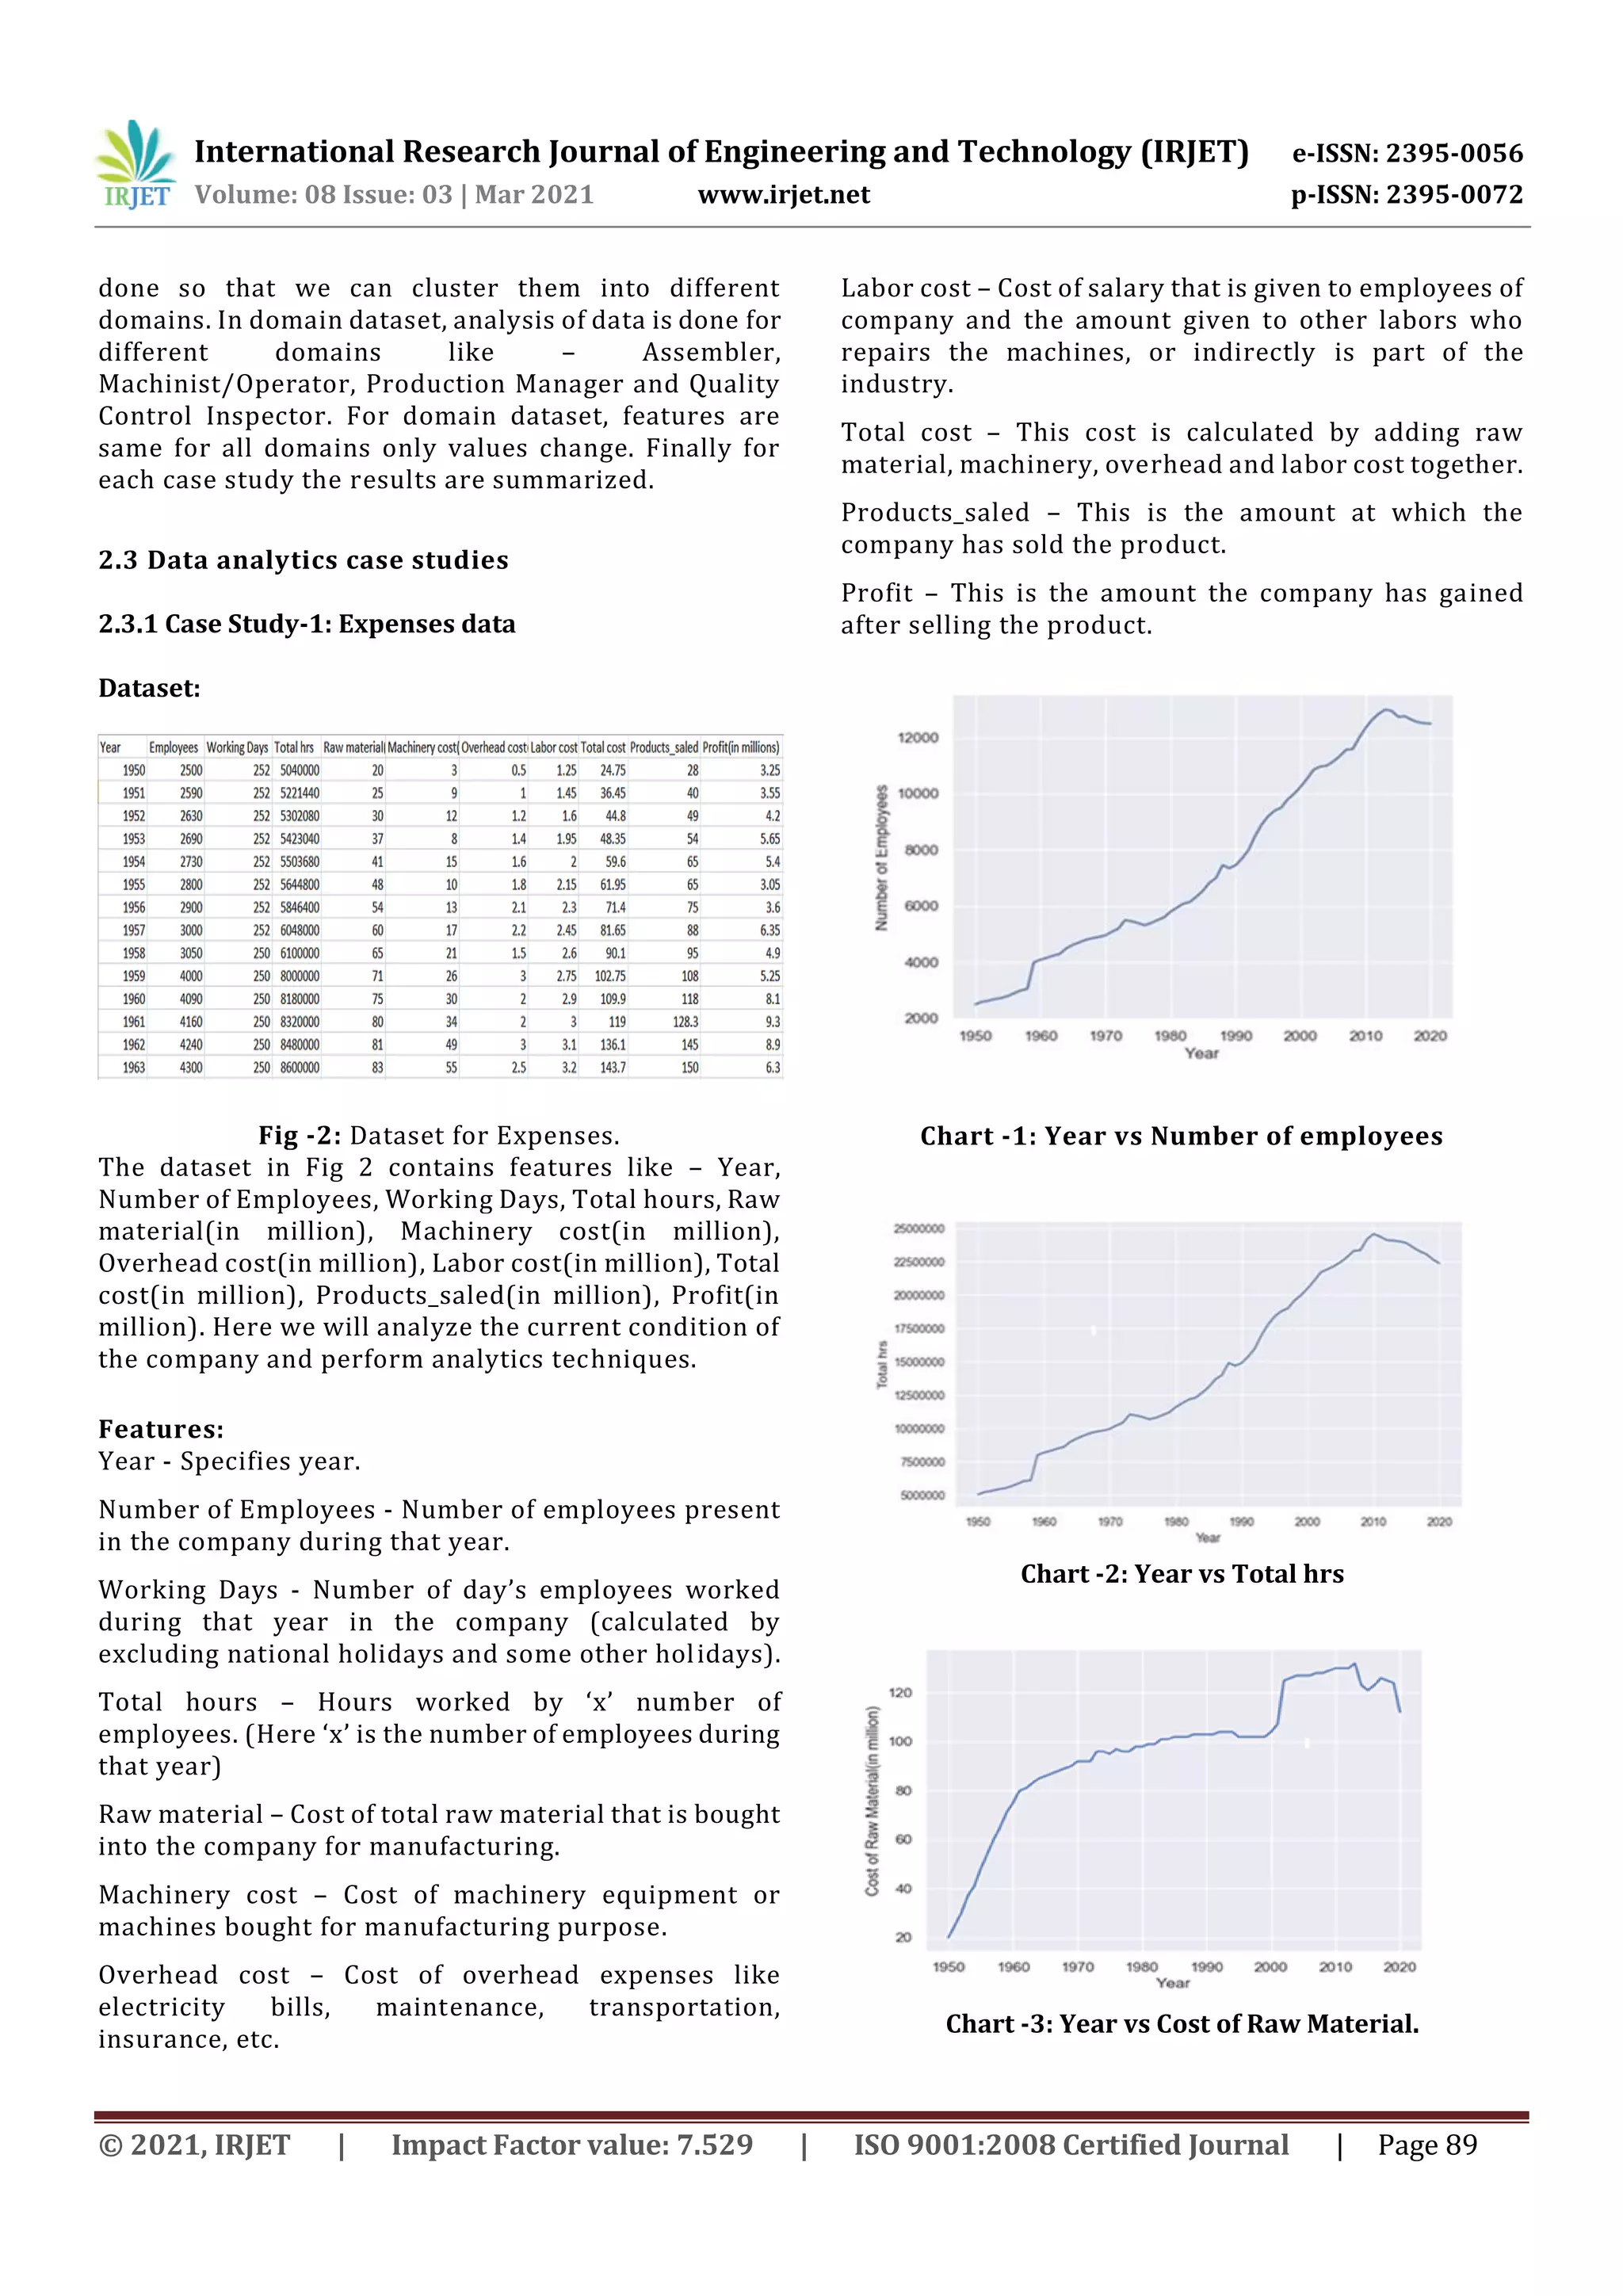
Dataset:
Fig -3: Dataset for Employees
Dataset in Fig-3 contains features like Employee id,
Age, Group, Year, Years of Experience, yrs_rate,
skills_rate, sale, manufacture_rate, Expertise, Salary.
Here we will analyze the data of the employees that are
working in the company.
Features:
Employee id – This is the id that is given to every
employee of the company.
Age – This feature describes the age of each employee.
Group – Describes the different positions of employee
in the company like Trainee, Assistant, and
Experienced.
Year – Describes the year in which the employee
entered the company.
Years of Experience – Describes the number of years
the employee has experience in manufacturing domain.
Yrs_rate, skills_rate, manufacture_rate, sale – These
features are used to calculate expertise level of each
employee.
Expertise – Expertise level of each employee out of 100
working in manufacturing company.
Salary – Salary of each employee in the company.
Chart -8: Normal distribution for Age
Chart -9: Normal distribution for Years of Experience
Chart -10: Normal distribution for Expertise.
Chart -11: Bar plot for Group](https://image.slidesharecdn.com/irjet-v8i417-220105103203/75/IRJET-Contradicting-the-Hypothesis-of-Data-Analytics-with-the-Help-of-a-Use-Case-Related-to-Manufacturing-Industry-6-2048.jpg)
![International Research Journal of Engineering and Technology (IRJET) e-ISSN: 2395-0056
Volume: 08 Issue: 03 | Mar 2021 www.irjet.net p-ISSN: 2395-0072
© 2021, IRJET | Impact Factor value: 7.529 | ISO 9001:2008 Certified Journal | Page 97
automate their processes. For each domain different
technologies are suggested. By using these technologies
the company is able to produce good quality, reliable
products raising the production and increasing the
profit.
5. REFERENCES
[1] Hori, M., Kawashima, E., & Yamazaki, T, (2010),
“Application of cloud computing to agriculture and
prospects in other fields”, Fujitsu Sci. Tech. J, 46(4),
446–454.
[2] Biduaa K. R. & Dr. Patela, C. N, (2015), “Internet of Things
and Cloud Computing for Agriculture in India”,International
Journal of Innovative and Emerging ResearchinEngineering
Volume 2, Issue 12.
[3] Paul, S. K. & Chowdhury, P.,(June 2020), “A
production recovery plan in manufacturing supply
chains for a high-demand item during COVID-19”,
International Journal of Physical Distribution &
Logistics Management.
[4] Finch, S. (22nd November, 2017), “5 technologies
now changing manufacturing”, Retrieved February
21, 2021, from https://foundry4.com/5-
technologies-now-changing-manufacturing
[5] Thomasnet.com (n.d.), “Sensors – A complete guide
(Types, Applications and Suppliers)”, Retrieved
February 21, 2021, from
https://www.thomasnet.com/articles/instruments-
controls/sensors/#applications](https://image.slidesharecdn.com/irjet-v8i417-220105103203/75/IRJET-Contradicting-the-Hypothesis-of-Data-Analytics-with-the-Help-of-a-Use-Case-Related-to-Manufacturing-Industry-11-2048.jpg)

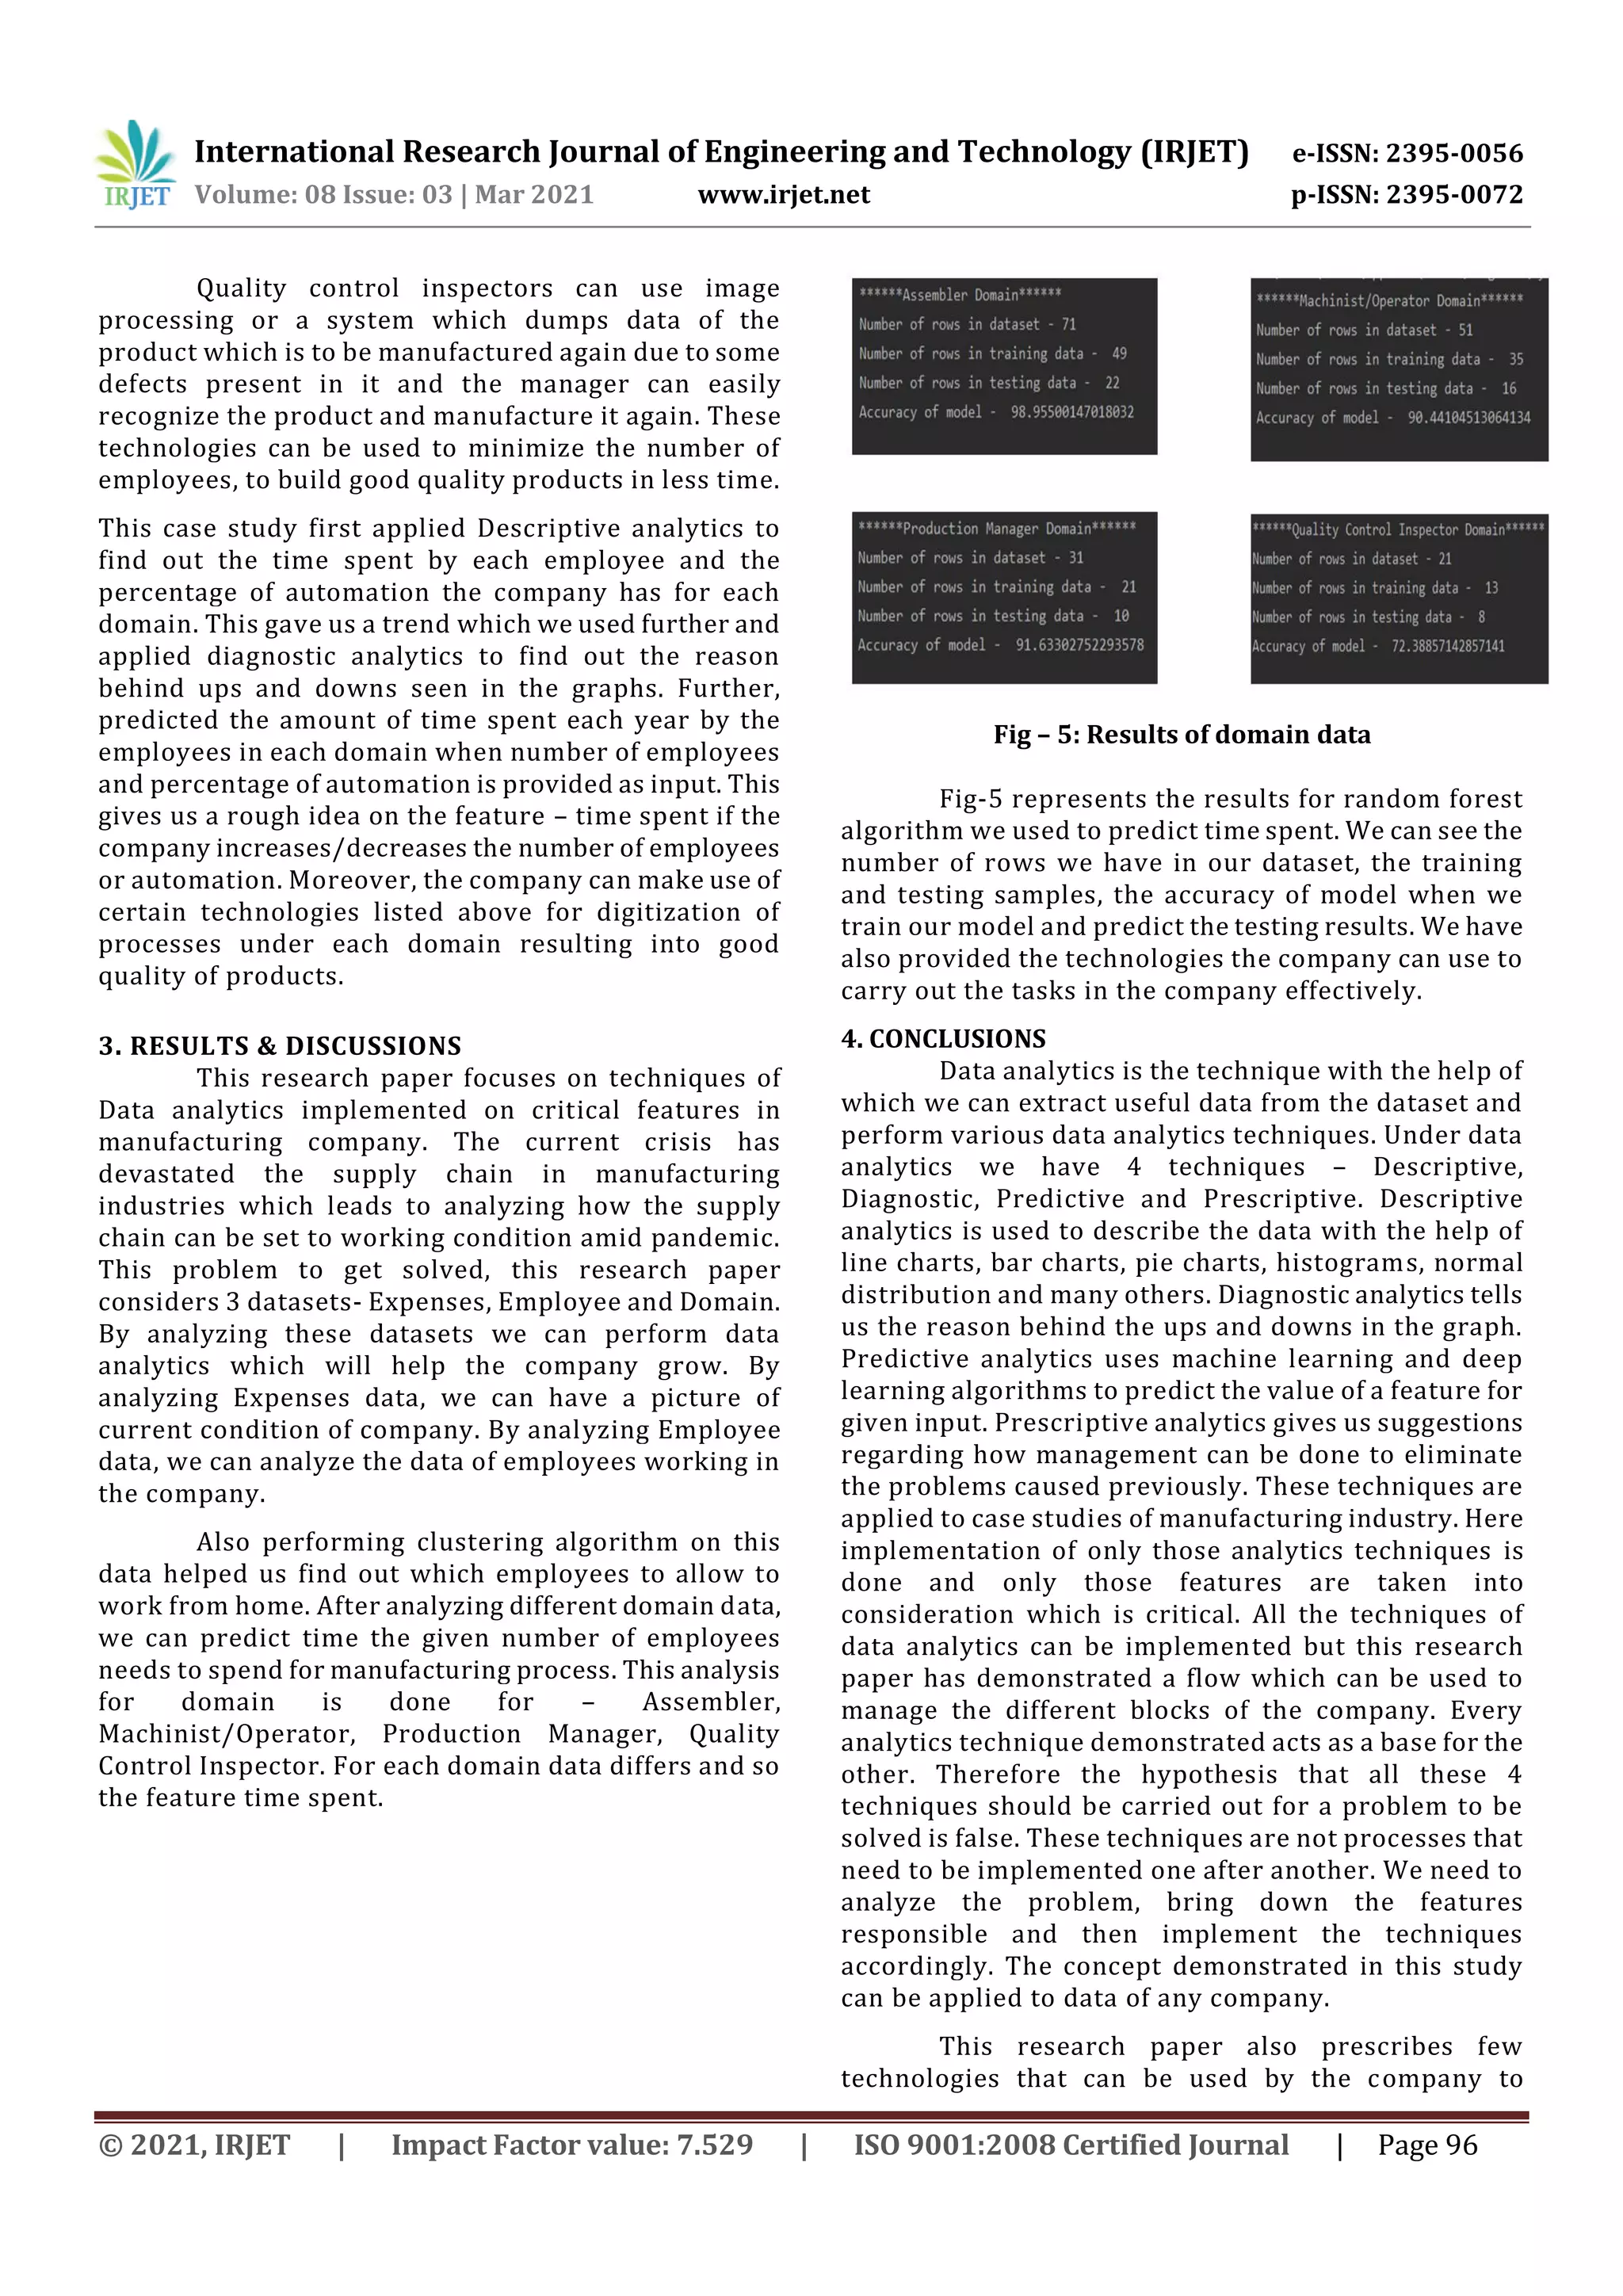
This document discusses how data analytics techniques can be used to analyze manufacturing industry data and help with decision making. It presents a case study analyzing expenses data from a manufacturing company from 1950 to 2020. Descriptive analytics on the data show trends in number of employees, working hours, costs of raw materials, machinery, overhead, labor, and profit over time. Diagnostic analytics provide reasons for these trends, such as increases in employees and costs correlating with new technologies and production increases. Predictive analytics are not discussed in the summary. The document suggests prescriptive analytics using advanced Industry 4.0 technologies like ultrafast 3D printing could help maximize profit and minimize employees and costs.