Download to read offline
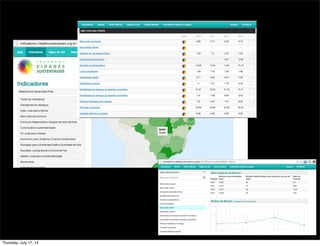
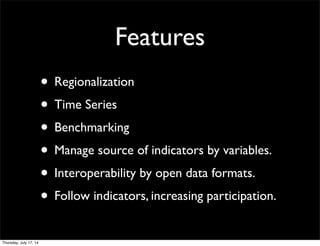
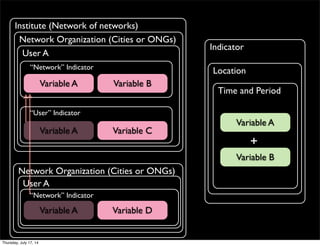
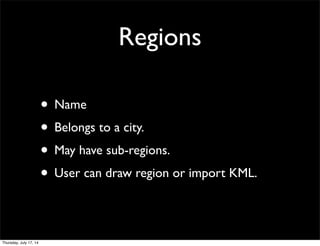
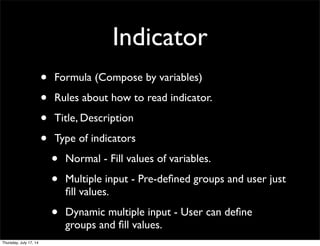

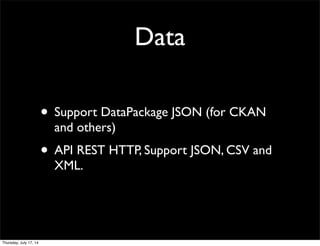
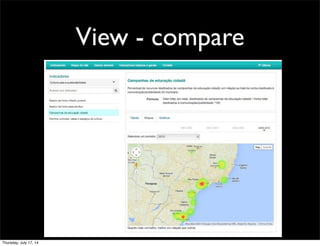
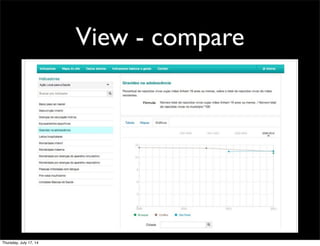
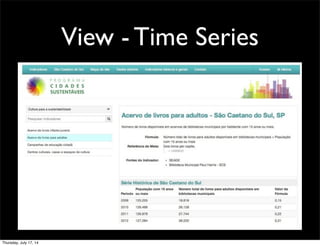
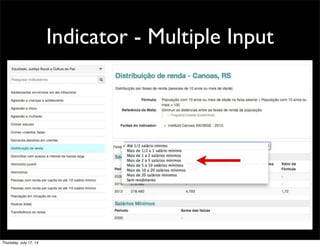
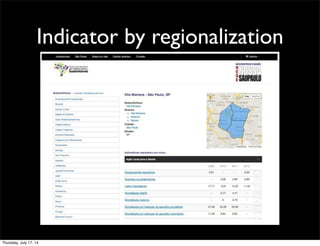
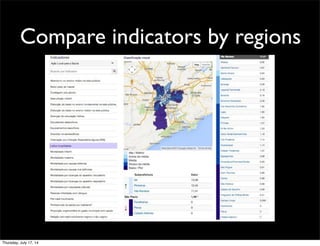
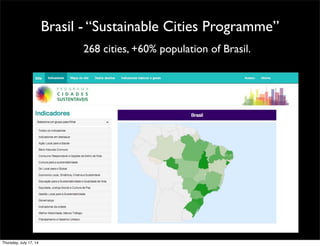
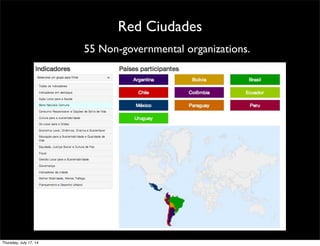
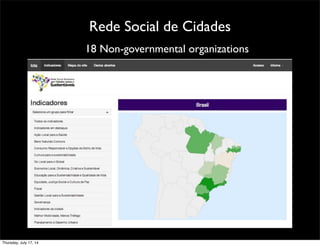

The document discusses a system for tracking transparency and accountability indicators across networks of organizations and users. It describes features like regionalization, time series analysis, and benchmarking of indicators. The system allows networks to define indicators and variables, while users can fill variables and create custom indicators and reports at the regional level. Data is shared using open formats and APIs to enable comparison of indicators across organizations and regions.


![OpenData-BR, [Captando] Dados públicos brasileiros](https://cdn.slidesharecdn.com/ss_thumbnails/opendatabr-rc2-110119072252-phpapp02-thumbnail.jpg?width=640&height=640&fit=bounds)


![5G Explained! A High Level Overview [Introduction]](https://cdn.slidesharecdn.com/ss_thumbnails/5gexplainedahighleveloverview-260119165306-cc137a3e-thumbnail.jpg?width=640&height=640&fit=bounds)


