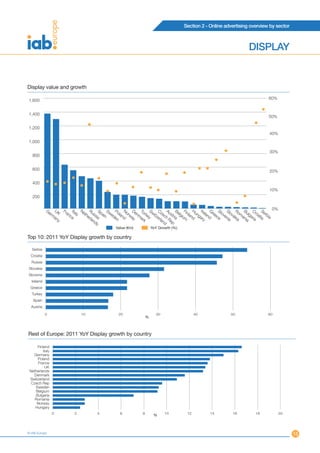
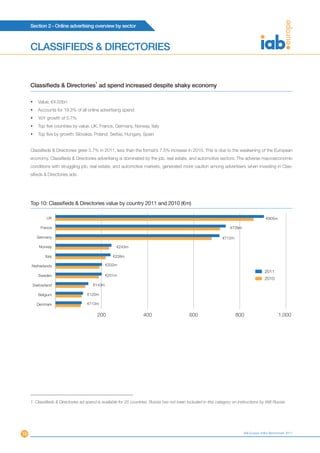
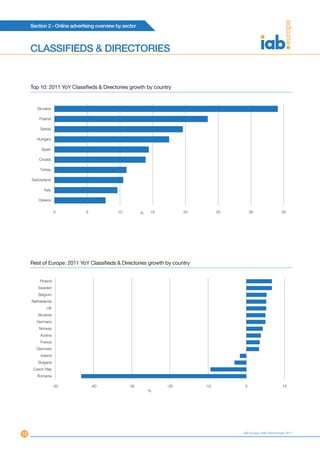
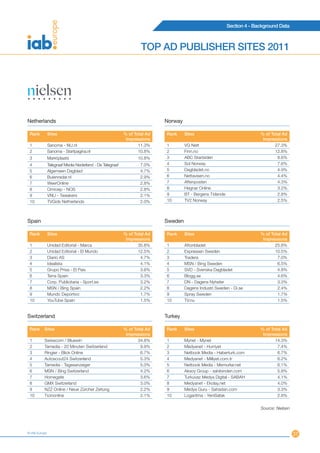
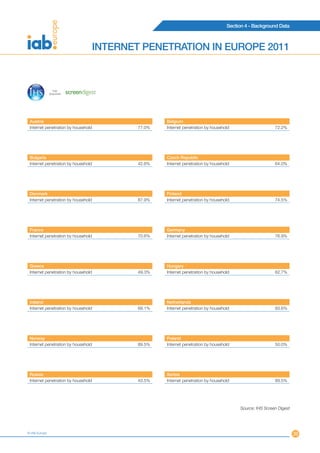
ADEX
  BENCHMARK
        2011
       EUROPEAN ONLINE
ADVERTISING EXPENDITURE


Published 9th July 2012
CONTENTS


    3    Introduction
    4    About this report
    5    Executive Summary


         Section 1 - AdEx 2011 Analysis

     6   2011 Growth in context
     8   26 Markets in perspective
    12   Share of formats


         Section 2 - Online advertising overview by sector

    13   Display
    16   Classifieds & Directories
    19   Paid-for-search
    22   Mobile
    23   Video


         Section 3 - Overview by country

    24   Western Europe
    28   Central & Eastern Europe


         Section 4 - Background data

    31   TOP properties December 2011
    36   TOP ad publisher sites 2011
    39   Internet penetration in Europe 2011


         Section 5 - Appendices

    41   Appendix i
    42   Appendix ii
    43   Appendix iii
    43   Appendix iv
    47   Our research partners
    48   About IAB Europe
    49   And finally


2                                                            IAB Europe AdEx Benchmark 2011
INTRODUCTION


This year’s report documents the ongoing success story for online
advertising. As of 2011, on average 20% of all advertising budgets     Digital media and digital marketing are and will remain a
in Europe were dedicated to online. One out of five advertising        key growth engine of the economy in Europe. The sus-
Euros is now invested in online platforms.                             tainable success of the digital economy continues even
                                                                       and especially in tough economic times. Not only the
Initially, the IAB network discussed including 10 countries by 2010    rapid development of digital markets in Eastern Europe
and hoped to reach an average of 10% online market share. The          shows that this pan-European trend is far from coming
reality today looks quite different. The 2011 AdEx Benchmark           to an end - especially the remarkable figures in Europe’s
includes 26 countries and the average online markets share in          core countries just show that the digitization of the
Europe is 20%. Despite the recession, our industry has been per-       economy is continuing unabatedly. This also is reflected
forming very well, growing 14.5% in 2011. Direct response and          by the latest AdEx Benchmark report.
branding formats are flourishing, indicating that advertisers are
considering digital advertising for various aspects of their market-   Thomas Duhr, Executive Sales Manager,
ing and communication strategies.                                      United Internet Media AG


In 2011, media buyers invested 21 billion Euros online in our con-
tinent, bringing our market close to the size of the US and also
putting online within the top 3 media in each country, in terms of
ad spend.


The currency of our success is ‘data’ as it makes advertising more
relevant for the consumer and more efficient for the advertiser.
However, as we continue to integrate data in online advertising we
have to act with respect, in order to build trust and transparency
whilst maintaining standards and simplicity.


Alain Heureux, CEO & President, IAB Europe


© IAB Europe                                                                                                                       3
ABOUT THIS REPORT


    The sources of the online advertising spend data contained within
    this report are the annual industry benchmarking studies run by
    each national Interactive Advertising Bureau (IAB) in Europe. The
    national benchmarking studies represent the income of thousands
    of websites and online advertising businesses.


    The reported results are considered the closest measurement of
    online advertising revenues across Europe as the data is compiled
    directly by local IABs based on information supplied by compa-
    nies selling advertising online in each country. Only IABs that were
    able to provide 12 full months of advertising expenditure data are
    included. With the entry of IAB Serbia, the AdEx Benchmark cov-
    ered 26 local IABs in 2011.


    The data for this report is stated on the basis of actual gross in-
    come (the amount of actual spend invoiced by the publisher in-
    cluding any agency commission). To avoid any double-counting,
    production costs and pan-regional ad spend are taken out of the           IHS Screen Digest does not audit the information or the data from
    figures provided by the local IABs.                                       local IABs and provides no opinion or other form of assurance with
                                                                              respect to the information. Only aggregate results are published
    The report incorporates data from the following online advertising        and individual company information is held in strict confidence by
    formats:                                                                  the audit partners of local IAB studies.


    •          Display
    •          Classifieds & Directories
    •          Paid-for-search


    Where national IABs report data for spend on mobile online adver-
    tising this is incorporated into the relevant advertising format total.


    IAB Europe in partnership with IHS Screen Digest collates and
    aggregates the data and makes the adjustments necessary to en-
    able the data to be comparable. Full details of this process for
    each country are provided in Appendix iv.


    The result is comparable data based on actual revenues from
    across Europe. This is the sixth edition of the report and therefore
    once again we are able to include year-on-year comparisons in
    for those countries that have provided data for at least two years.


4                                                                                                                        IAB Europe AdEx Benchmark 2011
EXECUTIVE SUMMARY


Despite the continued weak macroeconomic conditions across                In Europe, individual market growth in 2011 ranged from 55.5%
Europe and globally, Europe’s online advertising market contin-           in Russia and 40.0% in Croatia, to 5.5% in Norway and 4.6% in
ued to grow double-digit in 2011. Investment in all online formats        Romania. Central and Eastern European (CEE) markets increased
increased during this period 14.5% year-on-year1, with paid-              their share of total European online ad spend from 10.1% in 2010
for-search leading the surge, closely followed by display. Online         to 11.8% in 2011. It is important to note that the UK and Germany
growth outperformed the overall advertising market, which ex-             alone account for 45.2% of all European online ad spend. Russia
cluding online grew at a sluggish 0.8% in 2011.                           has established itself as the sixth biggest market with a value of
                                                                          €1.12bn, buoyed particularly by a surging search market.
The European online advertising market crossed the €20 billion
mark for the first time at €20.9 billion in 2011, up from €18.3 billion   Paid-for-search and display drove online advertising growth in
                         2
in the previous year . Online accounted for 21.7% of European             2011. Increasing 17.9%, paid-for-search reached €9.72 billion,
advertising spend.                                                        closely followed by display which rose by 15.3% to €7.03 billion.
                                                                          Even Classifieds & Directories, a format which usually suffers in
The USA remains slightly ahead of Europe in terms of online ad-           a tough economic environment due to high exposure to the job,
vertising revenues which amounted to €24.5 billion in 2011 follow-        real-estate, and automotive markets, increased by 5.7% in 2011
ing year-on-year growth of 21.9%. Apart from a healthy online in-         to just over €4 billion.
dustry, US growth also benefitted from the presidential primaries.
                                                                          The present report provides detailed analysis of developments in
                                                                          each format across the 26 participating countries.
Online grows 14.5% in 2011

       25

       20                                 14.5%      €20.9bn
                    €18.3bn
       15
 €bn


       10                                                                 European online advertising: year-on-year growth (%)

        5
                                                                              25
        0                                                                             40.0%
                         2010                           2011                                         21.3%
                                                                              20           17.9%
                                                                                   16.1%                 15.4%                     15.3% 14.5%
                                                                              15
Online ad spend: Europe vs USA                                            %
                                                                              10                                    7.4%
                                                                                                                           5.7%
       25                                                                      5
                                                               €24.5bn
       20                                         €20.9bn                      0
                                €20.1bn                                            Paid-for-search    Display       Classified &      Total
               €18.3bn                                                                                              Directories
       15                                                                                    2010            2011
€bn


       10

       5                                                                  1. Year-on-year growth is calculated excluding the ‘other’ category
                                                                          to maintain comparability across countries. Serbia was an exception
       0                                                                  to this rule, where most of ‘other’ constituted of social media spend,
                         2010                            2011             which is normally reported as part of display advertising.
                                                                          2. At constant 2011 currency exchange rates.
                                 Europe           USA


© IAB Europe                                                                                                                                       5
SECTION 1 - AdEx Benchmark 2011 Analysis


    2011 GROWTH IN CONTEXT


    ONLINE ADVERTISING STABILISES IN 2011                                   markets. Online was also affected, but nevertheless outperformed
                                                                            all other media and achieved an overall growth of 4.5%. Some
    Spend on European online advertising has grown every year since         of the emerging online markets saw a slight decline though, as
    IAB Europe began benchmarking the market in 2006.                       the sector was still fragile. The overall growth was maintained by
                                                                            paid-for-search, which managed to grow 10.8% despite tough
    In 2007, spend on online advertising grew by 40%. This was              economic conditions, as advertisers were reassured by the direct
    driven by substantial growth in the dominant high value Western         response payment structure.
    European markets such as Germany, the UK, and France.
                                                                            In 2010, Europe’s online advertising industry rebounded with an
    As these markets matured in 2008, their growth decelerated and          increase of 15.3%, indicating a recovery from the 2009 slowdown.
    clustered around 20%. High growth was still present in some             Display led this surge with a 21.3% increase, as new advertisers
    emerging markets like Poland and Slovenia, however the total val-       entered the medium and existing online advertisers increased their
    ue of these markets was not sufficiently large to have a substantial    spend on branding campaigns.
    impact on the overall European growth rate.
                                                                            In 2011, online maintained its double-digit growth despite tough
    In 2009, the effect of the economic recession was strongly felt         macroeconomic conditions with a year-on-year growth rate of
    in the advertising sector which saw significant declines in many        14.5%, indicating the ongoing confidence that advertisers place
                                                                            in online as an advertising medium.


    Online advertising growth over time

                             40%
           40

           35

           30

           25
     %


                                                      20.2%
           20
                                                                                                 15.3%
                                                                                                                            14.5%
           15

           10
                                                                           4.5%
            5

            0
                             2007                     2008                   2009                    2010                      2011


6                                                                                                                   IAB Europe AdEx Benchmark 2011
SECTION 1 - AdEx Benchmark 2011 Analysis


                                                                        2011 GROWTH IN CONTEXT


ONLINE OUTPERFORMED WEAK ECONOMY                                           2011, helped by the reliable measure of return-of-investment
                                                                           (ROI), as evidenced by the 17.9% increase in the format. Advertis-
Advertising markets are in general very susceptible to changes in          ers increasingly also recognise online as a brand advertising medi-
the macroeconomic environment. In the context of the European              um. This is reflected in a growing video share, which commanded
sovereign debt crisis, high unemployment and cutbacks in con-              7.6% of all online display ad spend in 2011.
sumer spending, advertising spend suffered disproportionately on
most media in 2011.                                                        Secondly, the increased use of demographic, behavioural and
                                                                           other consumer data in online display advertising, paired with al-
                1
Total European advertising across all media grew by 3.6% in                gorithmic processing, allows enhanced targeting capabilities that
2011, but would have experienced a mere increase of 0.8% with-             can improve cost efficiency.
out the contribution of online. In Western Europe, total advertis-
ing excluding online would have declined by 1.0%, but with the             Thirdly, there is a long-term trend for advertisers to shift ad budg-
11.5% surge in online ad markets, the region ended the year with           ets from mature to emerging markets, which is fuelling their online
a growth of 1.3%. Online also lifted CEE markets from what would           economy. in 2011, CEE countries constituted 11.8% of European
have been a 5.5% growth in ad markets excluding online to a                online ad spend, up from 10.1% in the previous year.
9.1% total media advertising growth rate year-on-year.


In comparison to traditional media, online advertising is not as ex-
posed to macroeconomic fluctuations.


Firstly, online offers a diversity of formats and payment structures
                                                                           1. The 26 countries participating in the study
to choose from. Growth in paid-for-search remained resilient in


Online advertising in context: Year-on-year growth


                                                                          19.7%
       20


                                                                                                                    14.5%
       15
                                   11.5%

       10                                                                          9.1%
 %


                                                                 5.5%
         5                                                3.2%                                                                3.6%
                    1.5%                   1.3%                                                    1.7%
                                                                                                            0.8%
         0
                           -1.0%
                                   WE                                   CEE                                    Total Europe
        -5

                              Nominal GDP         All media advertising           Online            All media advertising
                                                  excl. online


© IAB Europe                                                                                                                                       7
SECTION 1 - AdEx Benchmark 2011 Analysis


    26 MARKETS IN PERSPECTIVE


    Volume – Online advertising spend distribution stable in 2011

    2011 did not show any significant shifts in the composition of the top 10 countries investing in online advertising versus 2010. The most
    notable change was Russia’s assertion as the sixth largest online market in Europe at €1.12 billion, surpassing Spain, whose expenditure
    remained below €1 billion. Russia is still the only CEE market in the top 10 online advertising spenders, with a €752 million difference to the
    next country within the CEE region (Poland).


    The UK remained the largest online advertising market and is the first to have exceeded €5 billion. It accounted for 26% of all European
    online advertising, down from 27% in 2010. In second place, Germany’s share stood at 19% in 2011 corresponding to total market value
    of €4 billion. France maintained its bronze medal in 2011, whereas Italy surpassed the Netherlands to claim fourth place. The growth rates
    of these countries ranged between 8% and 15%, but were not significant enough to alter their ranking within the top 10.


    Top 10: Total by country 2011 and 2010 (€m)

             UK                                                                                                                           €5,510m

       Germany                                                                                         €3,959m
         France                                                      €2,287m

            Italy                                 €1,249m

    Netherlands                                  €1,200m
         Russia                                €1.121m
          Spain                          €925m                                                                                          2011
                                                                                                                                        2010
        Sweden                        €687m
        Norway                   €558m
       Denmark                   €524m

                    0                  1,000                2,000              3,000               4,000                  5,000                6,000


    Rest of Europe: Total by country 2011 and 2010 (€m)

        Poland                                                                                                                    €439m
    Switzerland                                                                                                               €422m
       Belgium                                                                                                   €365m
         Turkey                                                                                             €360m
        Austria                                                                                €296m
     Czech Rep                                                                         €269m
        Finland                                                                   €254m
         Ireland                                       €132m
       Hungary                                    €108m
        Greece                                 €100m                                                                                  2011
       Slovakia                 €45m                                                                                                  2010
       Slovenia                €32m
       Bulgaria            €30m
        Croatia           €26m
       Romania           €22m
         Serbia         €12m

                    0                      100                      200                   300                       400                         500


8                                                                                                                            IAB Europe AdEx Benchmark 2011
SECTION 1 - AdEx Benchmark 2011 Analysis


                                                                                                     26 MARKETS IN PERSPECTIVE


Growth – CEE region outpaces Western Europe

The markets which demonstrated the highest growth in online advertising in 2011 were countries from the CEE region. Russia led the
group with a growth of 55.5%, driven mostly by a surging search market and expanding internet population. Croatia, Serbia, and Slove-
nia which are display-driven markets, grew by 40.0%, 35.6%, and 31.1%. Slovakian and Polish online ad markets increased 29.7% and
23.1%, with strong growth across formats, while Turkey exhibited a robust growth rate at 22.4%.


CEE countries grew the strongest in 2011


          60
                  55.5%


          50


          40
                          40.0%

                                  35.6%


    %
                                          31.1%


          30
                                                  29.7%

                                                          23.1%

                                                                  22.4%


          20
                                                                          19.7%
                                                                                  15.5%

                                                                                          15.2%

                                                                                                  15.1%
                                                                                                          14.3%
                                                                                                                  14.2%

                                                                                                                          14.1%

                                                                                                                                  13.5%
                                                                                                                                          13.3%

                                                                                                                                                  12.8%
                                                                                                                                                          12.6%
                                                                                                                                                                  11.3%


                                                                                                                                                                                  10.7%
                                                                                                                                                                          11.0%


          10
                                                                                                                                                                                          9.9%
                                                                                                                                                                                                 8.8%

                                                                                                                                                                                                        7.9%

                                                                                                                                                                                                               5.5%
                                                                                                                                                                                                                      4.6%
           0       ia ia ia ia ia    d  y   e     ly   d rk                                                         n    a    n    y s    a   y           e        y    a
                 ss oat rb en ak lan rke eec Ita rlan ma                                                  UK land de gari pai gar and stri an Rep gium anc land rwa ani
               Ru Cr Se Slov Slov Po Tu Gr          e en
                                                 itz D                                                     Ire Swe Bul     S un erl Au erm ch el Fr Fin o om
                                                                                                                                                B             N R
                                                                                                                             H th      G ze
                                              Sw                                                                                Ne          C
                      CEE         WE


The Western European region also experienced healthy growth ranging from 5.5% in Norway, the most mature market with the highest
online ad spend per capita, to 19.7% in Greece, a nascent country in terms of online advertising which demonstrates dynamics more
representative of the CEE market, despite the country’s huge macroeconomic uncertainty.


© IAB Europe                                                                                                                                                                                                                 9
SECTION 1 - AdEx Benchmark 2011 Analysis


     26 MARKETS IN PERSPECTIVE


     Online share of total media ad spend – 1 in 5 European advertising Euros invested online

     Pairing online advertising data provided in this report with IHS Screen Digest valuations1 for all other media (television, print, cinema, radio,
     and out-of-home) reveals substantial variations in the online advertising market share across Europe.


     Higher market share indicates a more developed market, where the majority of advertisers invest in online in some way, and where ad-
     vertisers have a wide variety of formats and online channels from which to choose. Low market share for online advertising suggests that
     a market has headroom for growth, as it indicates that that there are still plenty of advertisers in the market who have not yet devoted
     themselves to the online medium.


     Online market share of total advertising ad spend across Europe reached 21.7% in 2011. This means that more than 1 in 5 European
     advertising Euros was invested online. The UK was the most developed online market in Europe at 35.9% share in 2011, while Greece
     despite its strong growth of 19.7%, occupied the last position with a share of 6.8%.


     Western European markets had a higher market share at 22.7% compared to the CEE equivalent of 16.9%. However, looking at national
     markets individually reveals that market shares within Western Europe on the one hand, and Central and Eastern Europe on the other are
     not homogeneous. For instance, Austria and Switzerland exhibit a low online share of their total media advertising spend at 13.0% and
     13.9%, lower than most CEE countries.


     Market shares calculated from IAB Europe and IHS Screen Digest data may vary from those published in the local markets by the national
     IABs. This is because the national IABs may have used a source other than IHS Screen Digest for the valuation of the total advertising
     market in that country.


     1. IHS Screen Digest valuations were used for all markets except for Poland and Hungary, upon request. For Poland we used Starlink figures and
     for Hungary we used Hungarian Advertising Association figures.


     2011 online share of all media ad spend (%)

          40
                 35.9%


          35


          30
                         28.9%
                                 27.9%
                                         27.9%


          25
                                                 24.9%
                                                         23.4%
                                                                 22.7%
      %


                                                                         21.7%
                                                                                 21.4%
                                                                                         20.6%


          20
                                                                                                 18.8%
                                                                                                         18.1%
                                                                                                                 17.1%
                                                                                                                         16.9%
                                                                                                                                 16.2%
                                                                                                                                         15.9%
                                                                                                                                                 15.9%
                                                                                                                                                         15.9%


          15
                                                                                                                                                                 15.2%
                                                                                                                                                                         15.0%
                                                                                                                                                                                 14.8%
                                                                                                                                                                                         14.2%
                                                                                                                                                                                                 13.9%
                                                                                                                                                                                                         13.8%
                                                                                                                                                                                                                 13.0%
                                                                                                                                                                                                                         13.0%


          10
                                                                                                                                                                                                                                 7.3%
                                                                                                                                                                                                                                        7.2%


           5
                                                                                                                                                                                                                                               6.8%


           0                s   k  y                y       y                                    y                         y
                UK Rep and ar rwa eden WE rope an ance gar enia gium CEE land land pain ssia Ital akia land garia rland rke oatia stria erbia ania eece
                              m                               v                   S Ru           lov Ire Bul itze
                   ch herl Den No Sw         Eu erm Fr Hun Slo Bel     Po Fin                                          Tu Cr Au S om Gr
                 e
               Cz Net                    tal   G                                               S
                                                                                                           Sw
                                                                                                                                          R
                                      To


10                                                                                                                                                                                                          IAB Europe AdEx Benchmark 2011
SECTION 1 - AdEx Benchmark 2011 Analysis


                                                                                                                                       26 MARKETS IN PERSPECTIVE


Online ad spend per capita – Scandinavian countries most mature in Europe

Using IHS population numbers, ad markets exhibit variation in online spend per capita across the region.


Online ad spend per capita is a metric that helps to evaluate the maturity and scope for development of a market. It shows how much an
online consumer is worth in terms of advertising in a given market. By use of population data, online ad spend per capita uses a normalised
basis and is therefore well-suited to compare and benchmark online advertising markets. It highlights the maturity of an online market ir-
respective of its size or absolute revenues incurred.


The most mature online markets in Europe in 2011 were the Scandinavian countries (Norway, Denmark, and Sweden) and the UK. Nor-
way led at €113.4 per capita indicating that advertisers have already embraced online across formats. On the other hand, monetisation in
Romania is still lagging behind as online ad spend per capita stood at a mere €1.0. The average online ad spend per capita in 2011 was
€33.5, below which value we find all high growth markets, such as Russia, Croatia and Serbia at €7.8, €6.0 and €1.7 per capita.

Online ad spend per capita in 2011
                                    €113.4


                              120
                                              €95.4
                                                       €87.8
 Online ad spend/capita (€)


                              100
                                                               €72.8
                                                                       €72.1


                               80
                                                                               €53.4
                                                                                       €48.4
                                                                                               €47.1


                               60
                                                                                                       €36.1
                                                                                                               €35.1
                                                                                                                       €34.1
                                                                                                                               €33.5
                                                                                                                                       €29.2
                                                                                                                                               €25.6


                               40
                                                                                                                                                       €20.5

                                                                                                                                                                 €19.5
                                                                                                                                                                         €15.6
                                                                                                                                                                                 €11.5
                                                                                                                                                                                         €10.8

                                                                                                                                                                                                 €8.8
                                                                                                                                                                                                        €8.2
                                                                                                                                                                                                               €7.8


                               20
                                                                                                                                                                                                                      €6.0
                                                                                                                                                                                                                             €4.9
                                                                                                                                                                                                                                    €4.1
                                                                                                                                                                                                                                           €1.7
                                                                                                                                                                                                                                                  €1.0


                               0
                                   ay  rk                        s        y                                      y                  y                        y
                                                      UK eden and rland an land ance stria gium Avg land Rep Ital pain enia land gar eece akia ssia oatia rke garia erbia ania
                                 rw ma                       rl                                                    S lov Po un Gr          v Ru          Tu Bul
                               No Den                              e
                                                       Sw the witz Ge
                                                                       rm Fin Fr    Au Bel ean     Ire ech           S        H        Slo        Cr               S om
                                                                                                                                                                      R
                                                         Ne S                              ro
                                                                                              p       Cz
                                                                                        Eu
Online ad spend per capita has grown persistently despite adverse external conditions or the state of all other media advertising since
2005. Whereas total ad spend per capita and TV ad spend per capita fell in 2009 (during the recession) and have yet to return to 2008
levels, online has consistently increased its ad spend per capita, steadily catching up to TV ad spend per capita. This points towards an
improved monetisation of online audiences over time.

Online ad spend per capita continues to grow despite total ad spend per capita decline
 Online ad spend/capita (€)


                          150

                          120

                              90

                              60

                              30

                               0
                                             2005                          2006                           2007                          2008                          2009                              2010                        2011
                                                                                                             Online                     TV                     Total Media


© IAB Europe                                                                                                                                                                                                                                             11
SECTION 1 - AdEx Benchmark 2011 Analysis


     SHARE OF FORMATS


     In 2011, paid-for-search remained the largest segment of online        Paid-for-search remains the largest segment
     advertising. Both paid-for-search and display formats increased
     their share of online advertising. Paid-for-search climbed from
                                                                                 100
     45.1% in 2010 to 46.5% in 2011. Display had a share of total on-                          20.9%                            19.3%
     line advertising of 33.4% in 2010 and managed to arrive at 33.6%            80
     in 2011. This was at the expense of Classifieds & Directories,
                                                                                 60            45.1%                            46.5%


                                                                             %
     whose share of the online ad pie diminished from 20.3% in 2010
                                                                                 40
     to 19.3% in 2011. Its share loss is due to the faster expansion of
     the other formats and an adverse economic environment to which              20            33.4%                            33.6%
     the category is particularly susceptible.
                                                                                   0
                                                                                               2010                             2011
                                                                                  Display   Paid-for-search      Classifieds & Directories    Other


         Share of formats by region


          Western Europe: share of formats in 2011                                              CEE: share of formats in 2011
                                0.7%                                                                             0.6%


                                                                                                              6.9%

                      20.9%
                                           32.0%

                                                                                                                             45.1%
                                                                                                    47.4%


                              46.3%


                       Display                                                                            Display
                       Paid-for-search                                                                    Paid-for-search
                       Classified & Directories                                                           Classified & Directories
                       Other                                                                              Other


     Paid-for-search dominated Western European online ad spend in 2011, accounting for 46.3% of the total. Display came second with
     32.0%.


     The Central and Eastern European online advertising market in aggregate is evenly divided among paid-for-search at 47.4% and display
     at 45.1%. Due to a strong Russian search market, making up 60.8% of the national online advertising total, the role of search across the
     region is positively skewed. Excluding Russia, display appears as the prominent format in the region at 50.0% as search is lagging behind
     in most markets at 36.3% on average.


12                                                                                                                      IAB Europe AdEx Benchmark 2011
Section 2 - Online advertising overview by sector


                                                                                                                      DISPLAY


Display surge persists in 2011


                                                                         YoY growth in European Display 2007-2011
•   Value: €7.03bn                                                            45
                                                                                    39.0%
•   Accounts for 33.6% of all online advertising spend                        40
•   YoY growth of 15.4%                                                       35
                                                                              30
•   Top five countries by value: Germany, UK, France, Italy,


                                                                          %
                                                                              25                                       21.3%
    Netherlands                                                               20                 15.1%                              15.4%
•   Top five by growth: Serbia, Croatia, Russia, Slovakia,                    15
                                                                              10
    Slovenia                                                                                               0.3%
                                                                               5
                                                                               0
                                                                                    2007       2008        2009        2010       2011


At 15.4% growth, display ad spend grew again double-digit in 2011, following 21.3% in 2010. This reinforced the strength of the format,
which even in an economically weaker 2011 managed to grow at similar levels to 2010, when it took advantage of an automatic rebound
in advertising investments after the 2008 and 2009 recession. Despite this growth however, display’s share of online ad spend remained
static at 33.6%, only 0.2% higher than in 2010.


There is a number of trends behind this development as advertisers are both increasing ad spend on branding campaigns, but also invest-
ing more in data-driven display advertising. Furthermore, online display advertising is increasingly benefitting from growth in pan-regional
ad spend. This approach is widespread in TV and online can leverage this as TV and online are increasingly booked in conjunction rather
than against each other.


Online branding campaigns

The increase in online branding campaigns of 2010 continued in 2011. This is apparent as more FMCG companies invested in online
display. In the UK, for instance, consumer goods constituted 14.8% of display spending, only second after financial services at 15.0%. In
2011, branding campaigns made up 42.3% of UK online display, up from 40% in 2010.This represents a 26.1% increase in online display
brand advertising versus 13.4% for total display.


Furthermore, online video, the online format that most resembles TV as an effective brand messenger, is also becoming more prominent.
In 2011, it made up 7.6% of European online display with two markets (UK, Germany) spending over €100 million on video ads.


Data-driven display

Display advertising growth was also driven by the application of so-called ‘big data’. Big data relies on the rich metrics received through
the online medium to plan display advertising. Using ad exchanges, real-time bidding and algorithmic trading, advertisers can reach both
broad and niche audiences that meet their exact criteria. These data-driven techniques can increase the cost-efficiency of online advertis-
ing, maximising cheaper, remnant inventory to reach consumers.


© IAB Europe                                                                                                                                   13
Section 2 - Online advertising overview by sector


     DISPLAY


     Top 10: Display value by country 2011 and 2010 (€m)

        Germany                                                                                                                      €1,379m
              UK
                                                                                                                               €1,299m
          France
                                                                        €636m
             Italy
                                                                    €556m
     Netherlands
                                                            €468m
          Russia                                                                                                             2011
                                                          €439m
           Spain                                                                                                             2010
                                                        €402m
         Sweden
                                          €242m
          Poland
                                    €198m
         Norway
                                    €198m
                                                            500                                  1000                                       1500


     Rest of Europe: Display value by country 2011 and 2010 (€m)

       Denmark                                                                                                                        €186m
          Turkey                                                                                                             €170m
     Switzerland                                                                                              €151m
     Czech Rep                                                                                           €142m
         Austria                                                                    €106m
        Belgium                                                                     €105m
         Finland                                                                  €102m
       Hungary                                            €55m
          Ireland                                      €52m
         Greece                            €36m                                                                              2011
       Slovenia                    €25m
        Slovakia                   €24m                                                                                      2010
       Romania                   €20m
        Bulgaria               €16m
         Croatia             €14m
           Serbia      €7m
                                                  50                        100                            150                              200


         Advertising beyond the banner: Advertisers are experi-                    Branding is the big trend and a key for digital evolu-
         menting with long form storytelling on the web enabling                   tion! More than any other approach in online marketing,
         them to better connect with consumers, and to deliver                     branding will truly revolutionize digital advertising. While
         their brand goals. Richer creative canvases, multi-screen                 performance goals are still working fine in their seg-
         touch points, and branding metrics to prove success,                      ments, only branding has the strength to pave the way
         along with the power of consumers acting as re-circula-                   for the big advertisers to use the internet for mass reach
         tors of brands’ communications are all fuelling growth in                 campaigns as in TV or print. Even further than in classic
         this area. Premium brand advertising is finding a home                    media, the vast opportunities digital media has to offer
         on the web.                                                               such as targeting and data, will take campaign plan-
                                                                                   ning as well as efficiency to a whole new level. Many big
         Laura Chaibi, Research Director EMEA, Yahoo!                              brands are starting to make online their home already -
                                                                                   the others will follow without a doubt.


                                                                                   Stephan Nöller, CEO, nugg.ad


14                                                                                                                       IAB Europe AdEx Benchmark 2011
Section 2 - Online advertising overview by sector


                                                                                                                          DISPLAY


Display value and growth

1,600                                                                                                                              60%


1,400
                                                                                                                                   50%

1,200
                                                                                                                                   40%
1,000

                                                                                                                                   30%
   800


   600                                                                                                                             20%

   400
                                                                                                                                   10%
   200


              Ge      U F    It   N R S       S   P    N D Tu S          C A     B F        H Ir     G S      S    R B C S            0%
                    rm K ranc aly eth uss pain wed olan orw enm rke witz zec ustr elgi inlan ung elan ree love lova om ulga roa erbi
                                     er ia        en d ay ar y          er h R ia um d ar d              ce n         an        tia a
                      an
                         y
                             e         lan                      k         lan e                  y             ia kia    ia ria
                                           ds                                d p
                                                     Value (€m)            YoY Growth (%)

Top 10: 2011 YoY Display growth by country

  Serbia
  Croatia
  Russia
Slovakia
Slovenia
  Ireland
 Greece
  Turkey
   Spain
  Austria
             0                      10                20                     30                   40             50                60
                                                                       %


Rest of Europe: 2011 YoY Display growth by country

      Finland
            Italy
    Germany
     Poland
     France
             UK
 Netherlands
   Denmark
 Switzerland
  Czech Rep
    Sweden
     Belgium
    Bulgaria
    Romania
     Norway
    Hungary
                    0           2           4          6           8              10         12         14        16         18            20
                                                                            %


© IAB Europe                                                                                                                                    15
Section 2 - Online advertising overview by sector


     CLASSIFIEDS & DIRECTORIES


                                         1
     Classifieds & Directories ad spend increased despite shaky economy

     •   Value: €4.03bn
     •   Accounts for 19.3% of all online advertising spend
     •   YoY growth of 5.7%
     •   Top five countries by value: UK, France, Germany, Norway, Italy
     •   Top five by growth: Slovakia, Poland, Serbia, Hungary, Spain


     Classifieds & Directories grew 5.7% in 2011, less than the format’s 7.5% increase in 2010. This is due to the weakening of the European
     economy. Classifieds & Directories advertising is dominated by the job, real estate, and automotive sectors. The adverse macroeconomic
     conditions with struggling job, real estate, and automotive markets, generated more caution among advertisers when investing in Clas-
     sifieds & Directories ads.


     Top 10: Classifieds & Directories value by country 2011 and 2010 (€m)

              UK                                                                                                                           €905m

          France                                                                                                      €739m

         Germany                                                                                                  €712m

          Norway                                     €243m

             Italy                                 €239m

     Netherlands                                €202m
                                                                                                                                          2011
         Sweden                                 €201m
                                                                                                                                          2010
      Switzerland                       €143m

         Belgium                     €120m

         Denmark                     €113m

                                          200                        400                       600                        800                      1,000


     1. Classifieds & Directories ad spend is available for 25 countries. Russia has not been included in this category on instructions by IAB Russia.


16                                                                                                                            IAB Europe AdEx Benchmark 2011
Section 2 - Online advertising overview by sector


                                                            CLASSIFIEDS & DIRECTORIES


Rest of Europe: Classifieds & Directories value by country 2011 and 2010 (€m)


     Poland                                                                                                       €81m

     Finland                                                                                                      €81m

     Austria                                                                                        €68m

       Spain                                                                                 €64m

      Turkey                                       €29m

      Ireland                                  €26m

Czech Rep                                      €25m                                                                    2011
    Hungary                          €17m                                                                              2010
    Slovakia                 €7m
     Croatia           €5m

     Greece            €5m

    Bulgaria       €3m

    Slovenia     €1m

      Serbia    €1m

   Romania      €0.2m


                             10      20          30          40          50           60         70          80           90


Classifieds & Directories value and growth

1,000                                                                                                                    40%

   900                                                                                                                   30%

   800                                                                                                                   20%

   700
                                                                                                                         10%
   600
                                                                                                                          0%
   500
                                                                                                                         -10%
   400
                                                                                                                         -20%
   300
                                                                                                                         -30%
   200
                                                                                                                         -40%
   100

      0                                                                                                                  -50%
                 e  y  y      y    s     n         k           a   n    y           y   a    a   e    a   a   a    a
          UK anc an rwa Ital and de land gium ar land land stri pai rke land Rep gar aki oati eec gari eni rbi ani
            F r erm o
                    N           rl we zer el enm Po Fin Au
                               e S      it B D
                                                                 S Tu Ire ch un lov Cr Gr
                                                                                   S              ul lov Se om
                                                                                                 B S
                G           th                                               e H                            R
                         Ne          Sw                                   Cz
                                               Value (€m)       YoY growth (%)


© IAB Europe                                                                                                                      17
Section 2 - Online advertising overview by sector


     CLASSIFIEDS & DIRECTORIES


     Top 10: 2011 YoY Classifieds & Directories growth by country


        Slovakia

         Poland

         Serbia

       Hungary

          Spain

         Croatia

         Turkey

     Switzerland

            Italy

         Greece


                    0         5              10          %   15         20         25       30                 35


     Rest of Europe: 2011 YoY Classifieds & Directories growth by country


         Finland
        Sweden
        Belgium
     Netherlands
             UK
        Slovenia
       Germany
         Norway
         Austria
         France
       Denmark
          Ireland
        Bulgaria
      Czech Rep
        Romania

                    -50           -40             -30             -20        -10        0                      10
                                                             %


18                                                                                      IAB Europe AdEx Benchmark 2011
Section 2 - Online advertising overview by sector


                                                                                              PAID-FOR-SEARCH


Paid-for-search reclaims status as fastest-                              YoY growth in European Search 2007-2011
growing segment
                                                                              45
                                                                                   39.0%
•   Value: €9.72bn                                                            40                   36.0%
                                                                              35
•   Accounts for 46.5% of all online advertising spend
                                                                              30
•   YoY growth of 17.9%


                                                                          %
                                                                              25
                                                                                                                                       17.9%
                                                                              20                                       16.1%
•   Top five countries by value: UK, Germany, France, Russia,
                                                                              15
    and Netherlands
                                                                              10
                                                                                                           10.8%
•   Top five countries by growth: Romania, Slovenia, Russia,                   5
    Croatia, and Poland                                                        0
                                                                                       2007     2008       2009        2010           2011


In 2011, paid-for-search reclaimed its status as fastest growing segment of online advertising after display growth outperformed search in
2010. It was the sole online format which experienced growth acceleration at 17.9% in 2011, up from 16.1% in 2010. Amounting to €9.72
billion, paid-for-search accounted for 46.5% of total online advertising in 2011 and remains the biggest part of online advertising spend.


Paid-for-search has seen robust growth in many emerging markets with nine countries experiencing growth above 30% year-on-year. Ro-
mania, Slovenia, and Russia increased the size of their search market by over half of its value in 2010 at 69.9%, 66.7%, and 62.6% growth.
This is because CEE markets, with the exception of Russia, are generally display-driven and had been lagging behind in development for
the paid-for-search format.


Paid-for-search growth is still strong in mature markets with all but one country experiencing double-digit growth. This confirms the success
of the format’s return-on-investment propositions. It is also indicative of innovation in search. Paid-for-search has expanded into video and
location-based services and is also used in cross-media campaigns.


Top 10 : Search value by country 2011 and 2010 (€m)

          UK                                                                                                                  €3,187m
    Germany                                                                     €1,868m
      France                                        €913m
      Russia                                                                                                                   2011
                                            €681m
Netherlands                         €530m                                                                                      2010

       Spain                    €460m
         Italy                €448m
    Sweden            €233m
    Denmark           €223m
      Poland         €159m
                              500              1,000          1,500            2,000            2,500              3,000              3,500


© IAB Europe                                                                                                                                    19
Section 2 - Online advertising overview by sector


     PAID-FOR-SEARCH


     Rest of Europe: Search value by country 2011 and 2010 (€m)


         Turkey                                                                                                                  €152m
        Belgium                                                                                                          €140m
     Switzerland
                                                                                                           €129m
         Austria                                                                                       €122m
        Norway                                                                                   €118m
     Czech Rep                                                                           €102m
         Finland                                                   €72m
         Greece                                              €60                                                             2011
         Ireland                                       €54                                                                   2010
       Hungary                            €35
        Slovakia               €13
        Bulgaria           €11
         Croatia          €7
        Slovenia        €5
         Serbia    €2
       Romania     €1

                                     20    40            60           80           100           120               140              160


     Search Value and growth 2011


                                                                                                                                     80%
     3,500

                                                                                                                                     70%
     3,000
                                                                                                                                     60%

     2,500
                                                                                                                                     50%


     2,000                                                                                                                           40%


                                                                                                                                     30%
     1,500

                                                                                                                                     20%
     1,000
                                                                                                                                     10%

       500
                                                                                                                                     0%


          0                                                                                                                          -10%
                     y  e      a  s n  y  n   k        y            a    y           e        y   a    a    a   a   a    a
              UK an anc ssi nd pai Ital de ar land rke ium land stri rwa Rep land eec land gar aki gari oati eni rbi ani
                   m Fr Ru rla S                         g
                                       we enm Po Tu Bel itzer Au No ech Fin Gr Ire Hun Slov Bul Cr Slov Se om
                er              e     S D
              G              th                                                                                   R
                          Ne                             Sw           Cz
                                              Value (€m)       YoY growth (%)


20                                                                                                             IAB Europe AdEx Benchmark 2011
Section 2 - Online advertising overview by sector


                                                                               PAID-FOR-SEARCH


Top 10: 2011 YoY search growth by country


Romania

Slovenia

  Russia

 Croatia

  Poland

  Serbia

Bulgaria

Hungary

  Turkey

Sweden


           0          10       20           30                40         50              60         70           80
                                                          %


Rest of Europe: 2011 YoY search growth by country


 Switzerland
   Denmark
    Slovakia
     Greece
 Czech Rep
         Italy
           UK
      Ireland
Netherlands
    Belgium
     Norway
      Austria
   Germany
       Spain
      France
     Finland

                 -5        0        5                10            15               20            25             30
                                                 %


© IAB Europe                                                                                                                21
Section 2 - Online advertising overview by sector


     MOBILE


     Mobile still a nascent medium                                                                                                  Mobile display as a share of online display in 2011

     While mobile advertising is still a nascent medium, it is becom-                                                                   6
     ing increasingly prominent in campaigns. The IAB Europe AdEx                                                                       5


                                                                                                                                             €5.3%
     Benchmark 2011 study received mobile display advertising


                                                                                                                                                      5.2%
                                                                                                                                        4
     ad spend from 14 markets. In 2011, mobile display advertising


                                                                                                                                    %
                                                                                                                                        3
     ranged from €0.1 million in Serbia to €69.1 million in the UK, with


                                                                                                                                                                3.7%
                                                                                                                                                                          3.6%
     mature markets investing more in mobile display than the CEE                                                                       2


                                                                                                                                                                                        3.6%


                                                                                                                                                                                                                                                  0.7%

                                                                                                                                                                                                                                                           0.7%

                                                                                                                                                                                                                                                                     0.5%
                                                                                                                                                                                                  2.3%

                                                                                                                                                                                                           2.2%
                                                                                                                                                                                                                   2.2%

                                                                                                                                                                                                                          1.8%

                                                                                                                                                                                                                                   1.7%
                                                                                                                                                                                                                                          1.5%
     region. Although these figures are still comparatively small, mo-                                                                  1
     bile display has been increasing rapidly as a share of total display,                                                              0
                                                                                                                                                   e   n    y   y    k  s   n   y y    a    a
     reaching values that range from 0.5% in the Czech Republic to                                                                           UK anc pai Ital rwa ar and de rke gar stri erbi land Rep
                                                                                                                                                                  m l     e Tu un
                                                                                                                                               Fr    S
                                                                                                                                                           No Den ther Sw      H  Au S Po ech
     5.3% in the UK.                                                                                                                                              Ne                          Cz


     A small number of markets also supplied data for search and mes-
     saging. In the UK mobile search advertising amounted to €154.3
                                                                                                                                    Smartphone penetration in Europe 2005-2016
     million. Messaging was reported in Italy at €5.8m and Turkey at
     €9.3 million.
                                                                                                                                        80
                                                                                                                                        70
     Mobile display advertising growth surged in 2011 as mobile in-                                                                     60
     creasingly becomes a staple item in media plans. Growing organi-                                                                   50
                                                                                                                                    %


     cally from a low basis, rising smartphone penetration, increased                                                                   40
                                                                                                                                        30
     data traffic and proliferation of the advertising ecosystem are key
                                                                                                                                        20
     factors behind this development. For instance, in 2011 mobile
                                                                                                                                        10
     display advertising grew by 124.0% in the UK and by 178.2% in                                                                      0
                                                                                                                                                                                                                  2011


                                                                                                                                                                                                                                           2014

                                                                                                                                                                                                                                                    2015

                                                                                                                                                                                                                                                              2016
                                                                                                                                               2005

                                                                                                                                                         2006

                                                                                                                                                                   2007

                                                                                                                                                                                 2008

                                                                                                                                                                                               2009

                                                                                                                                                                                                         2010


                                                                                                                                                                                                                                   2013
                                                                                                                                                                                                                          2012


     Sweden.

                                                                                                                                                                                                                                 Source: IHS Screen Digest
     This trend is set to continue as the addressable market for mobile
     advertising grows over time. As IHS Screen Digest data suggests,
     smartphone penetration in Europe reached 31.0% in 2011 and is
                                                                                                                                        Looking at our ad network from the global perspective,
     expected to grow to 77% by 2016.
                                                                                                                                        it’s clear that Android and iOS are by an immense dis-
                                                                                                                                        tance the two dominant platforms. Between them they
     Mobile display ad spend in 2011 (€m)
                                                                                                                                        account for 83% of all mobile ad activity worldwide, with
          80
          70                                                                                                                            45% accounted for by iOS. The IAB’s data for mobile
               €69.1m


          60                                                                                                                            advertising spend is very consistent with our regional
                        €33.0m


          50                                                                                                                            reach figures, showing that, when we compare value and
     €m


          40
                                 €19.9m


                                                                                                                                        spend with sufficiently large sample sizes, correlations
                                          €14.9m


          30
                                                   €10.4m


                                                                                                                                        emerge that enable us to draw meaningful insights.
                                                            €7.0m

                                                                    €5.3m
                                                                            €4.3m
                                                                                    €3.0m

                                                                                            €1.6m


          20
                                                                                                    €1.4m
                                                                                                            €0.9m

                                                                                                                    €0.7m

                                                                                                                            €0.1m


          10
                                                                                                                                        Paul Childs, CMO, Adfonic
          0          e    y        s   y  n  k   y    a        y        a
               UK anc Ital pain and rwa de ar rke stri land gar Rep erbi
                 Fr        S erl No we enm Tu Au Po un ch S
                              th      S D                H ze
                            Ne                              C


22                                                                                                                                                                                                                        IAB Europe AdEx Benchmark 2011
Section 2 - Online advertising overview by sector


                                                                                                                                                                                                                                         VIDEO


Video now accounts for 7.6% of online display                                                                                                                          provides further opportunity for online video advertising as the ad-
                                                                                                                                                                       dressable market in time spend, user base and available content
AdEx Benchmark 2011 includes online video advertising figures                                                                                                          grows further.
for 15 markets. On average, video represents 7.6% of the total
online Display market value. It ranges from its highest at 9.8% in                                                                                                     Both Western Europe and the CEE region are benefitting from
Sweden to 0.6% in Hungary. In Germany and the UK, video has                                                                                                            the increase in online video advertising. In 2011, online video ad-
already crossed the €100 million threshold. In the UK the market                                                                                                       vertising grew irrespective of geography. The UK saw the highest
is worth € 125.5m; in Germany €117.4 million.                                                                                                                          increase of 132.9%, while Sweden grew by 54.2%. CEE countries
                                                                                                                                                                       were not behind in this trend, with the Czech Republic expanding
                                                                                                                                                                       94.1% in its online video advertising spend and Poland growing
Total video ad spend (€m)
                                                                                                                                                                       46.4% year-on-year.

150
                                                                                                                                                                       Online video consumption: Big Five markets
120
         €125.5m
                   €117.4m


                                                                                                                                                                                          25
  90
                                                                                                                                                                                          20
                             €35.3m


                                                                                                                                                                       Hours (billions)
                                       €23.8m


  60
                                                 €21.1m


                                                                                                                                                                                          15
                                                           €11.6m
                                                                     €11.1m
                                                                                €10.3m
                                                                                           €8.4m

                                                                                                          €4.3m
                                                                                                                     €3.4m
                                                                                                                                €2.2m
                                                                                                                                           €1.4m

                                                                                                                                                      €0.4m
                                                                                                                                                              €0.2m


  30
                                                                                                                                                                                          10

     0                                                                                                                                                                                    5
               y   s n n          y   y             a  k a     y a
         UK an and de pai land rke rwa Rep land stri ar aki gar ani
                    e S o Tu o h Ire
            m l
          er ther Sw     P       N ze c       Au enm Slov Hun om
         G e                                     D           R                                                                                                                            0
           N                        C                                                                                                                                                        05 06 07 08 09 10 11 12 13 14 15 16
                                                                                                                                                                                           20 20 20 20 20 20 20 20 20 20 20 20
                                                                                                                                                                                               FTV long-form TV     FTV short-form TV      UGC
                                                                                                                                                                                               FTV short-form TV    Transactional TV
Video as a share of online display                                                                                                                                                                                              Source:IHS Screen Digest


  10
           9.8%
                   9.7%


                                                                                                                                                                                          There are two factors influencing the evolution and
                             8.5%


     8                                                                                                                                                                                    growth of video advertising at the moment: the first is
                                      8.3%
                                                7.6%
                                                          7.5%


                                                                                                                                                                                          the advent of mobile and connected TV - the devices
                                                                    6.5%


     6
 %


                                                                              5.9%
                                                                                         5.8%
                                                                                                   5.8%


                                                                                                                                                                                          via which the content is being accessed. The other is
                                                                                                                  5.3%
                                                                                                                         5.2%


     4
                                                                                                                                                                                          the nature of the content itself. One factor which drives
                                                                                                                                               1.2%
                                                                                                                                                       1.2%
                                                                                                                                    3.2%


                                                                                                                                                                                          online video consumption is technical developments.
                                                                                                                                                                0.6%


     2
                                                                                                                                                                                          This includes the increasing ubiquity of connected TVs
     0
        n K     y d g s y p ia d in y ia rk ia ry                                                                                                                                         as well as the mobile communication standard LTE and
      de U man elan Av land urke Re vak olan pa rwa ustr ma an nga
   Swe     er Ir ean ther T ech Slo P       S o A en om u
                                               N
          G                                          D    R H                                                                                                                             its rapidly increasing coverage. The biggest growth for
                 op e       Cz
              Eur N
                                                                                                                                                                                          video advertising with additional emphasis on content

Online video consumption continues to increase, and according                                                                                                                             will lie outside of traditional TV broadcasting. We’re see-

to IHS Screen Digest forecasts it will surpass 20 billion hours a                                                                                                                         ing a huge spike in gaming, music and social apps.

year by 2015 across the online population in the European Big
     1
Five . This increase is primarily driven by rising consumption of                                                                                                                         Roland Schaber, COO of smartclip, the multiscreen and

free-to-view (FTV) TV and user-generated content (UGC). This                                                                                                                              brand advertising platform of Adconion Media Group


1. This includes the UK, France, Germany, Italy, and Spain.


© IAB Europe                                                                                                                                                                                                                                               23
Section 3 - Overview by country


     WESTERN EUROPE


     Western Europe

     UK                                                                                              Germany

     Crossing the €5 billion mark for the first time, the UK’s online ad-                            The second largest market in the AdEx Benchmark, Germany has

     vertising ad spend is still the largest in Europe and accounts for                              the most valuable display sector in Europe at €1.38 billion after

     26% of the total in the AdEx Benchmark. Paid-for-search is the                                  growing at a strong 15.0%. Paid-for-search remains the domi-

     dominant category contributing 58% to total online advertising                                  nant format in Germany at 47.2%, accounting for €1.87 billion of

     spend. The UK online advertising market grew by 14.4%, in 2011,                                 the €3.96 billion German online ad spend. Germany maintained

     keeping in line with overall European online advertising market                                 double-digit growth at 11.0% fuelled by a booming display sector.

     growth of 14.5%. The UK online advertising market also has the
     highest share of all media advertising in Europe, at 35.9%.                                      2011 Online Ad Spend                                                           €3,959m
                                                                                                      2011 YoY growth                                                                 11.0%

      2011 Online Ad Spend                                                       €5,510m              Online as a proportion of total media ad spend                                  21.4%

      2011 YoY growth                                                             14.4%               Online ad spend per capita                                                       €48.4

      Online as a proportion of total media ad spend                              35.9%
      Online ad spend per capita                                                    €87.8


     Spend by format and by country: Western Europe (€m)

               6,000


               5,000


               4,000


               3,000


               2,000


               1,000


                    0
                          UK


                                     Germany


                                                France


                                                          Italy


                                                                   Netherlands


                                                                                  Spain


                                                                                            Sweden


                                                                                                      Norway


                                                                                                               Denmark


                                                                                                                         Switzerland


                                                                                                                                       Belgium


                                                                                                                                                     Austria


                                                                                                                                                                 Finland


                                                                                                                                                                           Ireland


                                                                                                                                                                                      Greece


      Display       1,299      1,379           636       556      468            402        242       198      186       151           105       106             102       52          36
      Classifieds       905    712             739       239      202             64        201       243      113       143           120       68              81        26          5
      Search        3,187      1,868           913       448      530            460        233       118      223       129           140       122             72        54          60
      Other             119      -              -        6         -              -         11          -         2             -      -         -               -         -           -


24                                                                                                                                                             IAB Europe AdEx Benchmark 2011
Section 3 - Overview by country


                                                                                         WESTERN EUROPE


France                                                                 Netherlands

Europe’s third largest online advertising market grew slower than      The Netherlands slipped back into fifth position in 2011, overtaken
the two strongest online ad markets in 2011 at 8.8%. This is due       by Italy at €1.20 billion in online ad spend. The Dutch market grew
to the strength of the Classifieds & Directories segment at 32%        12.6% year-on-year, slightly slower than in 2010 (13.8%). With on-
online share in France, which in an adverse economic environ-          line accounting for 27.9% of total ad spend and online ad spend
ment increased only 3.5% in 2011, stunting the French online           capita of €72.1, the Netherlands is one of the most mature online
ad market with otherwise healthy-growing display and paid-for-         advertising market in Europe.
search formats at 13.6% and 10.0%, respectively. France’s online
market share of total ad spend increased from 19.8% in 2010 to          2011 Online Ad Spend                                      €1,200m
21.3% in 2011 in line with the European average of 21.7%.               2011 YoY growth                                             12.6%
                                                                        Online as a proportion of total media ad spend              27.9%
                                                                        Online ad spend per capita                                   €72.1
 2011 Online Ad Spend                                    €2,287m
 2011 YoY growth                                             8.8%
 Online as a proportion of total media ad spend             21.3%
                                                                       Spain
 Online ad spend per capita                                 €36.1
                                                                       Spain is the seventh largest online market, overtaken by a fast-
                                                                       growing Russia in 2011. It saw a growth of 13.3% mostly driven
Italy                                                                  by a surging display segment. With 15.9% market share and on-

In 2011, Italy overtook the Netherlands to reclaim its position as     line ad spend capita of €19.5, it is still a relatively nascent market

the fourth largest online advertising market at €1.25 billion. Apart   indicating room for future growth of online ad spend.

from Greece, which generally exhibits CEE characteristics (such
                                                                        2011 Online Ad Spend                                        €925m
as fast growth), Italy was the fastest growing online market in
                                                                        2011 YoY growth                                             13.3%
Western Europe at 15.5%. This was driven by strong surges in
                                                                        Online as a proportion of total media ad spend              15.9%
both Paid-for-search at 17.9% and Display at 16.3% year-on-year
                                                                        Online ad spend per capita                                   €19.5
growth. Display remains the largest segment in the Italian online
advertising market at 44.5% share, in 2011.
                                                                       Sweden

 2011 Online Ad Spend                                    €1,249m       At €687 million, Swedish online advertising spend topped the
 2011 YoY growth                                            15.5%      Scandinavian region in 2011. It grew 14.1%, fuelled by a surg-
 Online as a proportion of total media ad spend             15.2%      ing search market. Increasing by 27.5%, paid-for-search now ac-
 Online ad spend per capita                                 €20.5      counts for 34.0% of all online ad spend, however display remains
                                                                       Sweden’s largest format at 35.2%. Sweden is one of Europe’s
                                                                       most mature online market at 23.4% online share of total media
                                                                       ad spend and online ad spend per capita of €72.8.


                                                                        2011 Online Ad Spend                                        €687m
                                                                        2011 YoY growth                                             14.1%
                                                                        Online as a proportion of total media ad spend              23.4%
                                                                        Online ad spend per capita                                   €72.8


© IAB Europe                                                                                                                                    25
Section 3 - Overview by country


     WESTERN EUROPE


     Norway
                                                                         Belgium
     Norway is Europe’s most mature market with an online ad spend
     per capita value of €113.4 and hence it is not surprising that it   Belgium experienced modest growth in 2011 at 9.9%. Paid-for-

     experienced relatively weak growth of 5.5% in 2011. It has the      search remains the dominant format of the €365 million market,

     strongest Classifieds & Directories market in Europe at 43.5%       accounting for 38.3% of online ad spend.

     of total online. Display is also strong at 35.4% share of online,
     boosted by increased investment in video, which amounted to          2011 Online Ad Spend                                          €365m
     €10.3 million in 2011.                                               2011 YoY growth                                                 9.9%
                                                                          Online as a proportion of total media ad spend                 17.1%
                                                                          Online ad spend per capita                                     €34.1
      2011 Online Ad Spend                                   €558m
      2011 YoY growth                                          5.5%
      Online as a proportion of total media ad spend          24.9%      Austria
      Online ad spend per capita                             €113.4
                                                                         Austrian online ad spend grew 11.3% in 2011, driven by strong
                                                                         display growth of 16.6%, particularly in online video. Austria is still
                                                                         a nascent market at 13.0% online share of total media ad spend
     Denmark
                                                                         and online ad spend per capita of €35.1.
     Similarly to Norway, Denmark is one of Europe’s most mature
     markets at 27.9% online share of total advertising and €95.4 on-     2011 Online Ad Spend                                          €296m
     line ad spend per capita. The Danish market grew 15.1% in 2011       2011 YoY growth                                                11.3%
     to €524 million.                                                     Online as a proportion of total media ad spend                 13.0%
                                                                          Online ad spend per capita                                     €35.1

      2011 Online Ad Spend                                   €524m
      2011 YoY growth                                         15.1%
                                                                         Finland
      Online as a proportion of total media ad spend          27.9%
      Online ad spend per capita                               €95.4     The Finnish online market reached €254 million in ad spend in
                                                                         2011, following growth of 7.9%. It is one of the largest display
                                                                         markets in Europe in terms of proportion with 40.0% of online ad
     Switzerland                                                         spend invested in display.
     Switzerland continued to see strong growth in 2011 at 15.2%,
     above the 14.5% European average. It is still an emerging online
                                                                          2011 Online Ad Spend                                          €254m
     market at 13.9% online share of total media ad spend. In 2011,       2011 YoY growth                                                 7.9%
     the Swiss market surpassed Belgium in terms of online ad spend       Online as a proportion of total media ad spend                 15.9%
     at €422 million, the largest part of which was display at 35.7%      Online ad spend per capita                                     €47.1
     online share.


     2011 Online Ad Spend                                   €422m
     2011 YoY growth                                         15.2%
     Online as a proportion of total media ad spend          13.9%
     Online ad spend per capita                               €53.4


26                                                                                                                  IAB Europe AdEx Benchmark 2011
Section 3 - Overview by country


                                                                                           WESTERN EUROPE


Ireland

For a second year in a row, Ireland had the fastest growing display          The integration of pan regional digital and TV brand cam-
sector in Western Europe (21.7% year-on-year). At 14.8% online               paigns is on the up. The industry has generally believed
share of total media spend and €29.2 online ad spend per capita,             pan regional TV spend would diminish with the phenom-
Ireland still has room for growth.                                           enal growth of online. By comparison, we are increas-
                                                                             ingly seeing clients who want to take advantage of the
 2011 Online Ad Spend                                     €132m              reach available by combining both TV and online. The
 2011 YoY growth                                           14.2%             same applies when considering video and mobile. Whilst
 Online as a proportion of total media ad spend            14.8%             still relatively nascent, pan regional video advertising is
 Online ad spend per capita                                 €29.2            on the up. As new technologies, including responsive
                                                                             design come to market, we expect the trend to continue.
                                                                             The UK remains the powerhouse of pan regional ad
Greece
                                                                             spend, although more and more we are experiencing
Western Europe’s smallest online advertising market was also the
                                                                             increased digital spend from markets such as France,
region’s fastest in growth at 19.7%. For the first time, Greece re-
                                                                             Germany and Switzerland as the luxury sector experi-
ported triple-digit ad spend in online at just over €100 million in
                                                                             ences rapid growth.
2011.

                                                                             Tom Bowman, VP Strategy, Solutions and Sales
 2011 Online Ad Spend                                     €100m              Operations, BBC Advertising
 2011 YoY growth                                           19.7%
 Online as a proportion of total media ad spend             6.8%
 Online ad spend per capita                                  €8.8


    UK online ad revenues broke through 5bn Euros in 2011 - accounting for nearly 30% of total advertising – powered by strong
    performances in video, social and mobile. British consumers are now spending 40% of their internet time on entertainment and
    social sites, and this is reflected in the strong performance from packaged goods advertisers, who now represent nearly 15% of
    total display spend. In the tough economic climate marketers were looking for accountability, and paid search duly rose by an
    impressive 17.5% to pass the 3bn Euro mark. We expect these trends in brand and direct response growth to continue in 2012,
    despite the challenging conditions. Arguably the most mature market in Europe, it’s pleasing to see that the UK’s contribution
    helped boost online’s share across Europe to hit the magic 20% figure.


    Guy Phillipson, CEO, IAB UK


© IAB Europe                                                                                                                               27
Section 3 - Overview by country


     CENTRAL & EASTERN EUROPE


     Central Eastern Europe

     Russia                                                                               Poland

     In 2011, Russia crossed the €1 billion mark to replace Spain as                      Poland was the second largest CEE online advertising market
     the sixth largest online advertising market. It grew the fastest at a                at €439 million in 2011. It experienced strong growth of 23.1%,
     55.5% propelled by a surging search market of 62.6%. However,                        boosted by paid-for-search, which increased 36.9% year-on-year.
     Russia is not only a strong paid-for-search market; it was also the                  Poland is still however dominated by the display sector which ac-
     third fastest growing country in the display segment. High in vol-                   counts for 45.2% of its total online ad spend.
     ume and growth, Russia is still an emerging market at €7.8 online
     ad spend per capita, indicating further potential for growth.                         2011 Online Ad Spend                                                             €439m
                                                                                           2011 YoY growth                                                                  23.1%
                                                                                           Online as a proportion of total media ad spend                                   16.2%
                                                                                           Online ad spend per capita                                                       €11.5
      2011 Online Ad Spend                                                 €1,121m
      2011 YoY growth                                                       55.5%
      Online as a proportion of total media ad spend                        15.9%
      Online ad spend per capita                                              €7.8


     Spend by format and by country: Central and Eastern Europe (€m)


                1,200


                1,000


                 800


                 600


                 400


                 200


                    0
                             Russia


                                           Poland


                                                     Turkey


                                                               Czech Rep


                                                                                Hungary


                                                                                           Slovakia


                                                                                                      Slovenia


                                                                                                                 Bulgaria


                                                                                                                                Croatia


                                                                                                                                                    Romania


                                                                                                                                                                   Serbia


      Display           439           198           170       142               55         24            25           16                  14                  20   7
      Classifieds        -            81            29        25                17            7            1                3             5                   -    1
      Search            681           159           152       102               35         13              5          11                  7                   1    2
      Other              -             -            9          -                2             -             -               1             -                   -    3


28                                                                                                                                             IAB Europe AdEx Benchmark 2011
Section 3 - Overview by country


                                                                  CENTRAL & EASTERN EUROPE


Turkey                                                                  Slovakia

Turkey saw strong growth across all sectors resulting in an overall     After a small decline in 2009 and a 10% growth rate in 2010, Slo-
increase of 22.4%. The Turkish online market is still dominated         vakia is a booming online advertising market, expanding 29.7%
by display, which accounts for 47.2% of total online ad spend,          in 2011. This growth was largely driven by the display sector
although paid-for-search is catching up at 42.1% share of online.       which grew 31.6% and accounts for 53.9% of Slovakian online
                                                                        ad spend.
 2011 Online Ad Spend                                       €360m
 2011 YoY growth                                            22.4%        2011 Online Ad Spend                                       €45m
 Online as a proportion of total media ad spend             13.8%        2011 YoY growth                                           29.7%
 Online ad spend per capita                                      €4.9    Online as a proportion of total media ad spend            15.0%
                                                                         Online ad spend per capita                                  €8.2


Czech Republic

Czech Republic is CEE’s most mature market at €25.6 online ad           Slovenia
spend per capita. The majority of Czech Republic’s €269 million is      2011 was a good year for the Slovenian online advertising market,
display advertising. Although it grew slower than paid-for-search       which experienced 31.1% growth. Slovenia is the most display-
in 2011, it still accounts for 52.9% of total online ad spend.          heavy market in Europe with display accounting for 80.3% of total
                                                                        online advertising.

 2011 Online Ad Spend                                       €269m
 2011 YoY growth                                            10.7%        2011 Online Ad Spend                                       €32m
 Online as a proportion of total media ad spend             28.9%        2011 YoY growth                                           31.1%
 Online ad spend per capita                                  €25.6       Online as a proportion of total media ad spend            18.1%
                                                                         Online ad spend per capita                                 €15.6


Hungary

In 2011, Hungary experienced 12.8% growth, relatively slow for          Bulgaria
the CEE region. After the Czech Republic, it is the second most         An emerging market with a mere €4.1 in online ad spend per cap-
mature market at 18.8% online share of total media spend and            ita, Bulgaria is seeing an acceleration in its growth in online ad-
online ad spend per capita of €10.8. Hungary’s online advertising       vertising. In 2011, the Bulgarian online market increased 13.5%,
market is dominated by display which accounts for 50.5% of total        almost twice as fast as in 2010. Similar to the rest of the CEE
online ad spend.                                                        region, the majority of Bulgarian online ad spend is display adver-
                                                                        tising, accounting for 51.8% of the total.

 2011 Online Ad Spend                                       €108m
 2011 YoY growth                                            12.8%
                                                                         2011 Online Ad Spend                                       €30m
 Online as a proportion of total media ad spend             18.8%
                                                                         2011 YoY growth                                           13.5%
 Online ad spend per capita                                  €10.8
                                                                         Online as a proportion of total media ad spend            14.2%
                                                                         Online ad spend per capita                                  €4.1


© IAB Europe                                                                                                                                  29
Section 3 - Overview by country


     CENTRAL & EASTERN EUROPE


     Croatia

     After Russia, Croatia was the second fastest-growing market in         Growth of the Russian online advertising market is driven

     Europe in 2011 at 40.0%. Growth in the Croatian market was driv-       by a number of factors: large and continuing growth

     en by both display and paid-for-search, which increased 47.2%          of addressable audience (currently about 50% internet

     and 47.3% respectively since 2010.                                     penetration) and the presence of strong local players
                                                                            such as Yandex, Mail.Ru Group , VK.COM. This in turn
                                                                            allows competition on a global scale and fuels ongoing
      2011 Online Ad Spend                                       €26m
                                                                            investment in the online area including innovation in ICT.
      2011 YoY growth                                            40.0%
                                                                            We expect that these dynamics will help to maintain high
      Online as a proportion of total media ad spend             13.0%
      Online ad spend per capita                                   €6.0     growth of online advertising in Russia for the next 2-3
                                                                            years.


     Romania                                                                Boris Omelnitskiy, President, IAB Russia
     Romania grew 4.6% in 2011, which although low in comparison
     to other European countries, is high for a country whose total me-
     dia advertising was rapidly declining. With 7.2% online share of to-
     tal media ad spend and €1.0 online ad spend per capita, Romania
     has much room for growth in the sector.                                The Turkish online advertising market continues to grow
                                                                            double-digit in 2011. This has been driven by expansion

      2011 Online Ad Spend                                       €22m       of social media, video advertising and the rising e-com-

      2011 YoY growth                                             4.6%      merce advertising. The search market is also expanding
      Online as a proportion of total media ad spend              7.2%      in Turkey and becoming particularly prominent among
      Online ad spend per capita                                   €1.0     SME companies, which benefit from the ROI-centric
                                                                            format. With its young, innovative and multi-cultural
                                                                            digitalized generation, the Turkish market is becoming
     Serbia
                                                                            important both in Western and Eastern markets as inter-
     Europe’s smallest online advertising market, worth €12 million,        national advertisers are keen to reach those consumers.
     was also the third-fastest in terms of growth at 35.6%. Most of
     Serbia’s growth came from display, which accounts for 57.6% of         Neslihan Mesutoglu, General Manager at Turkuvaz Media
     the online advertising market.                                         Advertising Marketing/Digital


      2011 Online Ad Spend                                       €12m
      2011 YoY growth                                            35.6%
      Online as a proportion of total media ad spend              7.3%
      Online ad spend per capita                                   €1.7


30                                                                                                              IAB Europe AdEx Benchmark 2011
Section 4 - Background Data


                                                  TOP PROPERTIES DECEMBER 2011


Austria                                                           Belgium

 Media                                 Total Unique     % Reach   Media                                Total Unique     % Reach
                                       Visitors (000)                                                  Visitors (000)
    Total Internet Audience: Age 15+           4,756      100.0     Total Internet Audience: Age 15+           6,088      100.0
    Google Sites                               4,480       94.2     Google Sites                               5,824       95.7
    Facebook.com                               3,334       70.1     Microsoft Sites                            5,408       88.8
    Microsoft Sites                            2,917       61.3     Facebook.com                               4,734       77.8
    Amazon Sites                               2,172       45.7     Wikimedia Foundation Sites                 2,645       43.5
    Wikimedia Foundation Sites                 2,043       43.0     Yahoo! Sites                               2,228       36.6
    Glam Media                                 1,586       33.3     VEVO                                       2,172       35.7
    Yahoo! Sites                               1,489       31.3     Corelio                                    2,168       35.6
    VEVO                                       1,473       31.0     Belgacom Group                             2,131       35.0
    Axel Springer AG                           1,395       29.3     De Persgroep                               1,752       28.8
    United-Internet Sites                      1,385       29.1     Federated Media Publishing                 1,677       27.6
    Styria Media Group                         1,343       28.2     Apple Inc.                                 1,660       27.3
    eBay                                       1,327       27.9     VRT Sites                                  1,601       26.3
    Hubert Burda Media                         1,222       25.7     Viacom Digital                             1,578       25.9
    Apple Inc.                                 1,107       23.3     Telenet Sites                              1,538       25.3
    ORF.at Network                             1,042       21.9     Amazon Sites                               1,366       22.4
    Federated Media Publishing                    991      20.8     Groupe Rossel                              1,320       21.7
    Ask Network                                   926      19.5     Truvo International                        1,294       21.3
    ProSiebenSat1 Sites                           925      19.4     eBay                                       1,276       21.0
    Viacom Digital                                898      18.9     2dehands                                   1,148       18.9
    Deutsche Telekom                              893      18.8     Dailymotion.com                            1,081       17.8


Denmark
                                                                  Finland
 Media                                 Total Unique     % Reach
                                       Visitors (000)             Media                                Total Unique     % Reach
                                                                                                       Visitors (000)
    Total Internet Audience: Age 15+           3,687      100.0
                                                                    Total Internet Audience: Age 15+           3,394      100.0
    Google Sites                               3,456       93.7
                                                                    Google Sites                               3,282       96.7
    Microsoft Sites                            3,078       83.5
                                                                    Microsoft Sites                            2,949       86.9
    Facebook.com                               2,842       77.1
                                                                    Facebook.com                               2,723       80.2
    JP Politiken Hus                           1,381       37.5
                                                                    Sanoma Group                               2,392       70.5
    TV2 Danmark                                1,338       36.3
                                                                    Alma Media                                 2,251       66.3
    Wikimedia Foundation Sites                 1,286       34.9
                                                                    Wikimedia Foundation Sites                 1,755       51.7
    VEVO                                       1,212       32.9
                                                                    MTV3 Internet                              1,563       46.0
    Eniro Sites                                1,191       32.3
                                                                    Otava Group                                1,529       45.1
    Dr.dk                                      1,178       31.9
                                                                    Yleisradio Oy                              1,331       39.2
    eBay                                       1,175       31.9
                                                                    VEVO                                       1,324       39.0
    Apple Inc.                                 1,102       29.9
                                                                    Eniro Sites                                1,253       36.9
    Berlingske Media                           1,002       27.2
                                                                    Glam Media                                 1,126       33.2
    Yahoo! Sites                                  941      25.5
                                                                    Viacom Digital                                978      28.8
    Federated Media Publishing                    938      25.4
                                                                    Federated Media Publishing                    942      27.8
    Amazon Sites                                  924      25.1
                                                                    Amazon Sites                                  904      26.6
    Viacom Digital                                808      21.9
                                                                    Fonecta Sites                                 894      26.3
    Ask Network                                   708      19.2
                                                                    Yahoo! Sites                                  867      25.6
    Danske Bank                                   644      17.5
                                                                    Nordea Group                                 823       24.2
    IDG Network                                  624       16.9
                                                                    OP-Pohjola                                    788      23.2
    CBS Interactive                               616      16.7
                                                                    AOL, Inc.                                     733      21.6
                                                                                                                Source: comScore

© IAB Europe                                                                                                                       31
Section 4 - Background Data


     TOP PROPERTIES DECEMBER 2011


     France                                                           Germany

      Media                                Total Unique     % Reach    Media                                Total Unique      % Reach
                                           Visitors (000)                                                   Visitors (000)
        Total Internet Audience: Age 6+           47,759      100.0      Total Internet Audience: Age 6+           56,193         100.0
        Google Sites                              44,806       93.8      Google Sites                              52,591          93.6
        Microsoft Sites                           39,243       82.2      Facebook.com                              38,715          68.9
        Facebook.com                              32,931       69.0      Microsoft Sites                           33,908          60.3
        Orange Sites                              23,766       49.8      Amazon Sites                              32,543          57.9
        CCM-Benchmark                             22,187       46.5      eBay                                      30,212          53.8
        Yahoo! Sites                              21,439       44.9      Wikimedia Foundation Sites                26,222          46.7
        Wikimedia Foundation Sites                20,817       43.6      Axel Springer AG                          26,053          46.4
        Iliad - Free.fr Sites                     19,641       41.1      Deutsche Telekom                          26,041          46.3
        Groupe PPR                                19,512       40.9      United-Internet Sites                     25,530          45.4
        Groupe Pages Jaunes                       18,915       39.6      Hubert Burda Media                        23,268          41.4
        Amazon Sites                              18,504       38.7      ProSiebenSat1 Sites                       22,294          39.7
        Axel Springer AG                          17,790       37.2      Yahoo! Sites                              20,848          37.1
        Schibsted                                 16,468       34.5      RTL Group Sites                           17,624          31.4
        Vivendi                                   16,331       34.2      gutefrage.net GmbH                        16,397          29.2
        Dailymotion.com                           15,987       33.5      Glam Media                                15,261          27.2
        Groupe Lagardere                          15,851       33.2      Apple Inc.                                14,146          25.2
        Ebuzzing                                  15,564       32.6      Otto Gruppe                               12,757          22.7
        Groupe M6                                 14,702       30.8      Verlagsgruppe Georg von
                                                                                                                   10,501           18.7
        eBay                                      14,652       30.7    Holtzbrinck
        Rakuten Inc                               13,497       28.3      Mail.ru Group                             10,451           18.6
                                                                         The Mozilla Organization                  10,240           18.2


     Ireland                                                          Italy

      Media                                Total Unique     % Reach    Media                                Total Unique      % Reach
                                           Visitors (000)                                                   Visitors (000)
        Total Internet Audience: Age 15+           2,361      100.0      Total Internet Audience: Age 15+          24,468         100.0
        Google Sites                               2,239       94.8      Google Sites                              23,157          94.6
        Microsoft Sites                            1,871       79.2      Facebook.com                              19,168          78.3
        Facebook.com                               1,803       76.3      Microsoft Sites                           18,490          75.6
        Yahoo! Sites                               1,473       62.4      WIND Telecomunicazioni                    15,858          64.8
        Rte.ie                                     1,341       56.8      Yahoo! Sites                              15,481          63.3
        Distilled Media                            1,232       52.2      Telecom Italia                            12,391          50.6
        Glam Media                                 1,122       47.5      Wikimedia Foundation Sites                10,081          41.2
        Amazon Sites                               1,068       45.3      Populis                                    8,957          36.6
        BBC Sites                                     905      38.3      Banzai                                     8,948          36.6
        Wikimedia Foundation Sites                    879      37.2      Federated Media Publishing                 7,952          32.5
        Irish Times Group                             851      36.0      eBay                                       7,484          30.6
        Apple Inc.                                    790      33.5      Ask Network                                7,330          30.0
        VEVO                                          783      33.2      VEVO                                       6,799          27.8
        Independent News & Media                      781      33.1      RCS Media Group                            6,307          25.8
        Federated Media Publishing                    768      32.5      Gruppo Editoriale Espresso                 5,458          22.3
        New York Times Digital                        756      32.0      Apple Inc.                                 5,304          21.7
        Viacom Digital                                701      29.7      ForumCommunity                             5,185          21.2
        Ask Network                                   657      27.8      Amazon Sites                               5,032          20.6
        eBay                                          628      26.6      Axel Springer AG                           4,927          20.1
        Sky Sites                                     592      25.1      Viacom Digital                             4,767          19.5


                                                                                                                     Source: comScore

32                                                                                                           IAB Europe AdEx Benchmark 2011
Section 4 - Background Data


                                                  TOP PROPERTIES DECEMBER 2011


Netherlands                                                       Norway

 Media                                 Total Unique     % Reach   Media                                Total Unique     % Reach
                                       Visitors (000)                                                  Visitors (000)
    Total Internet Audience: Age 15+          11,997      100.0     Total Internet Audience: Age 15+           3,279      100.0
    Google Sites                              11,615       96.8     Google Sites                               2,969       90.5
    Microsoft Sites                           10,989       91.6     Facebook.com                               2,589       79.0
    Facebook.com                               8,409       70.1     Microsoft Sites                            2,536       77.3
    Sanoma Group                               7,305       60.9     Schibsted                                  2,312       70.5
    eBay                                       6,292       52.4     A-Pressen Group                            1,522       46.4
    Hyves                                      6,089       50.8     Wikimedia Foundation Sites                 1,409       43.0
    Wikimedia Foundation Sites                 5,765       48.1     Eniro Sites                                1,338       40.8
    Publieke Omroep                            5,583       46.5     AS Avishuset Dagbladet                     1,336       40.7
    Telegraaf Media Groep                      5,378       44.8     Telenor                                    1,334       40.7
    VEVO                                       4,451       37.1     TV2 Sites                                  1,230       37.5
    ING Group                                  4,274       35.6     NRK Sites                                  1,201       36.6
    Apple Inc.                                 3,976       33.1     Spotify                                    1,195       36.4
    Twitter.com                                3,918       32.7     Federated Media Publishing                 1,077       32.8
    Bol.com                                    3,898       32.5     VEVO                                       1,065       32.5
    Rabobank Group                             3,801       31.7     Apple Inc.                                    990      30.2
    KPN                                        3,729       31.1     Yahoo! Sites                                  936      28.6
    Yahoo! Sites                               3,442       28.7     Edda Media                                    888      27.1
    Federated Media Publishing                 3,388       28.2     Yr.co                                        825       25.2
    LinkedIn.com                               3,287       27.4     Amazon Sites                                  824      25.1
    Viacom Digital                             3,234       27.0     Viacom Digital                                805      24.5


Poland                                                            Russia

 Media                                 Total Unique     % Reach   Media                                Total Unique     % Reach
                                       Visitors (000)                                                  Visitors (000)
    Total Internet Audience: Age 15+          18,194      100.0     Total Internet Audience: Age 15+          53,345      100.0
    Google Sites                              17,721       97.4     Yandex Sites                              44,979       84.3
    MIH Limited                               14,820       81.5     Mail.ru Group                             44,748       83.9
    Nk.pl                                     13,778       75.7     Google Sites                              37,866       71.0
    Facebook.com                              13,514       74.3     Vkontakte                                 36,940       69.2
    Grupa Onet.pl                             13,170       72.4     Wikimedia Foundation Sites                22,057       41.3
    Gazeta.pl Group                           12,258       67.4     Ucoz Web Services                         21,344       40.0
    Wirtualna Polska                          12,041       66.2     RosBusinessConsulting                     20,449       38.3
    Grupa o2                                  11,593       63.7     Microsoft Sites                           18,603       34.9
    Wikimedia Foundation Sites                10,351       56.9     Rambler Media                             17,967       33.7
    Interia.pl SA                              8,158       44.8     SUP                                       14,636       27.4
    Chomikuj.pl                                7,903       43.4     Gazprom Media                             12,607       23.6
    VEVO                                       7,384       40.6     Facebook.com                              11,716       22.0
    Demotywatory.pl                            7,092       39.0     Avito.ru                                  10,279       19.3
    Kwejk.pl                                   6,653       36.6     Technorati Media                           9,574       17.9
    Microsoft Sites                            5,899       32.4     Ivi.ru                                     9,512       17.8
    Filmweb.pl                                 5,078       27.9     Opera Software                             8,834       16.6
    Orange Sites                               5,018       27.6     LiveInternet                               8,674       16.3
    Grupa Money.pl                             4,774       26.2     Zaycev Net                                 8,415       15.8
    Tekstowo.pl                                4,238       23.3     Kinopoisk.ru                               7,391       13.9
    Viacom Digital                             4,193       23.0     Ozon.ru Sites                              7,294       13.7


                                                                                                               Source: comScore
© IAB Europe                                                                                                                      33
Section 4 - Background Data


     TOP PROPERTIES DECEMBER 2011


     Spain                                                            Sweden

     Media                                 Total Unique     % Reach   Media                                Total Unique      % Reach
                                           Visitors (000)                                                  Visitors (000)
       Total Internet Audience: Age 6+            24,489      100.0     Total Internet Audience: Age 15+           6,242         100.0
       Google Sites                               23,284       95.1     Google Sites                               5,889          94.3
       Microsoft Sites                            22,869       93.4     Microsoft Sites                            5,361          85.9
       Facebook.com                               17,241       70.4     Facebook.com                               4,938          79.1
       Terra - Telefonica                         14,910       60.9     Schibsted                                  4,178          66.9
       Prisa                                      14,145       57.8     Bonnier Group                              3,906          62.6
       Yahoo! Sites                               13,128       53.6     Wikimedia Foundation Sites                 2,643          42.3
       RCS Media Group                            11,616       47.4     Spotify                                    2,578          41.3
       Wikimedia Foundation Sites                  9,706       39.6     Blogg.se                                   2,315          37.1
       Schibsted (Anuntis-Infojobs-                                     Federated Media Publishing                 2,223          35.6
                                                   9,506       38.8
     20minutos)                                                         Swedbank                                   2,090          33.5
       Federated Media Publishing                  9,009       36.8     Sveriges Television                        1,974          31.6
       Vocento                                     8,664       35.4     VEVO                                       1,929          30.9
       Corporacion Publicitaria De                                      Eniro Sites                                1,807          29.0
                                                   8,011       32.7
     Medios                                                             CDON Group                                 1,695          27.2
       Orange Sites                                7,767       31.7     Yahoo! Sites                               1,606          25.7
       NetShelter Technology Media                 6,808       27.8     Apple Inc.                                 1,579          25.3
       VEVO                                        6,256       25.5     Amazon Sites                               1,557          24.9
       Weblogs SL Sites                            6,146       25.1     eBay                                       1,476          23.6
       Ask Network                                 5,596       22.9     Viacom Digital                             1,310          21.0
       Amazon Sites                                5,483       22.4     CBS Interactive                            1,091          17.5
       Taringa.net                                 5,084       20.8
       El Corte Ingles Sites                       5,077       20.7


     Switzerland                                                      Turkey

     Media                                 Total Unique     % Reach   Media                                Total Unique      % Reach
                                           Visitors (000)                                                  Visitors (000)
        Total Internet Audience: Age 15+           4,817      100.0     Total Internet Audience: Age 15+          23,369         100.0
        Google Sites                               4,534       94.1     Google Sites                              22,969          98.3
        Microsoft Sites                            3,929       81.6     Facebook.com                              21,637          92.6
        Facebook.com                               3,176       65.9     Nokta.com MEDYA                           19,704          84.3
        Wikimedia Foundation Sites                 1,962       40.7     Microsoft Sites                           18,671          79.9
        Yahoo! Sites                               1,961       40.7     Mynet A.S.                                13,844          59.2
        Apple Inc.                                 1,737       36.1     Hurriyet Internet Group                   13,028          55.7
        Swisscom Sites                             1,620       33.6     Dailymotion.com                           11,989          51.3
        VEVO                                       1,430       29.7     DK Gazetecilik                            11,801          50.5
        Amazon Sites                               1,283       26.6     Aksoy Group                               10,892          46.6
        Axel Springer AG                           1,214       25.2     Yeni Medya                                10,844          46.4
        Tamedia Sites                              1,200       24.9     Dogan Online                               9,925          42.5
        Federated Media Publishing                 1,141       23.7     Wikimedia Foundation Sites                 9,421          40.3
        MIH Limited                                1,089       22.6     Dogan Gazetecilik                          7,768          33.2
        Glam Media                                 1,049       21.8     Donanimhaber.com                           7,724          33.1
        Deutsche Telekom                              984      20.4     Turkuvaz Yayin                             7,586          32.5
        Viacom Digital                                921      19.1     eBay                                       7,372          31.5
        SRG SSR                                       909      18.9     Twitter.com                                6,930          29.7
        SBB CFF FFS Sites                             853      17.7     Federated Media Publishing                 6,915          29.6
        Search.ch                                     800      16.6     Turk Telecom Group                         6,710          28.7
        eBay                                          797      16.5     Kokteyl Group                              6,501          27.8
                                                                                                                    Source: comScore

34                                                                                                          IAB Europe AdEx Benchmark 2011
Section 4 - Background Data


                                                 TOP PROPERTIES DECEMBER 2011


UK

 Media                                Total Unique     % Reach
                                      Visitors (000)
    Total Internet Audience: Age 6+          42,731      100.0
    Google Sites                             39,154       91.6
    Microsoft Sites                          36,404       85.2
    Facebook.com                             31,633       74.0
    Amazon Sites                             26,455       61.9
    Yahoo! Sites                             25,824       60.4
    BBC Sites                                22,614       52.9
    eBay                                     22,592       52.9
    Glam Media                               19,797       46.3
    Wikimedia Foundation Sites               19,118       44.7
    Apple Inc.                               17,651       41.3
    Ask Network                              15,230       35.6
    Home Retail Group                        12,709       29.7
    VEVO                                     12,621       29.5
    Federated Media Publishing               12,534       29.3
    Viacom Digital                           11,245       26.3
    CBS Interactive                          11,198       26.2
    AOL, Inc.                                10,641       24.9
    Sky Sites                                10,484       24.5
    Guardian Media Group                      9,796       22.9
    New York Times Digital                    9,697       22.7


                                                                              Source: comScore
© IAB Europe                                                                                     35
Section 4 - Background Data


     TOP AD PUBLISHER SITES 2011


     Austria                                                       Belgium

     Rank      Sites                               % of Total Ad    Rank     Sites                                       % of Total Ad
                                                    Impressions                                                           Impressions
     1         News Networld                              19.3%     1        De Persgroep Publishing nv - HLN.be                14.0%
     2         VOL Vorarlberg Online                      11.9%     2        eBay Belgium                                       10.1%
     3         Austria.com                                10.6%     3        Immoweb.be                                          8.3%
     4         oe24.at                                     7.1%     4        De Persgroep Publishing nv - 7Sur7                  7.0%
     5         ORF                                         5.3%     5        MSN / Bing Belgium                                  6.3%
     6         derStandard                                 3.6%     6        2dehands.be                                         4.9%
     7         Telekurier Online Medien - Kurier           3.6%     7        Netlog Belgium                                      4.8%
     8         Laola1.at                                   3.3%     8        Corelio - Het Nieuwsblad                            4.7%
     9         Kleine Zeitung                              3.0%     9        Skynet Belgacom                                     3.2%
     10        HEROLD.at                                   3.0%     10       Corelio - De Standaard                              2.9%


     Denmark                                                       France

     Rank      Sites                               % of Total Ad    Rank     Sites                                       % of Total Ad
                                                    Impressions                                                           Impressions
     1         Ekstra Bladet                              19.3%     1        Orange France                                      21.8%
     2         TV2 Denmark                                16.9%     2        Groupe Amaury - L Equipe                            6.4%
     3         BT Denmark                                 10.6%     3        DistriGame                                          3.5%
     4         Den Bla Avis                                6.7%     4        Yahoo France                                        3.5%
     5         Politiken Denmark                           4.3%     5        01net Network - 01 Net France                       3.4%
     6         Jubii Denmark                               3.6%     6        BENCHMARK GROUP - L internaute                      2.9%
     7         MSN / Bing Denmark                          3.2%     7        eBay France                                         2.8%
     8         JP - Jyllands Posten                        2.8%     8        Pages Jaunes                                        2.5%
     9         Sondagsavisen.dk                            2.7%     9        Free                                                2.3%
     10        Bold.dk                                     2.5%     10       20 Minutes France                                   2.3%


     Germany                                                       Italy

     Rank      Sites                               % of Total Ad    Rank    Sites                                        % of Total Ad
                                                    Impressions                                                           Impressions
     1         T-Online Germany                           35.6%     1       Libero                                              11.1%
     2         Axel Springer - Bild.de                     9.4%     2       Tiscali Italy                                       10.0%
     3         eBay Germany                                8.9%             Gruppo Editoriale L'Espresso -
                                                                    3                                                              9.2%
     4         mobile.de                                   3.9%             Repubblica
     5         GMX Germany                                 3.4%     4       Alice/Virgilio                                         8.2%
     6         Web.de                                      3.0%     5       YouTube Italy                                          8.0%
     7         Spiegel Verlag - Spiegel Online             2.8%     6       Il Meteo                                               5.8%
     8         Freenet.de                                  2.6%     7       RCS - Corriere della Sera                              4.2%
     9         Olympia Verlag - Kicker Online              1.6%     8       eBay Italy                                             3.2%
     10        Yahoo Germany                               1.5%     9       Yahoo Italy                                            2.9%
                                                                    10      Gazzetta dello Sport                                   2.7%
                                                                                                                       Source: Nielsen


36                                                                                                           IAB Europe AdEx Benchmark 2011
Section 4 - Background Data


                                                                  TOP AD PUBLISHER SITES 2011


Netherlands                                                               Norway

 Rank          Sites                                      % of Total Ad   Rank     Sites                                % of Total Ad
                                                           Impressions                                                   Impressions
 1             Sanoma - NU.nl                                    11.3%    1        VG Nett                                     27.3%
 2             Sanoma - Startpagina.nl                           10.8%    2        Finn.no                                     12.8%
 3             Marktplaats                                       10.8%    3        ABC Startsiden                               8.6%
 4             Telegraaf Media Nederland - De Telegraaf           7.0%    4        Sol Norway                                   7.6%
 5             Algemeen Dagblad                                   4.7%    5        Dagbladet.no                                 4.9%
 6             Buienradar.nl                                      2.9%    6        Nettavisen.no                                4.4%
 7             WeerOnline                                         2.8%    7        Aftenposten                                  4.3%
 8             Omroep - NOS                                       2.8%    8        Hegnar Online                                3.2%
 9             VNU - Tweakers                                     2.1%    9        BT - Bergens Tidende                         2.8%
 10            TVGids Netherlands                                 2.0%    10       TV2 Norway                                   2.5%


Spain                                                                     Sweden

 Rank          Sites                                      % of Total Ad   Rank     Sites                                % of Total Ad
                                                           Impressions                                                   Impressions
 1             Unidad Editorial - Marca                          35.8%    1        Aftonbladet                                 25.8%
 2             Unidad Editorial - El Mundo                       12.5%    2        Expressen Sweden                            10.5%
 3             Diario AS                                          4.7%    3        Tradera                                      7.0%
 4             Idealista                                          4.1%    4        MSN / Bing Sweden                            6.5%
 5             Grupo Prisa - El Pais                              3.6%    5        SVD - Svenska Dagbladet                      4.8%
 6             Terra Spain                                        3.3%    6        Blogg.se                                     4.6%
 7             Corp. Publicitaria - Sport.es                      3.2%    7        DN - Dagens Nyheter                          3.3%
 8             MSN / Bing Spain                                   2.2%    8        Dagens Industri Sweden - Di.se               2.4%
 9             Mundo Deportivo                                    1.7%    9        Spray Sweden                                 1.7%
 10            YouTube Spain                                      1.5%    10       TV.nu                                        1.5%


Switzerland                                                               Turkey

 Rank     Sites                                           % of Total Ad   Rank     Sites                                % of Total Ad
                                                           Impressions                                                   Impressions
 1        Swisscom / Bluewin                                     34.8%    1        Mynet - Mynet                               14.3%
 2        Tamedia - 20 Minuten Switzerland                        9.9%    2        Medyanet - Hurriyet                          7.4%
 3        Ringier - Blick Online                                  6.7%    3        Netbook Media - Haberturk.com                6.7%
 4        Autoscout24 Switzerland                                 5.3%    4        Medyanet - Milliyet.com.tr                   6.2%
 5        Tamedia - Tagesanzeiger                                 5.0%    5        Netbook Media - Memurlar.net                 6.1%
 6        MSN / Bing Switzerland                                  4.2%    6        Aksoy Group - sahibinden.com                 5.8%
 7        Homegate                                                3.6%    7        Turkuvaz Medya Digital - SABAH               4.1%
 8        GMX Switzerland                                         3.0%    8        Medyanet - Ekolay.net                        4.0%
 9        NZZ Online / Neue Zürcher Zeitung                       2.2%    9        Medya Guru - Sahadan.com                     3.3%
 10       Ticinonline                                             2.1%    10       Logaritma - YeniSafak                        2.8%

                                                                                                                        Source: Nielsen


© IAB Europe                                                                                                                              37
Section 4 - Background Data


     TOP AD PUBLISHER SITES 2011


     UK

     Rank   Sites                                 % of Total Ad
                                                   Impressions
     1      YouTube UK                                   14.4%
     2      eBay United Kingdom                          12.0%
     3      DMGT - Mail Online                            7.3%
     4      Yahoo United Kingdom                          6.7%
     5      MSN / Bing United Kingdom                     5.7%
     6      Amazon United Kingdom                         3.0%
     7      ITV                                           3.0%
     8      Hearst Magazines - Digital Spy                2.8%
            Guardian News and Media - Guardian.
     9                                                    2.8%
            co.uk
     10     Sky.com United Kingdom                        2.7%


                                                                            Source: Nielsen


38                                                                IAB Europe AdEx Benchmark 2011
Section 4 - Background Data


                                     INTERNET PENETRATION IN EUROPE 2011


 Austria                                             Belgium
 Internet penetration by household           77.0%   Internet penetration by household                    72.2%


 Bulgaria                                            Czech Republic
 Internet penetration by household           42.6%   Internet penetration by household                    64.0%


 Denmark                                             Finland
 Internet penetration by household           87.9%   Internet penetration by household                    74.5%


 France                                              Germany
 Internet penetration by household           70.6%   Internet penetration by household                    76.9%


 Greece                                              Hungary
 Internet penetration by household           49.3%   Internet penetration by household                    62.7%


 Ireland                                             Netherlands
 Internet penetration by household           69.1%   Internet penetration by household                    93.6%


 Norway                                              Poland
 Internet penetration by household           89.5%   Internet penetration by household                    50.0%


 Russia                                              Serbia
 Internet penetration by household           43.5%   Internet penetration by household                    89.5%


                                                                                         Source: IHS Screen Digest


© IAB Europe                                                                                                         39
Section 4 - Background Data


     INTERNET PENETRATION IN EUROPE 2011


     Slovakia                                    Slovenia
     Internet penetration by household   59.6%   Internet penetration by household                        71.5%


     Spain                                       Spain
     Internet penetration by household   60.3%   Internet penetration by household                        60.3%


     Sweden                                      Switzerland
     Internet penetration by household   81.3%   Internet penetration by household                        84.1%


     Turkey                                      UK
     Internet penetration by household   42.5%   Internet penetration by household                        77.8%


                                                                                     Source: IHS Screen Digest


40                                                                                   IAB Europe AdEx Benchmark 2011
Section 5 - Appendices


Appendix i: Definition of formats                                          Integrated content

                                                                           Advertising space without a direct link to the advertiser’s website,
Online display advertising
                                                                           including tenancies and sponsorships (see below for detailed defi-
Banners, buttons, skyscrapers, overlays, interstitials, pop ups dis-       nitions of these).
played on a website.
                                                                           E-Mail marketing (excluded from the AdEx Benchmark)
Online video advertising
                                                                           Where the body of the email is determined by the advertiser and
There are numerous definitions of online video advertising.                is sent on their behalf by an email list manager/owner.
Principally included can be:
•   in-stream video advertising (pre-rolls, mid-rolls, post-rolls)         Newsletter advertising
•   in-stream banner overlays                                              Advertising (text or banner) that appears around the unrelated edi-
•   out-of-stream video advertising (e.g. self-play video on social        torial content of email newsletters.
    network, not embedded in non-advertising video content)
•   contextual video advertising (e.g. branded video players,              Interactive Television
    contextual banner advertising sold against video content).             Any advertising distributed through the digital television platform.

Affiliate marketing                                                        Mobile advertising - display
Fees paid to third party (affiliate) for traffic generation (e.g. pay-     Any display advertising viewed or read on a mobile phone includ-
per-visit). Note: for the time being affiliate spend will be included in   ing rich media advertising. This could be browser-based as well
display spend in the Ad Ex survey (rather than reported as stand-          as in-app.
alone category).
                                                                           Mobile advertising - search
Online classifieds
                                                                           Advertising appearing on specific word requests on search en-
A fee is paid by an advertiser to display an ad or listing around          gines, viewed on a mobile device.
a specific vertical such as automotive, recruiting and real estate,
regardless of the outcome of the ad (ie, the fee is paid even if there     Mobile advertising - SMS/MMS
is no ‘sale’).                                                             3rd party ads in SMS and outbound SMS only - this includes ad-
                                                                           vertising either within the body copy of an SMS / MMS message,
Online directories
                                                                           or outbound messaging.
Online version of printed yellow pages (business listing paid for
by advertiser).                                                            Mobile advertising - other

                                                                           All other mobile advertising (e.g. mobile classifieds).
Paid-for-search advertising

Advertising appearing on specific word requests on search en-              Online auctions
gines.                                                                     The fees received by online auction houses, e.g. Ebay, from suc-
                                                                           cessful sales through their sites.
Search engine optimisation
(excluded from the AdEx Benchmark)                                         In-game advertising
Fees paid to a 3rd party to improve website ranking in search              Fees paid for advertising, sponsorship or product placements
engines.                                                                   within an online game.


© IAB Europe                                                                                                                                      41
Section 6 - Appendices


     Tenancies                                                                 IAB Chapter in Denmark (Danske Medier)

     Long term partnership between advertiser and media owner. Me-             http://danskemedier.dk/
                                                                               Source: Danske Medier
     dia owner benefits from content or service offered by tenant to
     their customers, although media space may be paid for in usual            IAB Finland
     ways.                                                                     http://www.iab.fi/
                                                                               Partner: TNS Gallup (for Display and Classifieds)
     Sponsorships
                                                                               IAB France
     Advertiser sponsorships of content areas.
                                                                               http://www.iabfrance.com/
                                                                               Source: France Pub
     Interruptive formats
                                                                               IAB Chapter in Germany (OVK)
     A type of internet display advertising that interrupts the user expe-
                                                                               http://www.bvdw.org/
     rience with the page content eg pop ups, overlays.                        Partner: Nielsen Media Research
     The following four formats are collated as part of this report
                                                                               IAB Greece
     •   Display advertising: includes online display advertising,
         online video advertising, affiliate marketing, integrated             http://www.iab.gr/

         content, newsletter advertising, interactive television, mobile
                                                                               IAB Hungary
         advertising – display, online auctions, in-game advertising,
         tenancies, sponsorships, and interruptive formats as                  http://www.iab.hu/
                                                                               Partner: PwC
                                                              1
         described above and social media where reported
     •   Paid-for-search advertising                                           IAB Ireland
     •   Classifieds & Directories: includes online classifieds and            http://www.iabireland.ie/
                                                                               Partner: PwC
         online directories as described above
     •   ‘Other’ advertising: an umbrella category for ad spend which          IAB Italy
         could not be redistributed to the three formats above                 http://www.iab.it/
                                                                               Partner: FCP/Nielsen Media Research

     Appendix ii: The Participating IABs                                       IAB Netherlands

                                                                               http://www.iab.nl/
     IAB Austria                                                               Partner: Deloitte
     http://www.iab-austria.at
     Source: Focus Media Research and Werbeplanung.at                          IAB Chapter in Norway

                                                                               http://www.inma.no/
     IAB Belgium                                                               Source: IRM/INMA

     http://www.iab-belgium.be                                                 IAB Poland
     Source: Mediaxim and IHS Screen Digest
                                                                               http://www.iabpolska.pl/
     IAB Chapter in Bulgaria (Interactive Association)                         Partner: PwC

     http://www.iabulgaria.bg                                                  IAB Romania

                                                                               http://www.iab-romani.ro/
     IAB Croatia                                                               Partner: PwC Romania

     http://www.inama.hr/


     1. IAB Europe and IHS Screen Digest do not provide a standardised definition of social media advertising as there is still no consensus on this
     matter.


42                                                                                                                       IAB Europe AdEx Benchmark 2011
Section 6 - Appendices


IAB Russia                                                           rates, the prior year’s figures are also re-calculated using the cur-

http://www.iabrus.ru/                                                rent report’s year-average exchange rate in order to give transpar-
Partner: AKAR (Russian Association of Communication Agencies)        ency over the growth rate.

IAB Serbia
                                                                     The chart below shows the amount of actual, estimated and ad-
http://www.iab.rs/
                                                                     justed data included in the 2011 AdEx Benchmark.

IAB Chapter in Slovakia (AIM)

http://www.aimsr.sk/
                                                                     Appendix iv: Adjustments by country
IAB Slovenia
                                                                     Austria
http://www.soz.si/
Source: Mediana                                                      •   Ratecard data provided for all formats by Focus Media
                                                                         Research and Werberplanung.at (an Austrian consulting
IAB Spain
                                                                         company) in coordination with IAB Austria
http://www.iabspain.net/
Source: PwC                                                          •   2010 data restated to ensure comparability by the
                                                                         companies mentioned above
IAB Sweden
                                                                     •   2011 discounts applied based on IHS Screen Digest
http://www.iabsvergie.se/                                                estimates as follows:
Source: IRM
                                                                         o      Display – 40%
IAB Switzerland                                                          o      Classifieds & Directories – 20%
http://www.iabswitzerland.ch/                                            o      Paid-for-search – 5%
Partner: MediaFocus
                                                                         o      Mobile Display – 40%
IAB Turkey                                                           •   2010 discounts applied based on IHS Screen Digest

http://www.iab-turkiye.org/                                              estimates as follows:
                                                                         o      Display – 38.5%
IAB UK                                                                   o      Classifieds & Directories –18.5%

http://www.iabuk.net/                                                    o      Paid-for-search – 5%
Partner: PwC
                                                                     Belgium
Appendix iii: Methodology and adjusted data                          •   Ratecard data provided for Display market by Mediaxim
                                                                     •   Display discounted by 55.8%
Each national IAB runs its own annual online advertising spend       •   Classifieds & Directories and Paid-for-search estimated
benchmark study. As the methodology for the studies varies               based on European averages
slightly by country, IAB Europe works with IHS Screen Digest to
ensure that the findings in the European report are comparable.      Bulgaria
This involves re-adjusting figures to allow for different original   •   Net data provided by IAB Bulgaria
methodologies, adjusting currencies where local data is not col-     •   Data collected by survey and estimated by the IAB Board to
lected in Euros and ensuring the year average exchange rate at           adjust for missing participants; paid-for-research revenues
2011 has been used. To provide data for previous year growth             based on estimated of Bulgarian Google revenues
                                                                     •   Data grossed up as follows based on local IAB
                                                                         recommendations:


© IAB Europe                                                                                                                                 43
Section 6 - Appendices


         o     Display – 5%                                                 o      Classifieds & Directories – 15% to 100% of Classifieds
         o     Classifieds & Directories – 0.5%                                    & Directories total
         o     Paid-for-search – 4%                                         o      Paid-for-search – 15% to 50% of Paid-for-Search
         o     Other – 5%
     •   “Other” category not redistributed in any of the above         France
         formats as it was not possible to identify the type of ad      •   Newsletter advertising extracted from E-mail marketing
         spend                                                              (estimated at 20% of E-mail marketing) and added into
                                                                            Display
     Croatia                                                            •   E-mail marketing excluded
     •   No data supplied by IAB Croatia for 2011                       •   Classifieds & Directories category only includes Directories
     •   Classifieds & Directories and Paid-for-search modelled based       figure published by IREP
         on CEE average rate and applied to 2010 figures
     •   Display estimated based on local IAB recommendations           Germany

                                                                        •   Ratecard data provided by OVK/Nielsen
     Czech Republic                                                     •   Data was discounted as follows based on IHS Screen Digest
     •   Ratecard data provided for Display and Classifieds &               estimates:
         Directories                                                        o      Display excl. video – 63.6%
     •   Mobile advertising distributed as follows:                         o      Affiliate marketing – 63.6%
         o     Mobile internet advertising into Display and Paid-for-   •   Online video figure based on IHS Screen Digest estimates
               Search based on their market share of total online ad    •   Affiliate marketing and video added into Display category
               spend                                                    •   Data grossed up as follows:
         o     Mobile messaging into Other                                  o      Online video – 15% to 95% of Online video total
     •   Paid-for-search reduced by 155,962,000 CZK to exclude              o      Paid-for-search – 10% to 100% of Paid-for-search
         pan-European spend                                                        total
     •   Data discounted by 34.1% in all categories apart from Paid-
         for-search, based on local IAB recommendations                 Greece

                                                                        •   Classifieds & Directories figures for 2010 and 2011 estimated
     Denmark                                                                by IHS Screen Digest
     •   Net data provided by Danske Medier
     •   E-mail marketing excluded                                      Hungary
     •   Data grossed up as follows:                                    •   E-mail marketing excluded
         o     Display – 7% on 60% of Display total                     •   Mobile messaging included into Other category
         o     Paid-for-search – 7% on 40% of Paid-for-Search total
                                                                        Ireland

                                                                        •   Unspecified spend distributed as follows:
     Finland                                                                o      90% into Display category
     •   Net data provided by TNS Gallup for Display and Classifieds;       o      10% into Classifieds & Directories and Paid-for-Search
         IAB Finland for Paid-for-search and Directories                           based on their share of total online ad spend
     •   Data grossed up as follows based on local IAB                  •   2010 Display category restated in Gross rate (grossed up by
         recommendations:                                                   15%)
         o     Display – 15% to 100% of Display total


44                                                                                                               IAB Europe AdEx Benchmark 2011
Section 6 - Appendices


Italy                                                                  Russia

•   Net data provided by IAB and FCP/Nielsen                           •   Net data provided by IAB Russia/AKAR
•   E-mail marketing excluded                                          •   Data grossed up as follows based on local IHS Screen
•   Mobile advertising distributed as follows:                             Digest estimates:
    o          Mobile Display into Display category                        o      Display – 15% on 100% of Display total
    o          Mobile messaging into Other                                 o      Paid-for-search – 15% on 30% of Paid-for-Search total
•   Data grossed up as follows based on local IAB                      •   Classifieds & Directories not estimated because they are
    recommendations:                                                       negligible in Russia, based on IAB Russia recommendations
    o          Display – 15% to 100% of total Display
    o          Mobile advertising – 15% to 77.5% of Mobile             Serbia
               advertising                                             •   SEO and e-mail marketing excluded
                                                                       •   Growth rate was calculated including ‘Other’ because most
Netherlands                                                                of the ‘Other’ category constituted of social media, which is
•   Net data provided by IAB Netherlands and Deloitte                      traditionally included in the Display category
    Netherlands
•   Affiliate marketing redistributed as follows:                      Slovakia
    o          10% excluded as it was SEO                              •   Sponsorships, Lead Generation, Slotting fees, and Video
    o          90% added into Display category                             included in Display category
•   E-mail marketing excluded                                          •   E-mail marketing excluded
•   Data grossed up as follows based on local IAB
    recommendations:                                                   Slovenia
    o          Display – 15%                                           •   All categories reduced by 4% to exclude production costs
    o          Mobile display – 15%
                                                                       Spain
Norway                                                                 •   Net data provided by IAB Spain and PwC Spain
•   No adjustments needed                                              •   Classifieds extracted from Display using IAB Europe estimate
                                                                           and moved into Classifieds & Directories category
Poland                                                                 •   Newsletter advertising extracted from E-mail marketing and
•   E-mail marketing excluded                                              added into Display
•   Unspecified spend distributed among all categories based           •   E-mail marketing excluded
    on each category’s share of total online ad spend                  •   Video advertising, in-game advertising, and mobile display
                                                                           advertising added into the Display category
Romania                                                                •   Mobile search added into the Paid-for-search category
•   Net data provided by IAB Romania and PwC Romania                   •   Data grossed up as follows based on IHS Screen Digest
•   Affiliate marketing, integrated content, newsletter advertising,       estimates:
    contextual advertising, and all unspecified advertising added          o      Display – 10%
    into the Display category                                              o      Mobile Display – 10%
•   Display was grossed up by 5% based on local IAB
    recommendations                                                    Sweden

                                                                       •   Net data provided by IRM
                                                                       •   E-mail marketing excluded


© IAB Europe                                                                                                                               45
Section 6 - Appendices


     •   Mobile advertising distributed as follows:                     UK
         o     Mobile Display into Display category                     •    Display, Classifieds & Directories, and Paid-for-search kept
         o     Mobile Search into Paid-for-search                            as reported
         o     Mobile messaging into Other                              •    Other calculated as the difference of the Total reported and
     •   Reported paid-for-search reduced by 10% to exclude SEO              Total of Display, Classifieds & Directories and Paid-for-search
         revenue                                                             (this includes Lead-generation, Social Media, Solus Email)
     •   Display reduced by 10% to exclude transaction-oriented         •    2010 was restated using the same methodology
         payments
     •   Data was grossed up as follows based on local IAB
         recommendations:
         o     Display – 6% on 75% of Display total for 2011 and
               70% of Display total for 2010
         o     Mobile advertising – 1.8% on 100% of Mobile total


     Switzerland

     •   Affiliate marketing category moved into Display


     Turkey

     •   Net data provided by IAB Turkey
     •   E-mail marketing excluded
     •   Paid-for-search is 90% of the sum of reported Paid-for-
         search and Search engine advertising revenues
     •   Classifieds & Directories include only Classifieds
     •   Mobile Display and 10% of the sum of reported Paid-for-
         search and Search engine advertising revenues ( which are in
         fact display ads) added into the Display category
     •   Mobile messaging was included in Other category
     •   Data grossed up as follows:
         o     Display – 15%
         o     Classifieds & Directories – 15%
         o     Paid-for-search – 15%
         o     Mobile display – 15%
         o     Mobile messaging – 15% on 80% of Mobile
               Messaging total
     •   2010 figures restated based on IHS Screen Digest estimated
         2011 growth rates


46                                                                                                                IAB Europe AdEx Benchmark 2011
OUR RESEARCH PARTNERS


IHS Screen Digest is the pre-eminent firm of industry analysts cov-    comScore, Inc. (NASDAQ: SCOR) is a global leader in measuring

ering global media markets including film, television, broadband       the digital world and preferred source of digital business analytics.

media, mobile media, cinema, home entertainment, gaming, and           comScore helps its clients better understand, leverage and profit

advertising. In November 2010, Screen Digest Limited was ac-           from the rapidly evolving digital marketing landscape by providing

quired by US research company iSuppli Corporation who were             data, analytics and on-demand software solutions for the meas-

subsequently acquired by IHS, one of the biggest providers of mar-     urement of online ads and audiences, media planning, website

ket research and insight globally. Together IHS Screen Digest and      analytics, advertising effectiveness, copy-testing, social media,

IHS iSuppli offer the most complete and insightful analysis of the     search, video, mobile, cross-media, e-commerce, and a broad

global technology, media and telecommunications (TMT) sector.          variety of emerging forms of digital consumer behavior. comScore

www.screendigest.com                                                   services, which now include the product suites of recent acquisi-
                                                                       tions AdXpose, Nedstat, Nexius XPlore, ARSGroup and Certifica,
                                                                       are used by more than 1,800 clients around the world, includ-
                                                                       ing global leaders such as AOL, Baidu, BBC, Best Buy, Carat,
                                                                       Deutsche Bank, ESPN, Facebook, France Telecom, Financial
                                                                       Times, Fox, Microsoft, MediaCorp, Nestle, Starcom, Terra Net-
SPA Future Thinking has developed to become one of the fastest         works, Universal McCann, Verizon Services Group, ViaMichelin
growing and largest independent market research companies in           and Yahoo!.
Europe, with more than 200 employees across offices in the UK,         Central to most comScore services is the comScore panel, the
France, Germany and Italy and a partner network in 38 countries        largest continuously measured consumer panel of its kind. With
worldwide. With combined industry experience of over 40 years          approximately 2 million worldwide consumers under continuous
we offer thought leadership across a wide range of specialisms         measurement, comScore delivers one of the highest quality, most
and we provide genuine expertise and understanding across a            comprehensive views of internet browsing, buying and other ac-
wide range of industry sectors.                                        tivity, in the digital environment. Complementing the panel is a
We provide strategic research and actionable insights to a wide        unique census-level data collection method, which allows for the
range of leading companies; offering both bespoke solutions,           integration of consumers’ internet behaviour with powerful audi-
analytics and proprietary techniques to help guide the decisions       ence-measurement insights. The methodology that comScore
that you make in areas like, market development, new product           utilises to thread census-level collected data with the comScore
development, innovation, customer satisfaction and experience,         panel is called Unified Digital Measurement.
brand, communications, buying behaviour and more.                      www.comscore.com
www.spafuturethinking.com


                                                                       Nielsen Holdings N.V. (NYSE: NLSN) is a global information and
                                                                       measurement company with leading market positions in market-
                                                                       ing and consumer information, television and other media meas-
                                                                       urement, online intelligence, mobile measurement, trade shows
                                                                       and related properties. Nielsen has a presence in approximately
                                                                       100 countries, with headquarters in New York, USA and Diemen,
                                                                       the Netherlands. For more information, visit www.nielsen.com.
                                                                       www.nielsen.com


© IAB Europe                                                                                                                                   47
ABOUT IAB EUROPE


     Our Executive Team                                                   Our Board

     Alain Heureux, President and CEO, has more than 20 years pan-        Made up of nine national IABs and nine corporate members, the
     European marketing experience having established several mar-        Board represents the wide-ranging interests of the many stake-
     keting services companies across Europe. A well-known figure         holders in the European digital marketing industry.
     in the European digital and interactive advertising scene, Alain
     speaks at conferences and events across the region promoting         Chairman: Guy Phillipson, IAB UK
     the value of online advertising.
     president@iabeurope.eu                                               Vice-Chairman: Thomas Duhr, United Internet Media


     Alison Fennah, Vice-President Research and Marketing, has            Corporate members: Adconion Media Group, Adobe, ADTECH,
     worked with trade organisations for more than 10 years and in        Alcatel-Lucent, AOL Advertising Europe, AudienceScience, BBC
     interactive marketing since the early 1990s.                         Advertising, CNN, CoAdvertise, comScore Europe, CPX Interac-
     vprm@iabeurope.eu                                                    tive, Criteo, eBay International Advertising, Expedia Inc, Fox Inter-
                                                                          active Media, Gemius, Goldbach Media Group, Google, GroupM,
     Kimon Zorbas, Vice-President Public Affairs, known and respected     Hi-Media, Koan, Microsoft Europe, Millward Brown, News Corpo-
     in European institutions for more than 10 years, heads up the pub-   ration, nugg.ad, Nielsen Online, OMD, Orange Advertising Net-
     lic policy programme of the association.                             work, PHD, Prisa, Publicitas Europe, Quisma, Sanoma Digital,
     vp@iabeurope.eu                                                      Selligent, TradeDoubler, Triton Digital, United Internet Media, Val-
                                                                          ueClick, Verisign, Viacom International Media Networks, Webtrekk,
                                                                          White & Case, Yahoo! and zanox


                                                                          Country members: Austria, Belgium, Bulgaria, Croatia, Czech Re-
                                                                          public, Denmark, Finland, France, Germany, Greece, Hungary, Ire-
                                                                          land, Italy, Netherlands, Norway, Poland, Romania, Russia, Serbia,
                                                                          Slovakia, Slovenia, Spain, Sweden, Switzerland, Turkey, Ukraine
                                                                          and United Kingdom representing their 5.000 members. The IAB
                                                                          network represents over 90% of European digital revenues and
                                                                          is acting as voice for the industry at National and European level.


48                                                                                                                  IAB Europe AdEx Benchmark 2011
Section 6 - Appendices


                                                                                                         AND FINALLY


Also from IAB Europe                                                 Special thanks

One of IAB Europe’s three core objectives is to demonstrate the      With sincere thanks to all the contacts at the national IABs who have
value of the online advertising industry through a programme of      supported the production of this report by supplying and explaining
research. IAB Europe brings together the best of research avail-     their data to IAB Europe.
able on the European online advertising market through its network
of members, national IABs and partners. Current projects include:    Thanks to our members comScore and Nielsen for audience meas-
                                                                     urement figures.


                                                                     During Spring 2012, IAB Europe created an AdEx Benchmark Task-
                                                                     force on report strategy, questionnaire and methodology. We would
Mediascope Europe is the industry standard European piece of
                                                                     like to thank the AdEx Benchmark Task Force for their valuable feed-
cross-media consumer research. Conducted since 2003 and it
                                                                     back and guidance in the production of this report:
has made a major contribution to the understanding of chang-
                                                                     Serena Belloni, Marketing and Research Manager, IAB Italy
ing media consumption patterns, the evolving consumer and
                                                                     Alexey Belyaev, Head of Internet Research, Video International and
e-commerce trends. It covers consumer use of internet, radio,
                                                                     Chair of IAB Russia Research Committee
TV, mobile, newspapers and magazines – including the evolution
                                                                     Tim Elkington, Director of Research and Strategy, IAB UK
of media multi-tasking. Emerging and evolving online media in-
                                                                     Bjorn Kaspring, Head of Online Marketing and Market Development,
cluding internet use via mobile, tablet and games console, video
                                                                     IAB Germany
consumption and social media are investigated in depth to give
                                                                     Frederik Raviol, Business Analyst, United Internet Media
a rounded picture of the interactive consumer. 28 markets are
                                                                     Endre Somogyi, General Manager, IAB Hungary
now included– UK, Germany, France, Italy, Spain, Belgium, Neth-
erlands, Denmark, Norway, Sweden, Poland, Portugal, Russia,
Switzerland, Turkey, Austria, Bulgaria, Croatia, Czech Republic,     Authors of the AdEx Benchmark 2011 report
Finland, Greece, Hungary, Ireland, Romania, Serbia, Slovakia, Slo-
venia and Ukraine.
Contact: mediascope@iabeurope.eu
http://www.iabeurope.eu/research/mediascope-europe.aspx


The CCB is a free online research tool produced by Google and
IAB Europe which uses TNS data to provide agencies and adver-
tisers with consumer insights across 27 countries and 36 prod-
uct categories. Some material available exclusively to IAB Europe
member on the Knowledge Bank.
                                                                     Daniel Knapp,                        Eleni Marouli,
Regional report : Central & Eastern Europe                           Director of Advertising Research,    Analyst, Advertising Research
‘Do you CEE?’ produced in partnership with Gemius, gives thor-       IHS Screen Digest                    IHS Screen Digest
ough overview of CEE audiences and trends by country.
www.IABEurope.eu/research & www.IABEurope.eu/knowledgebank


© IAB Europe                                                                                                                                 49
Section 6 - Appendices


     CONTACT
     IAB Europe
     www.iabeurope.eu


     Alain Heureux            Alison Fennah              Daniel Knapp                       Bénédicte Blondel
     President                VP, Research & Marketing   Director of Advertising Research   Communications Manager
     IAB Europe               IAB Europe                 IHS Screen Digest                  IAB Europe
     president@iabeurope.eu   vprm@iabeurope.eu          daniel.knapp@ihs.com               communication@iabeurope.eu


50

Inversion publicidad digital ADEX 2011

  • 1.
    ADEX BENCHMARK 2011 EUROPEAN ONLINE ADVERTISING EXPENDITURE Published 9th July 2012
  • 2.
    CONTENTS 3 Introduction 4 About this report 5 Executive Summary Section 1 - AdEx 2011 Analysis 6 2011 Growth in context 8 26 Markets in perspective 12 Share of formats Section 2 - Online advertising overview by sector 13 Display 16 Classifieds & Directories 19 Paid-for-search 22 Mobile 23 Video Section 3 - Overview by country 24 Western Europe 28 Central & Eastern Europe Section 4 - Background data 31 TOP properties December 2011 36 TOP ad publisher sites 2011 39 Internet penetration in Europe 2011 Section 5 - Appendices 41 Appendix i 42 Appendix ii 43 Appendix iii 43 Appendix iv 47 Our research partners 48 About IAB Europe 49 And finally 2 IAB Europe AdEx Benchmark 2011
  • 3.
    INTRODUCTION This year’s reportdocuments the ongoing success story for online advertising. As of 2011, on average 20% of all advertising budgets Digital media and digital marketing are and will remain a in Europe were dedicated to online. One out of five advertising key growth engine of the economy in Europe. The sus- Euros is now invested in online platforms. tainable success of the digital economy continues even and especially in tough economic times. Not only the Initially, the IAB network discussed including 10 countries by 2010 rapid development of digital markets in Eastern Europe and hoped to reach an average of 10% online market share. The shows that this pan-European trend is far from coming reality today looks quite different. The 2011 AdEx Benchmark to an end - especially the remarkable figures in Europe’s includes 26 countries and the average online markets share in core countries just show that the digitization of the Europe is 20%. Despite the recession, our industry has been per- economy is continuing unabatedly. This also is reflected forming very well, growing 14.5% in 2011. Direct response and by the latest AdEx Benchmark report. branding formats are flourishing, indicating that advertisers are considering digital advertising for various aspects of their market- Thomas Duhr, Executive Sales Manager, ing and communication strategies. United Internet Media AG In 2011, media buyers invested 21 billion Euros online in our con- tinent, bringing our market close to the size of the US and also putting online within the top 3 media in each country, in terms of ad spend. The currency of our success is ‘data’ as it makes advertising more relevant for the consumer and more efficient for the advertiser. However, as we continue to integrate data in online advertising we have to act with respect, in order to build trust and transparency whilst maintaining standards and simplicity. Alain Heureux, CEO & President, IAB Europe © IAB Europe 3
  • 4.
    ABOUT THIS REPORT The sources of the online advertising spend data contained within this report are the annual industry benchmarking studies run by each national Interactive Advertising Bureau (IAB) in Europe. The national benchmarking studies represent the income of thousands of websites and online advertising businesses. The reported results are considered the closest measurement of online advertising revenues across Europe as the data is compiled directly by local IABs based on information supplied by compa- nies selling advertising online in each country. Only IABs that were able to provide 12 full months of advertising expenditure data are included. With the entry of IAB Serbia, the AdEx Benchmark cov- ered 26 local IABs in 2011. The data for this report is stated on the basis of actual gross in- come (the amount of actual spend invoiced by the publisher in- cluding any agency commission). To avoid any double-counting, production costs and pan-regional ad spend are taken out of the IHS Screen Digest does not audit the information or the data from figures provided by the local IABs. local IABs and provides no opinion or other form of assurance with respect to the information. Only aggregate results are published The report incorporates data from the following online advertising and individual company information is held in strict confidence by formats: the audit partners of local IAB studies. • Display • Classifieds & Directories • Paid-for-search Where national IABs report data for spend on mobile online adver- tising this is incorporated into the relevant advertising format total. IAB Europe in partnership with IHS Screen Digest collates and aggregates the data and makes the adjustments necessary to en- able the data to be comparable. Full details of this process for each country are provided in Appendix iv. The result is comparable data based on actual revenues from across Europe. This is the sixth edition of the report and therefore once again we are able to include year-on-year comparisons in for those countries that have provided data for at least two years. 4 IAB Europe AdEx Benchmark 2011
  • 5.
    EXECUTIVE SUMMARY Despite thecontinued weak macroeconomic conditions across In Europe, individual market growth in 2011 ranged from 55.5% Europe and globally, Europe’s online advertising market contin- in Russia and 40.0% in Croatia, to 5.5% in Norway and 4.6% in ued to grow double-digit in 2011. Investment in all online formats Romania. Central and Eastern European (CEE) markets increased increased during this period 14.5% year-on-year1, with paid- their share of total European online ad spend from 10.1% in 2010 for-search leading the surge, closely followed by display. Online to 11.8% in 2011. It is important to note that the UK and Germany growth outperformed the overall advertising market, which ex- alone account for 45.2% of all European online ad spend. Russia cluding online grew at a sluggish 0.8% in 2011. has established itself as the sixth biggest market with a value of €1.12bn, buoyed particularly by a surging search market. The European online advertising market crossed the €20 billion mark for the first time at €20.9 billion in 2011, up from €18.3 billion Paid-for-search and display drove online advertising growth in 2 in the previous year . Online accounted for 21.7% of European 2011. Increasing 17.9%, paid-for-search reached €9.72 billion, advertising spend. closely followed by display which rose by 15.3% to €7.03 billion. Even Classifieds & Directories, a format which usually suffers in The USA remains slightly ahead of Europe in terms of online ad- a tough economic environment due to high exposure to the job, vertising revenues which amounted to €24.5 billion in 2011 follow- real-estate, and automotive markets, increased by 5.7% in 2011 ing year-on-year growth of 21.9%. Apart from a healthy online in- to just over €4 billion. dustry, US growth also benefitted from the presidential primaries. The present report provides detailed analysis of developments in each format across the 26 participating countries. Online grows 14.5% in 2011 25 20 14.5% €20.9bn €18.3bn 15 €bn 10 European online advertising: year-on-year growth (%) 5 25 0 40.0% 2010 2011 21.3% 20 17.9% 16.1% 15.4% 15.3% 14.5% 15 Online ad spend: Europe vs USA % 10 7.4% 5.7% 25 5 €24.5bn 20 €20.9bn 0 €20.1bn Paid-for-search Display Classified & Total €18.3bn Directories 15 2010 2011 €bn 10 5 1. Year-on-year growth is calculated excluding the ‘other’ category to maintain comparability across countries. Serbia was an exception 0 to this rule, where most of ‘other’ constituted of social media spend, 2010 2011 which is normally reported as part of display advertising. 2. At constant 2011 currency exchange rates. Europe USA © IAB Europe 5
  • 6.
    SECTION 1 -AdEx Benchmark 2011 Analysis 2011 GROWTH IN CONTEXT ONLINE ADVERTISING STABILISES IN 2011 markets. Online was also affected, but nevertheless outperformed all other media and achieved an overall growth of 4.5%. Some Spend on European online advertising has grown every year since of the emerging online markets saw a slight decline though, as IAB Europe began benchmarking the market in 2006. the sector was still fragile. The overall growth was maintained by paid-for-search, which managed to grow 10.8% despite tough In 2007, spend on online advertising grew by 40%. This was economic conditions, as advertisers were reassured by the direct driven by substantial growth in the dominant high value Western response payment structure. European markets such as Germany, the UK, and France. In 2010, Europe’s online advertising industry rebounded with an As these markets matured in 2008, their growth decelerated and increase of 15.3%, indicating a recovery from the 2009 slowdown. clustered around 20%. High growth was still present in some Display led this surge with a 21.3% increase, as new advertisers emerging markets like Poland and Slovenia, however the total val- entered the medium and existing online advertisers increased their ue of these markets was not sufficiently large to have a substantial spend on branding campaigns. impact on the overall European growth rate. In 2011, online maintained its double-digit growth despite tough In 2009, the effect of the economic recession was strongly felt macroeconomic conditions with a year-on-year growth rate of in the advertising sector which saw significant declines in many 14.5%, indicating the ongoing confidence that advertisers place in online as an advertising medium. Online advertising growth over time 40% 40 35 30 25 % 20.2% 20 15.3% 14.5% 15 10 4.5% 5 0 2007 2008 2009 2010 2011 6 IAB Europe AdEx Benchmark 2011
  • 7.
    SECTION 1 -AdEx Benchmark 2011 Analysis 2011 GROWTH IN CONTEXT ONLINE OUTPERFORMED WEAK ECONOMY 2011, helped by the reliable measure of return-of-investment (ROI), as evidenced by the 17.9% increase in the format. Advertis- Advertising markets are in general very susceptible to changes in ers increasingly also recognise online as a brand advertising medi- the macroeconomic environment. In the context of the European um. This is reflected in a growing video share, which commanded sovereign debt crisis, high unemployment and cutbacks in con- 7.6% of all online display ad spend in 2011. sumer spending, advertising spend suffered disproportionately on most media in 2011. Secondly, the increased use of demographic, behavioural and other consumer data in online display advertising, paired with al- 1 Total European advertising across all media grew by 3.6% in gorithmic processing, allows enhanced targeting capabilities that 2011, but would have experienced a mere increase of 0.8% with- can improve cost efficiency. out the contribution of online. In Western Europe, total advertis- ing excluding online would have declined by 1.0%, but with the Thirdly, there is a long-term trend for advertisers to shift ad budg- 11.5% surge in online ad markets, the region ended the year with ets from mature to emerging markets, which is fuelling their online a growth of 1.3%. Online also lifted CEE markets from what would economy. in 2011, CEE countries constituted 11.8% of European have been a 5.5% growth in ad markets excluding online to a online ad spend, up from 10.1% in the previous year. 9.1% total media advertising growth rate year-on-year. In comparison to traditional media, online advertising is not as ex- posed to macroeconomic fluctuations. Firstly, online offers a diversity of formats and payment structures 1. The 26 countries participating in the study to choose from. Growth in paid-for-search remained resilient in Online advertising in context: Year-on-year growth 19.7% 20 14.5% 15 11.5% 10 9.1% % 5.5% 5 3.2% 3.6% 1.5% 1.3% 1.7% 0.8% 0 -1.0% WE CEE Total Europe -5 Nominal GDP All media advertising Online All media advertising excl. online © IAB Europe 7
  • 8.
    SECTION 1 -AdEx Benchmark 2011 Analysis 26 MARKETS IN PERSPECTIVE Volume – Online advertising spend distribution stable in 2011 2011 did not show any significant shifts in the composition of the top 10 countries investing in online advertising versus 2010. The most notable change was Russia’s assertion as the sixth largest online market in Europe at €1.12 billion, surpassing Spain, whose expenditure remained below €1 billion. Russia is still the only CEE market in the top 10 online advertising spenders, with a €752 million difference to the next country within the CEE region (Poland). The UK remained the largest online advertising market and is the first to have exceeded €5 billion. It accounted for 26% of all European online advertising, down from 27% in 2010. In second place, Germany’s share stood at 19% in 2011 corresponding to total market value of €4 billion. France maintained its bronze medal in 2011, whereas Italy surpassed the Netherlands to claim fourth place. The growth rates of these countries ranged between 8% and 15%, but were not significant enough to alter their ranking within the top 10. Top 10: Total by country 2011 and 2010 (€m) UK €5,510m Germany €3,959m France €2,287m Italy €1,249m Netherlands €1,200m Russia €1.121m Spain €925m 2011 2010 Sweden €687m Norway €558m Denmark €524m 0 1,000 2,000 3,000 4,000 5,000 6,000 Rest of Europe: Total by country 2011 and 2010 (€m) Poland €439m Switzerland €422m Belgium €365m Turkey €360m Austria €296m Czech Rep €269m Finland €254m Ireland €132m Hungary €108m Greece €100m 2011 Slovakia €45m 2010 Slovenia €32m Bulgaria €30m Croatia €26m Romania €22m Serbia €12m 0 100 200 300 400 500 8 IAB Europe AdEx Benchmark 2011
  • 9.
    SECTION 1 -AdEx Benchmark 2011 Analysis 26 MARKETS IN PERSPECTIVE Growth – CEE region outpaces Western Europe The markets which demonstrated the highest growth in online advertising in 2011 were countries from the CEE region. Russia led the group with a growth of 55.5%, driven mostly by a surging search market and expanding internet population. Croatia, Serbia, and Slove- nia which are display-driven markets, grew by 40.0%, 35.6%, and 31.1%. Slovakian and Polish online ad markets increased 29.7% and 23.1%, with strong growth across formats, while Turkey exhibited a robust growth rate at 22.4%. CEE countries grew the strongest in 2011 60 55.5% 50 40 40.0% 35.6% % 31.1% 30 29.7% 23.1% 22.4% 20 19.7% 15.5% 15.2% 15.1% 14.3% 14.2% 14.1% 13.5% 13.3% 12.8% 12.6% 11.3% 10.7% 11.0% 10 9.9% 8.8% 7.9% 5.5% 4.6% 0 ia ia ia ia ia d y e ly d rk n a n y s a y e y a ss oat rb en ak lan rke eec Ita rlan ma UK land de gari pai gar and stri an Rep gium anc land rwa ani Ru Cr Se Slov Slov Po Tu Gr e en itz D Ire Swe Bul S un erl Au erm ch el Fr Fin o om B N R H th G ze Sw Ne C CEE WE The Western European region also experienced healthy growth ranging from 5.5% in Norway, the most mature market with the highest online ad spend per capita, to 19.7% in Greece, a nascent country in terms of online advertising which demonstrates dynamics more representative of the CEE market, despite the country’s huge macroeconomic uncertainty. © IAB Europe 9
  • 10.
    SECTION 1 -AdEx Benchmark 2011 Analysis 26 MARKETS IN PERSPECTIVE Online share of total media ad spend – 1 in 5 European advertising Euros invested online Pairing online advertising data provided in this report with IHS Screen Digest valuations1 for all other media (television, print, cinema, radio, and out-of-home) reveals substantial variations in the online advertising market share across Europe. Higher market share indicates a more developed market, where the majority of advertisers invest in online in some way, and where ad- vertisers have a wide variety of formats and online channels from which to choose. Low market share for online advertising suggests that a market has headroom for growth, as it indicates that that there are still plenty of advertisers in the market who have not yet devoted themselves to the online medium. Online market share of total advertising ad spend across Europe reached 21.7% in 2011. This means that more than 1 in 5 European advertising Euros was invested online. The UK was the most developed online market in Europe at 35.9% share in 2011, while Greece despite its strong growth of 19.7%, occupied the last position with a share of 6.8%. Western European markets had a higher market share at 22.7% compared to the CEE equivalent of 16.9%. However, looking at national markets individually reveals that market shares within Western Europe on the one hand, and Central and Eastern Europe on the other are not homogeneous. For instance, Austria and Switzerland exhibit a low online share of their total media advertising spend at 13.0% and 13.9%, lower than most CEE countries. Market shares calculated from IAB Europe and IHS Screen Digest data may vary from those published in the local markets by the national IABs. This is because the national IABs may have used a source other than IHS Screen Digest for the valuation of the total advertising market in that country. 1. IHS Screen Digest valuations were used for all markets except for Poland and Hungary, upon request. For Poland we used Starlink figures and for Hungary we used Hungarian Advertising Association figures. 2011 online share of all media ad spend (%) 40 35.9% 35 30 28.9% 27.9% 27.9% 25 24.9% 23.4% 22.7% % 21.7% 21.4% 20.6% 20 18.8% 18.1% 17.1% 16.9% 16.2% 15.9% 15.9% 15.9% 15 15.2% 15.0% 14.8% 14.2% 13.9% 13.8% 13.0% 13.0% 10 7.3% 7.2% 5 6.8% 0 s k y y y y y UK Rep and ar rwa eden WE rope an ance gar enia gium CEE land land pain ssia Ital akia land garia rland rke oatia stria erbia ania eece m v S Ru lov Ire Bul itze ch herl Den No Sw Eu erm Fr Hun Slo Bel Po Fin Tu Cr Au S om Gr e Cz Net tal G S Sw R To 10 IAB Europe AdEx Benchmark 2011
  • 11.
    SECTION 1 -AdEx Benchmark 2011 Analysis 26 MARKETS IN PERSPECTIVE Online ad spend per capita – Scandinavian countries most mature in Europe Using IHS population numbers, ad markets exhibit variation in online spend per capita across the region. Online ad spend per capita is a metric that helps to evaluate the maturity and scope for development of a market. It shows how much an online consumer is worth in terms of advertising in a given market. By use of population data, online ad spend per capita uses a normalised basis and is therefore well-suited to compare and benchmark online advertising markets. It highlights the maturity of an online market ir- respective of its size or absolute revenues incurred. The most mature online markets in Europe in 2011 were the Scandinavian countries (Norway, Denmark, and Sweden) and the UK. Nor- way led at €113.4 per capita indicating that advertisers have already embraced online across formats. On the other hand, monetisation in Romania is still lagging behind as online ad spend per capita stood at a mere €1.0. The average online ad spend per capita in 2011 was €33.5, below which value we find all high growth markets, such as Russia, Croatia and Serbia at €7.8, €6.0 and €1.7 per capita. Online ad spend per capita in 2011 €113.4 120 €95.4 €87.8 Online ad spend/capita (€) 100 €72.8 €72.1 80 €53.4 €48.4 €47.1 60 €36.1 €35.1 €34.1 €33.5 €29.2 €25.6 40 €20.5 €19.5 €15.6 €11.5 €10.8 €8.8 €8.2 €7.8 20 €6.0 €4.9 €4.1 €1.7 €1.0 0 ay rk s y y y y UK eden and rland an land ance stria gium Avg land Rep Ital pain enia land gar eece akia ssia oatia rke garia erbia ania rw ma rl S lov Po un Gr v Ru Tu Bul No Den e Sw the witz Ge rm Fin Fr Au Bel ean Ire ech S H Slo Cr S om R Ne S ro p Cz Eu Online ad spend per capita has grown persistently despite adverse external conditions or the state of all other media advertising since 2005. Whereas total ad spend per capita and TV ad spend per capita fell in 2009 (during the recession) and have yet to return to 2008 levels, online has consistently increased its ad spend per capita, steadily catching up to TV ad spend per capita. This points towards an improved monetisation of online audiences over time. Online ad spend per capita continues to grow despite total ad spend per capita decline Online ad spend/capita (€) 150 120 90 60 30 0 2005 2006 2007 2008 2009 2010 2011 Online TV Total Media © IAB Europe 11
  • 12.
    SECTION 1 -AdEx Benchmark 2011 Analysis SHARE OF FORMATS In 2011, paid-for-search remained the largest segment of online Paid-for-search remains the largest segment advertising. Both paid-for-search and display formats increased their share of online advertising. Paid-for-search climbed from 100 45.1% in 2010 to 46.5% in 2011. Display had a share of total on- 20.9% 19.3% line advertising of 33.4% in 2010 and managed to arrive at 33.6% 80 in 2011. This was at the expense of Classifieds & Directories, 60 45.1% 46.5% % whose share of the online ad pie diminished from 20.3% in 2010 40 to 19.3% in 2011. Its share loss is due to the faster expansion of the other formats and an adverse economic environment to which 20 33.4% 33.6% the category is particularly susceptible. 0 2010 2011 Display Paid-for-search Classifieds & Directories Other Share of formats by region Western Europe: share of formats in 2011 CEE: share of formats in 2011 0.7% 0.6% 6.9% 20.9% 32.0% 45.1% 47.4% 46.3% Display Display Paid-for-search Paid-for-search Classified & Directories Classified & Directories Other Other Paid-for-search dominated Western European online ad spend in 2011, accounting for 46.3% of the total. Display came second with 32.0%. The Central and Eastern European online advertising market in aggregate is evenly divided among paid-for-search at 47.4% and display at 45.1%. Due to a strong Russian search market, making up 60.8% of the national online advertising total, the role of search across the region is positively skewed. Excluding Russia, display appears as the prominent format in the region at 50.0% as search is lagging behind in most markets at 36.3% on average. 12 IAB Europe AdEx Benchmark 2011
  • 13.
    Section 2 -Online advertising overview by sector DISPLAY Display surge persists in 2011 YoY growth in European Display 2007-2011 • Value: €7.03bn 45 39.0% • Accounts for 33.6% of all online advertising spend 40 • YoY growth of 15.4% 35 30 • Top five countries by value: Germany, UK, France, Italy, % 25 21.3% Netherlands 20 15.1% 15.4% • Top five by growth: Serbia, Croatia, Russia, Slovakia, 15 10 Slovenia 0.3% 5 0 2007 2008 2009 2010 2011 At 15.4% growth, display ad spend grew again double-digit in 2011, following 21.3% in 2010. This reinforced the strength of the format, which even in an economically weaker 2011 managed to grow at similar levels to 2010, when it took advantage of an automatic rebound in advertising investments after the 2008 and 2009 recession. Despite this growth however, display’s share of online ad spend remained static at 33.6%, only 0.2% higher than in 2010. There is a number of trends behind this development as advertisers are both increasing ad spend on branding campaigns, but also invest- ing more in data-driven display advertising. Furthermore, online display advertising is increasingly benefitting from growth in pan-regional ad spend. This approach is widespread in TV and online can leverage this as TV and online are increasingly booked in conjunction rather than against each other. Online branding campaigns The increase in online branding campaigns of 2010 continued in 2011. This is apparent as more FMCG companies invested in online display. In the UK, for instance, consumer goods constituted 14.8% of display spending, only second after financial services at 15.0%. In 2011, branding campaigns made up 42.3% of UK online display, up from 40% in 2010.This represents a 26.1% increase in online display brand advertising versus 13.4% for total display. Furthermore, online video, the online format that most resembles TV as an effective brand messenger, is also becoming more prominent. In 2011, it made up 7.6% of European online display with two markets (UK, Germany) spending over €100 million on video ads. Data-driven display Display advertising growth was also driven by the application of so-called ‘big data’. Big data relies on the rich metrics received through the online medium to plan display advertising. Using ad exchanges, real-time bidding and algorithmic trading, advertisers can reach both broad and niche audiences that meet their exact criteria. These data-driven techniques can increase the cost-efficiency of online advertis- ing, maximising cheaper, remnant inventory to reach consumers. © IAB Europe 13
  • 14.
    Section 2 -Online advertising overview by sector DISPLAY Top 10: Display value by country 2011 and 2010 (€m) Germany €1,379m UK €1,299m France €636m Italy €556m Netherlands €468m Russia 2011 €439m Spain 2010 €402m Sweden €242m Poland €198m Norway €198m 500 1000 1500 Rest of Europe: Display value by country 2011 and 2010 (€m) Denmark €186m Turkey €170m Switzerland €151m Czech Rep €142m Austria €106m Belgium €105m Finland €102m Hungary €55m Ireland €52m Greece €36m 2011 Slovenia €25m Slovakia €24m 2010 Romania €20m Bulgaria €16m Croatia €14m Serbia €7m 50 100 150 200 Advertising beyond the banner: Advertisers are experi- Branding is the big trend and a key for digital evolu- menting with long form storytelling on the web enabling tion! More than any other approach in online marketing, them to better connect with consumers, and to deliver branding will truly revolutionize digital advertising. While their brand goals. Richer creative canvases, multi-screen performance goals are still working fine in their seg- touch points, and branding metrics to prove success, ments, only branding has the strength to pave the way along with the power of consumers acting as re-circula- for the big advertisers to use the internet for mass reach tors of brands’ communications are all fuelling growth in campaigns as in TV or print. Even further than in classic this area. Premium brand advertising is finding a home media, the vast opportunities digital media has to offer on the web. such as targeting and data, will take campaign plan- ning as well as efficiency to a whole new level. Many big Laura Chaibi, Research Director EMEA, Yahoo! brands are starting to make online their home already - the others will follow without a doubt. Stephan Nöller, CEO, nugg.ad 14 IAB Europe AdEx Benchmark 2011
  • 15.
    Section 2 -Online advertising overview by sector DISPLAY Display value and growth 1,600 60% 1,400 50% 1,200 40% 1,000 30% 800 600 20% 400 10% 200 Ge U F It N R S S P N D Tu S C A B F H Ir G S S R B C S 0% rm K ranc aly eth uss pain wed olan orw enm rke witz zec ustr elgi inlan ung elan ree love lova om ulga roa erbi er ia en d ay ar y er h R ia um d ar d ce n an tia a an y e lan k lan e y ia kia ia ria ds d p Value (€m) YoY Growth (%) Top 10: 2011 YoY Display growth by country Serbia Croatia Russia Slovakia Slovenia Ireland Greece Turkey Spain Austria 0 10 20 30 40 50 60 % Rest of Europe: 2011 YoY Display growth by country Finland Italy Germany Poland France UK Netherlands Denmark Switzerland Czech Rep Sweden Belgium Bulgaria Romania Norway Hungary 0 2 4 6 8 10 12 14 16 18 20 % © IAB Europe 15
  • 16.
    Section 2 -Online advertising overview by sector CLASSIFIEDS & DIRECTORIES 1 Classifieds & Directories ad spend increased despite shaky economy • Value: €4.03bn • Accounts for 19.3% of all online advertising spend • YoY growth of 5.7% • Top five countries by value: UK, France, Germany, Norway, Italy • Top five by growth: Slovakia, Poland, Serbia, Hungary, Spain Classifieds & Directories grew 5.7% in 2011, less than the format’s 7.5% increase in 2010. This is due to the weakening of the European economy. Classifieds & Directories advertising is dominated by the job, real estate, and automotive sectors. The adverse macroeconomic conditions with struggling job, real estate, and automotive markets, generated more caution among advertisers when investing in Clas- sifieds & Directories ads. Top 10: Classifieds & Directories value by country 2011 and 2010 (€m) UK €905m France €739m Germany €712m Norway €243m Italy €239m Netherlands €202m 2011 Sweden €201m 2010 Switzerland €143m Belgium €120m Denmark €113m 200 400 600 800 1,000 1. Classifieds & Directories ad spend is available for 25 countries. Russia has not been included in this category on instructions by IAB Russia. 16 IAB Europe AdEx Benchmark 2011
  • 17.
    Section 2 -Online advertising overview by sector CLASSIFIEDS & DIRECTORIES Rest of Europe: Classifieds & Directories value by country 2011 and 2010 (€m) Poland €81m Finland €81m Austria €68m Spain €64m Turkey €29m Ireland €26m Czech Rep €25m 2011 Hungary €17m 2010 Slovakia €7m Croatia €5m Greece €5m Bulgaria €3m Slovenia €1m Serbia €1m Romania €0.2m 10 20 30 40 50 60 70 80 90 Classifieds & Directories value and growth 1,000 40% 900 30% 800 20% 700 10% 600 0% 500 -10% 400 -20% 300 -30% 200 -40% 100 0 -50% e y y y s n k a n y y a a e a a a a UK anc an rwa Ital and de land gium ar land land stri pai rke land Rep gar aki oati eec gari eni rbi ani F r erm o N rl we zer el enm Po Fin Au e S it B D S Tu Ire ch un lov Cr Gr S ul lov Se om B S G th e H R Ne Sw Cz Value (€m) YoY growth (%) © IAB Europe 17
  • 18.
    Section 2 -Online advertising overview by sector CLASSIFIEDS & DIRECTORIES Top 10: 2011 YoY Classifieds & Directories growth by country Slovakia Poland Serbia Hungary Spain Croatia Turkey Switzerland Italy Greece 0 5 10 % 15 20 25 30 35 Rest of Europe: 2011 YoY Classifieds & Directories growth by country Finland Sweden Belgium Netherlands UK Slovenia Germany Norway Austria France Denmark Ireland Bulgaria Czech Rep Romania -50 -40 -30 -20 -10 0 10 % 18 IAB Europe AdEx Benchmark 2011
  • 19.
    Section 2 -Online advertising overview by sector PAID-FOR-SEARCH Paid-for-search reclaims status as fastest- YoY growth in European Search 2007-2011 growing segment 45 39.0% • Value: €9.72bn 40 36.0% 35 • Accounts for 46.5% of all online advertising spend 30 • YoY growth of 17.9% % 25 17.9% 20 16.1% • Top five countries by value: UK, Germany, France, Russia, 15 and Netherlands 10 10.8% • Top five countries by growth: Romania, Slovenia, Russia, 5 Croatia, and Poland 0 2007 2008 2009 2010 2011 In 2011, paid-for-search reclaimed its status as fastest growing segment of online advertising after display growth outperformed search in 2010. It was the sole online format which experienced growth acceleration at 17.9% in 2011, up from 16.1% in 2010. Amounting to €9.72 billion, paid-for-search accounted for 46.5% of total online advertising in 2011 and remains the biggest part of online advertising spend. Paid-for-search has seen robust growth in many emerging markets with nine countries experiencing growth above 30% year-on-year. Ro- mania, Slovenia, and Russia increased the size of their search market by over half of its value in 2010 at 69.9%, 66.7%, and 62.6% growth. This is because CEE markets, with the exception of Russia, are generally display-driven and had been lagging behind in development for the paid-for-search format. Paid-for-search growth is still strong in mature markets with all but one country experiencing double-digit growth. This confirms the success of the format’s return-on-investment propositions. It is also indicative of innovation in search. Paid-for-search has expanded into video and location-based services and is also used in cross-media campaigns. Top 10 : Search value by country 2011 and 2010 (€m) UK €3,187m Germany €1,868m France €913m Russia 2011 €681m Netherlands €530m 2010 Spain €460m Italy €448m Sweden €233m Denmark €223m Poland €159m 500 1,000 1,500 2,000 2,500 3,000 3,500 © IAB Europe 19
  • 20.
    Section 2 -Online advertising overview by sector PAID-FOR-SEARCH Rest of Europe: Search value by country 2011 and 2010 (€m) Turkey €152m Belgium €140m Switzerland €129m Austria €122m Norway €118m Czech Rep €102m Finland €72m Greece €60 2011 Ireland €54 2010 Hungary €35 Slovakia €13 Bulgaria €11 Croatia €7 Slovenia €5 Serbia €2 Romania €1 20 40 60 80 100 120 140 160 Search Value and growth 2011 80% 3,500 70% 3,000 60% 2,500 50% 2,000 40% 30% 1,500 20% 1,000 10% 500 0% 0 -10% y e a s n y n k y a y e y a a a a a a UK an anc ssi nd pai Ital de ar land rke ium land stri rwa Rep land eec land gar aki gari oati eni rbi ani m Fr Ru rla S g we enm Po Tu Bel itzer Au No ech Fin Gr Ire Hun Slov Bul Cr Slov Se om er e S D G th R Ne Sw Cz Value (€m) YoY growth (%) 20 IAB Europe AdEx Benchmark 2011
  • 21.
    Section 2 -Online advertising overview by sector PAID-FOR-SEARCH Top 10: 2011 YoY search growth by country Romania Slovenia Russia Croatia Poland Serbia Bulgaria Hungary Turkey Sweden 0 10 20 30 40 50 60 70 80 % Rest of Europe: 2011 YoY search growth by country Switzerland Denmark Slovakia Greece Czech Rep Italy UK Ireland Netherlands Belgium Norway Austria Germany Spain France Finland -5 0 5 10 15 20 25 30 % © IAB Europe 21
  • 22.
    Section 2 -Online advertising overview by sector MOBILE Mobile still a nascent medium Mobile display as a share of online display in 2011 While mobile advertising is still a nascent medium, it is becom- 6 ing increasingly prominent in campaigns. The IAB Europe AdEx 5 €5.3% Benchmark 2011 study received mobile display advertising 5.2% 4 ad spend from 14 markets. In 2011, mobile display advertising % 3 ranged from €0.1 million in Serbia to €69.1 million in the UK, with 3.7% 3.6% mature markets investing more in mobile display than the CEE 2 3.6% 0.7% 0.7% 0.5% 2.3% 2.2% 2.2% 1.8% 1.7% 1.5% region. Although these figures are still comparatively small, mo- 1 bile display has been increasing rapidly as a share of total display, 0 e n y y k s n y y a a reaching values that range from 0.5% in the Czech Republic to UK anc pai Ital rwa ar and de rke gar stri erbi land Rep m l e Tu un Fr S No Den ther Sw H Au S Po ech 5.3% in the UK. Ne Cz A small number of markets also supplied data for search and mes- saging. In the UK mobile search advertising amounted to €154.3 Smartphone penetration in Europe 2005-2016 million. Messaging was reported in Italy at €5.8m and Turkey at €9.3 million. 80 70 Mobile display advertising growth surged in 2011 as mobile in- 60 creasingly becomes a staple item in media plans. Growing organi- 50 % cally from a low basis, rising smartphone penetration, increased 40 30 data traffic and proliferation of the advertising ecosystem are key 20 factors behind this development. For instance, in 2011 mobile 10 display advertising grew by 124.0% in the UK and by 178.2% in 0 2011 2014 2015 2016 2005 2006 2007 2008 2009 2010 2013 2012 Sweden. Source: IHS Screen Digest This trend is set to continue as the addressable market for mobile advertising grows over time. As IHS Screen Digest data suggests, smartphone penetration in Europe reached 31.0% in 2011 and is Looking at our ad network from the global perspective, expected to grow to 77% by 2016. it’s clear that Android and iOS are by an immense dis- tance the two dominant platforms. Between them they Mobile display ad spend in 2011 (€m) account for 83% of all mobile ad activity worldwide, with 80 70 45% accounted for by iOS. The IAB’s data for mobile €69.1m 60 advertising spend is very consistent with our regional €33.0m 50 reach figures, showing that, when we compare value and €m 40 €19.9m spend with sufficiently large sample sizes, correlations €14.9m 30 €10.4m emerge that enable us to draw meaningful insights. €7.0m €5.3m €4.3m €3.0m €1.6m 20 €1.4m €0.9m €0.7m €0.1m 10 Paul Childs, CMO, Adfonic 0 e y s y n k y a y a UK anc Ital pain and rwa de ar rke stri land gar Rep erbi Fr S erl No we enm Tu Au Po un ch S th S D H ze Ne C 22 IAB Europe AdEx Benchmark 2011
  • 23.
    Section 2 -Online advertising overview by sector VIDEO Video now accounts for 7.6% of online display provides further opportunity for online video advertising as the ad- dressable market in time spend, user base and available content AdEx Benchmark 2011 includes online video advertising figures grows further. for 15 markets. On average, video represents 7.6% of the total online Display market value. It ranges from its highest at 9.8% in Both Western Europe and the CEE region are benefitting from Sweden to 0.6% in Hungary. In Germany and the UK, video has the increase in online video advertising. In 2011, online video ad- already crossed the €100 million threshold. In the UK the market vertising grew irrespective of geography. The UK saw the highest is worth € 125.5m; in Germany €117.4 million. increase of 132.9%, while Sweden grew by 54.2%. CEE countries were not behind in this trend, with the Czech Republic expanding 94.1% in its online video advertising spend and Poland growing Total video ad spend (€m) 46.4% year-on-year. 150 Online video consumption: Big Five markets 120 €125.5m €117.4m 25 90 20 €35.3m Hours (billions) €23.8m 60 €21.1m 15 €11.6m €11.1m €10.3m €8.4m €4.3m €3.4m €2.2m €1.4m €0.4m €0.2m 30 10 0 5 y s n n y y a k a y a UK an and de pai land rke rwa Rep land stri ar aki gar ani e S o Tu o h Ire m l er ther Sw P N ze c Au enm Slov Hun om G e D R 0 N C 05 06 07 08 09 10 11 12 13 14 15 16 20 20 20 20 20 20 20 20 20 20 20 20 FTV long-form TV FTV short-form TV UGC FTV short-form TV Transactional TV Video as a share of online display Source:IHS Screen Digest 10 9.8% 9.7% There are two factors influencing the evolution and 8.5% 8 growth of video advertising at the moment: the first is 8.3% 7.6% 7.5% the advent of mobile and connected TV - the devices 6.5% 6 % 5.9% 5.8% 5.8% via which the content is being accessed. The other is 5.3% 5.2% 4 the nature of the content itself. One factor which drives 1.2% 1.2% 3.2% online video consumption is technical developments. 0.6% 2 This includes the increasing ubiquity of connected TVs 0 n K y d g s y p ia d in y ia rk ia ry as well as the mobile communication standard LTE and de U man elan Av land urke Re vak olan pa rwa ustr ma an nga Swe er Ir ean ther T ech Slo P S o A en om u N G D R H its rapidly increasing coverage. The biggest growth for op e Cz Eur N video advertising with additional emphasis on content Online video consumption continues to increase, and according will lie outside of traditional TV broadcasting. We’re see- to IHS Screen Digest forecasts it will surpass 20 billion hours a ing a huge spike in gaming, music and social apps. year by 2015 across the online population in the European Big 1 Five . This increase is primarily driven by rising consumption of Roland Schaber, COO of smartclip, the multiscreen and free-to-view (FTV) TV and user-generated content (UGC). This brand advertising platform of Adconion Media Group 1. This includes the UK, France, Germany, Italy, and Spain. © IAB Europe 23
  • 24.
    Section 3 -Overview by country WESTERN EUROPE Western Europe UK Germany Crossing the €5 billion mark for the first time, the UK’s online ad- The second largest market in the AdEx Benchmark, Germany has vertising ad spend is still the largest in Europe and accounts for the most valuable display sector in Europe at €1.38 billion after 26% of the total in the AdEx Benchmark. Paid-for-search is the growing at a strong 15.0%. Paid-for-search remains the domi- dominant category contributing 58% to total online advertising nant format in Germany at 47.2%, accounting for €1.87 billion of spend. The UK online advertising market grew by 14.4%, in 2011, the €3.96 billion German online ad spend. Germany maintained keeping in line with overall European online advertising market double-digit growth at 11.0% fuelled by a booming display sector. growth of 14.5%. The UK online advertising market also has the highest share of all media advertising in Europe, at 35.9%. 2011 Online Ad Spend €3,959m 2011 YoY growth 11.0% 2011 Online Ad Spend €5,510m Online as a proportion of total media ad spend 21.4% 2011 YoY growth 14.4% Online ad spend per capita €48.4 Online as a proportion of total media ad spend 35.9% Online ad spend per capita €87.8 Spend by format and by country: Western Europe (€m) 6,000 5,000 4,000 3,000 2,000 1,000 0 UK Germany France Italy Netherlands Spain Sweden Norway Denmark Switzerland Belgium Austria Finland Ireland Greece Display 1,299 1,379 636 556 468 402 242 198 186 151 105 106 102 52 36 Classifieds 905 712 739 239 202 64 201 243 113 143 120 68 81 26 5 Search 3,187 1,868 913 448 530 460 233 118 223 129 140 122 72 54 60 Other 119 - - 6 - - 11 - 2 - - - - - - 24 IAB Europe AdEx Benchmark 2011
  • 25.
    Section 3 -Overview by country WESTERN EUROPE France Netherlands Europe’s third largest online advertising market grew slower than The Netherlands slipped back into fifth position in 2011, overtaken the two strongest online ad markets in 2011 at 8.8%. This is due by Italy at €1.20 billion in online ad spend. The Dutch market grew to the strength of the Classifieds & Directories segment at 32% 12.6% year-on-year, slightly slower than in 2010 (13.8%). With on- online share in France, which in an adverse economic environ- line accounting for 27.9% of total ad spend and online ad spend ment increased only 3.5% in 2011, stunting the French online capita of €72.1, the Netherlands is one of the most mature online ad market with otherwise healthy-growing display and paid-for- advertising market in Europe. search formats at 13.6% and 10.0%, respectively. France’s online market share of total ad spend increased from 19.8% in 2010 to 2011 Online Ad Spend €1,200m 21.3% in 2011 in line with the European average of 21.7%. 2011 YoY growth 12.6% Online as a proportion of total media ad spend 27.9% Online ad spend per capita €72.1 2011 Online Ad Spend €2,287m 2011 YoY growth 8.8% Online as a proportion of total media ad spend 21.3% Spain Online ad spend per capita €36.1 Spain is the seventh largest online market, overtaken by a fast- growing Russia in 2011. It saw a growth of 13.3% mostly driven Italy by a surging display segment. With 15.9% market share and on- In 2011, Italy overtook the Netherlands to reclaim its position as line ad spend capita of €19.5, it is still a relatively nascent market the fourth largest online advertising market at €1.25 billion. Apart indicating room for future growth of online ad spend. from Greece, which generally exhibits CEE characteristics (such 2011 Online Ad Spend €925m as fast growth), Italy was the fastest growing online market in 2011 YoY growth 13.3% Western Europe at 15.5%. This was driven by strong surges in Online as a proportion of total media ad spend 15.9% both Paid-for-search at 17.9% and Display at 16.3% year-on-year Online ad spend per capita €19.5 growth. Display remains the largest segment in the Italian online advertising market at 44.5% share, in 2011. Sweden 2011 Online Ad Spend €1,249m At €687 million, Swedish online advertising spend topped the 2011 YoY growth 15.5% Scandinavian region in 2011. It grew 14.1%, fuelled by a surg- Online as a proportion of total media ad spend 15.2% ing search market. Increasing by 27.5%, paid-for-search now ac- Online ad spend per capita €20.5 counts for 34.0% of all online ad spend, however display remains Sweden’s largest format at 35.2%. Sweden is one of Europe’s most mature online market at 23.4% online share of total media ad spend and online ad spend per capita of €72.8. 2011 Online Ad Spend €687m 2011 YoY growth 14.1% Online as a proportion of total media ad spend 23.4% Online ad spend per capita €72.8 © IAB Europe 25
  • 26.
    Section 3 -Overview by country WESTERN EUROPE Norway Belgium Norway is Europe’s most mature market with an online ad spend per capita value of €113.4 and hence it is not surprising that it Belgium experienced modest growth in 2011 at 9.9%. Paid-for- experienced relatively weak growth of 5.5% in 2011. It has the search remains the dominant format of the €365 million market, strongest Classifieds & Directories market in Europe at 43.5% accounting for 38.3% of online ad spend. of total online. Display is also strong at 35.4% share of online, boosted by increased investment in video, which amounted to 2011 Online Ad Spend €365m €10.3 million in 2011. 2011 YoY growth 9.9% Online as a proportion of total media ad spend 17.1% Online ad spend per capita €34.1 2011 Online Ad Spend €558m 2011 YoY growth 5.5% Online as a proportion of total media ad spend 24.9% Austria Online ad spend per capita €113.4 Austrian online ad spend grew 11.3% in 2011, driven by strong display growth of 16.6%, particularly in online video. Austria is still a nascent market at 13.0% online share of total media ad spend Denmark and online ad spend per capita of €35.1. Similarly to Norway, Denmark is one of Europe’s most mature markets at 27.9% online share of total advertising and €95.4 on- 2011 Online Ad Spend €296m line ad spend per capita. The Danish market grew 15.1% in 2011 2011 YoY growth 11.3% to €524 million. Online as a proportion of total media ad spend 13.0% Online ad spend per capita €35.1 2011 Online Ad Spend €524m 2011 YoY growth 15.1% Finland Online as a proportion of total media ad spend 27.9% Online ad spend per capita €95.4 The Finnish online market reached €254 million in ad spend in 2011, following growth of 7.9%. It is one of the largest display markets in Europe in terms of proportion with 40.0% of online ad Switzerland spend invested in display. Switzerland continued to see strong growth in 2011 at 15.2%, above the 14.5% European average. It is still an emerging online 2011 Online Ad Spend €254m market at 13.9% online share of total media ad spend. In 2011, 2011 YoY growth 7.9% the Swiss market surpassed Belgium in terms of online ad spend Online as a proportion of total media ad spend 15.9% at €422 million, the largest part of which was display at 35.7% Online ad spend per capita €47.1 online share. 2011 Online Ad Spend €422m 2011 YoY growth 15.2% Online as a proportion of total media ad spend 13.9% Online ad spend per capita €53.4 26 IAB Europe AdEx Benchmark 2011
  • 27.
    Section 3 -Overview by country WESTERN EUROPE Ireland For a second year in a row, Ireland had the fastest growing display The integration of pan regional digital and TV brand cam- sector in Western Europe (21.7% year-on-year). At 14.8% online paigns is on the up. The industry has generally believed share of total media spend and €29.2 online ad spend per capita, pan regional TV spend would diminish with the phenom- Ireland still has room for growth. enal growth of online. By comparison, we are increas- ingly seeing clients who want to take advantage of the 2011 Online Ad Spend €132m reach available by combining both TV and online. The 2011 YoY growth 14.2% same applies when considering video and mobile. Whilst Online as a proportion of total media ad spend 14.8% still relatively nascent, pan regional video advertising is Online ad spend per capita €29.2 on the up. As new technologies, including responsive design come to market, we expect the trend to continue. The UK remains the powerhouse of pan regional ad Greece spend, although more and more we are experiencing Western Europe’s smallest online advertising market was also the increased digital spend from markets such as France, region’s fastest in growth at 19.7%. For the first time, Greece re- Germany and Switzerland as the luxury sector experi- ported triple-digit ad spend in online at just over €100 million in ences rapid growth. 2011. Tom Bowman, VP Strategy, Solutions and Sales 2011 Online Ad Spend €100m Operations, BBC Advertising 2011 YoY growth 19.7% Online as a proportion of total media ad spend 6.8% Online ad spend per capita €8.8 UK online ad revenues broke through 5bn Euros in 2011 - accounting for nearly 30% of total advertising – powered by strong performances in video, social and mobile. British consumers are now spending 40% of their internet time on entertainment and social sites, and this is reflected in the strong performance from packaged goods advertisers, who now represent nearly 15% of total display spend. In the tough economic climate marketers were looking for accountability, and paid search duly rose by an impressive 17.5% to pass the 3bn Euro mark. We expect these trends in brand and direct response growth to continue in 2012, despite the challenging conditions. Arguably the most mature market in Europe, it’s pleasing to see that the UK’s contribution helped boost online’s share across Europe to hit the magic 20% figure. Guy Phillipson, CEO, IAB UK © IAB Europe 27
  • 28.
    Section 3 -Overview by country CENTRAL & EASTERN EUROPE Central Eastern Europe Russia Poland In 2011, Russia crossed the €1 billion mark to replace Spain as Poland was the second largest CEE online advertising market the sixth largest online advertising market. It grew the fastest at a at €439 million in 2011. It experienced strong growth of 23.1%, 55.5% propelled by a surging search market of 62.6%. However, boosted by paid-for-search, which increased 36.9% year-on-year. Russia is not only a strong paid-for-search market; it was also the Poland is still however dominated by the display sector which ac- third fastest growing country in the display segment. High in vol- counts for 45.2% of its total online ad spend. ume and growth, Russia is still an emerging market at €7.8 online ad spend per capita, indicating further potential for growth. 2011 Online Ad Spend €439m 2011 YoY growth 23.1% Online as a proportion of total media ad spend 16.2% Online ad spend per capita €11.5 2011 Online Ad Spend €1,121m 2011 YoY growth 55.5% Online as a proportion of total media ad spend 15.9% Online ad spend per capita €7.8 Spend by format and by country: Central and Eastern Europe (€m) 1,200 1,000 800 600 400 200 0 Russia Poland Turkey Czech Rep Hungary Slovakia Slovenia Bulgaria Croatia Romania Serbia Display 439 198 170 142 55 24 25 16 14 20 7 Classifieds - 81 29 25 17 7 1 3 5 - 1 Search 681 159 152 102 35 13 5 11 7 1 2 Other - - 9 - 2 - - 1 - - 3 28 IAB Europe AdEx Benchmark 2011
  • 29.
    Section 3 -Overview by country CENTRAL & EASTERN EUROPE Turkey Slovakia Turkey saw strong growth across all sectors resulting in an overall After a small decline in 2009 and a 10% growth rate in 2010, Slo- increase of 22.4%. The Turkish online market is still dominated vakia is a booming online advertising market, expanding 29.7% by display, which accounts for 47.2% of total online ad spend, in 2011. This growth was largely driven by the display sector although paid-for-search is catching up at 42.1% share of online. which grew 31.6% and accounts for 53.9% of Slovakian online ad spend. 2011 Online Ad Spend €360m 2011 YoY growth 22.4% 2011 Online Ad Spend €45m Online as a proportion of total media ad spend 13.8% 2011 YoY growth 29.7% Online ad spend per capita €4.9 Online as a proportion of total media ad spend 15.0% Online ad spend per capita €8.2 Czech Republic Czech Republic is CEE’s most mature market at €25.6 online ad Slovenia spend per capita. The majority of Czech Republic’s €269 million is 2011 was a good year for the Slovenian online advertising market, display advertising. Although it grew slower than paid-for-search which experienced 31.1% growth. Slovenia is the most display- in 2011, it still accounts for 52.9% of total online ad spend. heavy market in Europe with display accounting for 80.3% of total online advertising. 2011 Online Ad Spend €269m 2011 YoY growth 10.7% 2011 Online Ad Spend €32m Online as a proportion of total media ad spend 28.9% 2011 YoY growth 31.1% Online ad spend per capita €25.6 Online as a proportion of total media ad spend 18.1% Online ad spend per capita €15.6 Hungary In 2011, Hungary experienced 12.8% growth, relatively slow for Bulgaria the CEE region. After the Czech Republic, it is the second most An emerging market with a mere €4.1 in online ad spend per cap- mature market at 18.8% online share of total media spend and ita, Bulgaria is seeing an acceleration in its growth in online ad- online ad spend per capita of €10.8. Hungary’s online advertising vertising. In 2011, the Bulgarian online market increased 13.5%, market is dominated by display which accounts for 50.5% of total almost twice as fast as in 2010. Similar to the rest of the CEE online ad spend. region, the majority of Bulgarian online ad spend is display adver- tising, accounting for 51.8% of the total. 2011 Online Ad Spend €108m 2011 YoY growth 12.8% 2011 Online Ad Spend €30m Online as a proportion of total media ad spend 18.8% 2011 YoY growth 13.5% Online ad spend per capita €10.8 Online as a proportion of total media ad spend 14.2% Online ad spend per capita €4.1 © IAB Europe 29
  • 30.
    Section 3 -Overview by country CENTRAL & EASTERN EUROPE Croatia After Russia, Croatia was the second fastest-growing market in Growth of the Russian online advertising market is driven Europe in 2011 at 40.0%. Growth in the Croatian market was driv- by a number of factors: large and continuing growth en by both display and paid-for-search, which increased 47.2% of addressable audience (currently about 50% internet and 47.3% respectively since 2010. penetration) and the presence of strong local players such as Yandex, Mail.Ru Group , VK.COM. This in turn allows competition on a global scale and fuels ongoing 2011 Online Ad Spend €26m investment in the online area including innovation in ICT. 2011 YoY growth 40.0% We expect that these dynamics will help to maintain high Online as a proportion of total media ad spend 13.0% Online ad spend per capita €6.0 growth of online advertising in Russia for the next 2-3 years. Romania Boris Omelnitskiy, President, IAB Russia Romania grew 4.6% in 2011, which although low in comparison to other European countries, is high for a country whose total me- dia advertising was rapidly declining. With 7.2% online share of to- tal media ad spend and €1.0 online ad spend per capita, Romania has much room for growth in the sector. The Turkish online advertising market continues to grow double-digit in 2011. This has been driven by expansion 2011 Online Ad Spend €22m of social media, video advertising and the rising e-com- 2011 YoY growth 4.6% merce advertising. The search market is also expanding Online as a proportion of total media ad spend 7.2% in Turkey and becoming particularly prominent among Online ad spend per capita €1.0 SME companies, which benefit from the ROI-centric format. With its young, innovative and multi-cultural digitalized generation, the Turkish market is becoming Serbia important both in Western and Eastern markets as inter- Europe’s smallest online advertising market, worth €12 million, national advertisers are keen to reach those consumers. was also the third-fastest in terms of growth at 35.6%. Most of Serbia’s growth came from display, which accounts for 57.6% of Neslihan Mesutoglu, General Manager at Turkuvaz Media the online advertising market. Advertising Marketing/Digital 2011 Online Ad Spend €12m 2011 YoY growth 35.6% Online as a proportion of total media ad spend 7.3% Online ad spend per capita €1.7 30 IAB Europe AdEx Benchmark 2011
  • 31.
    Section 4 -Background Data TOP PROPERTIES DECEMBER 2011 Austria Belgium Media Total Unique % Reach Media Total Unique % Reach Visitors (000) Visitors (000) Total Internet Audience: Age 15+ 4,756 100.0 Total Internet Audience: Age 15+ 6,088 100.0 Google Sites 4,480 94.2 Google Sites 5,824 95.7 Facebook.com 3,334 70.1 Microsoft Sites 5,408 88.8 Microsoft Sites 2,917 61.3 Facebook.com 4,734 77.8 Amazon Sites 2,172 45.7 Wikimedia Foundation Sites 2,645 43.5 Wikimedia Foundation Sites 2,043 43.0 Yahoo! Sites 2,228 36.6 Glam Media 1,586 33.3 VEVO 2,172 35.7 Yahoo! Sites 1,489 31.3 Corelio 2,168 35.6 VEVO 1,473 31.0 Belgacom Group 2,131 35.0 Axel Springer AG 1,395 29.3 De Persgroep 1,752 28.8 United-Internet Sites 1,385 29.1 Federated Media Publishing 1,677 27.6 Styria Media Group 1,343 28.2 Apple Inc. 1,660 27.3 eBay 1,327 27.9 VRT Sites 1,601 26.3 Hubert Burda Media 1,222 25.7 Viacom Digital 1,578 25.9 Apple Inc. 1,107 23.3 Telenet Sites 1,538 25.3 ORF.at Network 1,042 21.9 Amazon Sites 1,366 22.4 Federated Media Publishing 991 20.8 Groupe Rossel 1,320 21.7 Ask Network 926 19.5 Truvo International 1,294 21.3 ProSiebenSat1 Sites 925 19.4 eBay 1,276 21.0 Viacom Digital 898 18.9 2dehands 1,148 18.9 Deutsche Telekom 893 18.8 Dailymotion.com 1,081 17.8 Denmark Finland Media Total Unique % Reach Visitors (000) Media Total Unique % Reach Visitors (000) Total Internet Audience: Age 15+ 3,687 100.0 Total Internet Audience: Age 15+ 3,394 100.0 Google Sites 3,456 93.7 Google Sites 3,282 96.7 Microsoft Sites 3,078 83.5 Microsoft Sites 2,949 86.9 Facebook.com 2,842 77.1 Facebook.com 2,723 80.2 JP Politiken Hus 1,381 37.5 Sanoma Group 2,392 70.5 TV2 Danmark 1,338 36.3 Alma Media 2,251 66.3 Wikimedia Foundation Sites 1,286 34.9 Wikimedia Foundation Sites 1,755 51.7 VEVO 1,212 32.9 MTV3 Internet 1,563 46.0 Eniro Sites 1,191 32.3 Otava Group 1,529 45.1 Dr.dk 1,178 31.9 Yleisradio Oy 1,331 39.2 eBay 1,175 31.9 VEVO 1,324 39.0 Apple Inc. 1,102 29.9 Eniro Sites 1,253 36.9 Berlingske Media 1,002 27.2 Glam Media 1,126 33.2 Yahoo! Sites 941 25.5 Viacom Digital 978 28.8 Federated Media Publishing 938 25.4 Federated Media Publishing 942 27.8 Amazon Sites 924 25.1 Amazon Sites 904 26.6 Viacom Digital 808 21.9 Fonecta Sites 894 26.3 Ask Network 708 19.2 Yahoo! Sites 867 25.6 Danske Bank 644 17.5 Nordea Group 823 24.2 IDG Network 624 16.9 OP-Pohjola 788 23.2 CBS Interactive 616 16.7 AOL, Inc. 733 21.6 Source: comScore © IAB Europe 31
  • 32.
    Section 4 -Background Data TOP PROPERTIES DECEMBER 2011 France Germany Media Total Unique % Reach Media Total Unique % Reach Visitors (000) Visitors (000) Total Internet Audience: Age 6+ 47,759 100.0 Total Internet Audience: Age 6+ 56,193 100.0 Google Sites 44,806 93.8 Google Sites 52,591 93.6 Microsoft Sites 39,243 82.2 Facebook.com 38,715 68.9 Facebook.com 32,931 69.0 Microsoft Sites 33,908 60.3 Orange Sites 23,766 49.8 Amazon Sites 32,543 57.9 CCM-Benchmark 22,187 46.5 eBay 30,212 53.8 Yahoo! Sites 21,439 44.9 Wikimedia Foundation Sites 26,222 46.7 Wikimedia Foundation Sites 20,817 43.6 Axel Springer AG 26,053 46.4 Iliad - Free.fr Sites 19,641 41.1 Deutsche Telekom 26,041 46.3 Groupe PPR 19,512 40.9 United-Internet Sites 25,530 45.4 Groupe Pages Jaunes 18,915 39.6 Hubert Burda Media 23,268 41.4 Amazon Sites 18,504 38.7 ProSiebenSat1 Sites 22,294 39.7 Axel Springer AG 17,790 37.2 Yahoo! Sites 20,848 37.1 Schibsted 16,468 34.5 RTL Group Sites 17,624 31.4 Vivendi 16,331 34.2 gutefrage.net GmbH 16,397 29.2 Dailymotion.com 15,987 33.5 Glam Media 15,261 27.2 Groupe Lagardere 15,851 33.2 Apple Inc. 14,146 25.2 Ebuzzing 15,564 32.6 Otto Gruppe 12,757 22.7 Groupe M6 14,702 30.8 Verlagsgruppe Georg von 10,501 18.7 eBay 14,652 30.7 Holtzbrinck Rakuten Inc 13,497 28.3 Mail.ru Group 10,451 18.6 The Mozilla Organization 10,240 18.2 Ireland Italy Media Total Unique % Reach Media Total Unique % Reach Visitors (000) Visitors (000) Total Internet Audience: Age 15+ 2,361 100.0 Total Internet Audience: Age 15+ 24,468 100.0 Google Sites 2,239 94.8 Google Sites 23,157 94.6 Microsoft Sites 1,871 79.2 Facebook.com 19,168 78.3 Facebook.com 1,803 76.3 Microsoft Sites 18,490 75.6 Yahoo! Sites 1,473 62.4 WIND Telecomunicazioni 15,858 64.8 Rte.ie 1,341 56.8 Yahoo! Sites 15,481 63.3 Distilled Media 1,232 52.2 Telecom Italia 12,391 50.6 Glam Media 1,122 47.5 Wikimedia Foundation Sites 10,081 41.2 Amazon Sites 1,068 45.3 Populis 8,957 36.6 BBC Sites 905 38.3 Banzai 8,948 36.6 Wikimedia Foundation Sites 879 37.2 Federated Media Publishing 7,952 32.5 Irish Times Group 851 36.0 eBay 7,484 30.6 Apple Inc. 790 33.5 Ask Network 7,330 30.0 VEVO 783 33.2 VEVO 6,799 27.8 Independent News & Media 781 33.1 RCS Media Group 6,307 25.8 Federated Media Publishing 768 32.5 Gruppo Editoriale Espresso 5,458 22.3 New York Times Digital 756 32.0 Apple Inc. 5,304 21.7 Viacom Digital 701 29.7 ForumCommunity 5,185 21.2 Ask Network 657 27.8 Amazon Sites 5,032 20.6 eBay 628 26.6 Axel Springer AG 4,927 20.1 Sky Sites 592 25.1 Viacom Digital 4,767 19.5 Source: comScore 32 IAB Europe AdEx Benchmark 2011
  • 33.
    Section 4 -Background Data TOP PROPERTIES DECEMBER 2011 Netherlands Norway Media Total Unique % Reach Media Total Unique % Reach Visitors (000) Visitors (000) Total Internet Audience: Age 15+ 11,997 100.0 Total Internet Audience: Age 15+ 3,279 100.0 Google Sites 11,615 96.8 Google Sites 2,969 90.5 Microsoft Sites 10,989 91.6 Facebook.com 2,589 79.0 Facebook.com 8,409 70.1 Microsoft Sites 2,536 77.3 Sanoma Group 7,305 60.9 Schibsted 2,312 70.5 eBay 6,292 52.4 A-Pressen Group 1,522 46.4 Hyves 6,089 50.8 Wikimedia Foundation Sites 1,409 43.0 Wikimedia Foundation Sites 5,765 48.1 Eniro Sites 1,338 40.8 Publieke Omroep 5,583 46.5 AS Avishuset Dagbladet 1,336 40.7 Telegraaf Media Groep 5,378 44.8 Telenor 1,334 40.7 VEVO 4,451 37.1 TV2 Sites 1,230 37.5 ING Group 4,274 35.6 NRK Sites 1,201 36.6 Apple Inc. 3,976 33.1 Spotify 1,195 36.4 Twitter.com 3,918 32.7 Federated Media Publishing 1,077 32.8 Bol.com 3,898 32.5 VEVO 1,065 32.5 Rabobank Group 3,801 31.7 Apple Inc. 990 30.2 KPN 3,729 31.1 Yahoo! Sites 936 28.6 Yahoo! Sites 3,442 28.7 Edda Media 888 27.1 Federated Media Publishing 3,388 28.2 Yr.co 825 25.2 LinkedIn.com 3,287 27.4 Amazon Sites 824 25.1 Viacom Digital 3,234 27.0 Viacom Digital 805 24.5 Poland Russia Media Total Unique % Reach Media Total Unique % Reach Visitors (000) Visitors (000) Total Internet Audience: Age 15+ 18,194 100.0 Total Internet Audience: Age 15+ 53,345 100.0 Google Sites 17,721 97.4 Yandex Sites 44,979 84.3 MIH Limited 14,820 81.5 Mail.ru Group 44,748 83.9 Nk.pl 13,778 75.7 Google Sites 37,866 71.0 Facebook.com 13,514 74.3 Vkontakte 36,940 69.2 Grupa Onet.pl 13,170 72.4 Wikimedia Foundation Sites 22,057 41.3 Gazeta.pl Group 12,258 67.4 Ucoz Web Services 21,344 40.0 Wirtualna Polska 12,041 66.2 RosBusinessConsulting 20,449 38.3 Grupa o2 11,593 63.7 Microsoft Sites 18,603 34.9 Wikimedia Foundation Sites 10,351 56.9 Rambler Media 17,967 33.7 Interia.pl SA 8,158 44.8 SUP 14,636 27.4 Chomikuj.pl 7,903 43.4 Gazprom Media 12,607 23.6 VEVO 7,384 40.6 Facebook.com 11,716 22.0 Demotywatory.pl 7,092 39.0 Avito.ru 10,279 19.3 Kwejk.pl 6,653 36.6 Technorati Media 9,574 17.9 Microsoft Sites 5,899 32.4 Ivi.ru 9,512 17.8 Filmweb.pl 5,078 27.9 Opera Software 8,834 16.6 Orange Sites 5,018 27.6 LiveInternet 8,674 16.3 Grupa Money.pl 4,774 26.2 Zaycev Net 8,415 15.8 Tekstowo.pl 4,238 23.3 Kinopoisk.ru 7,391 13.9 Viacom Digital 4,193 23.0 Ozon.ru Sites 7,294 13.7 Source: comScore © IAB Europe 33
  • 34.
    Section 4 -Background Data TOP PROPERTIES DECEMBER 2011 Spain Sweden Media Total Unique % Reach Media Total Unique % Reach Visitors (000) Visitors (000) Total Internet Audience: Age 6+ 24,489 100.0 Total Internet Audience: Age 15+ 6,242 100.0 Google Sites 23,284 95.1 Google Sites 5,889 94.3 Microsoft Sites 22,869 93.4 Microsoft Sites 5,361 85.9 Facebook.com 17,241 70.4 Facebook.com 4,938 79.1 Terra - Telefonica 14,910 60.9 Schibsted 4,178 66.9 Prisa 14,145 57.8 Bonnier Group 3,906 62.6 Yahoo! Sites 13,128 53.6 Wikimedia Foundation Sites 2,643 42.3 RCS Media Group 11,616 47.4 Spotify 2,578 41.3 Wikimedia Foundation Sites 9,706 39.6 Blogg.se 2,315 37.1 Schibsted (Anuntis-Infojobs- Federated Media Publishing 2,223 35.6 9,506 38.8 20minutos) Swedbank 2,090 33.5 Federated Media Publishing 9,009 36.8 Sveriges Television 1,974 31.6 Vocento 8,664 35.4 VEVO 1,929 30.9 Corporacion Publicitaria De Eniro Sites 1,807 29.0 8,011 32.7 Medios CDON Group 1,695 27.2 Orange Sites 7,767 31.7 Yahoo! Sites 1,606 25.7 NetShelter Technology Media 6,808 27.8 Apple Inc. 1,579 25.3 VEVO 6,256 25.5 Amazon Sites 1,557 24.9 Weblogs SL Sites 6,146 25.1 eBay 1,476 23.6 Ask Network 5,596 22.9 Viacom Digital 1,310 21.0 Amazon Sites 5,483 22.4 CBS Interactive 1,091 17.5 Taringa.net 5,084 20.8 El Corte Ingles Sites 5,077 20.7 Switzerland Turkey Media Total Unique % Reach Media Total Unique % Reach Visitors (000) Visitors (000) Total Internet Audience: Age 15+ 4,817 100.0 Total Internet Audience: Age 15+ 23,369 100.0 Google Sites 4,534 94.1 Google Sites 22,969 98.3 Microsoft Sites 3,929 81.6 Facebook.com 21,637 92.6 Facebook.com 3,176 65.9 Nokta.com MEDYA 19,704 84.3 Wikimedia Foundation Sites 1,962 40.7 Microsoft Sites 18,671 79.9 Yahoo! Sites 1,961 40.7 Mynet A.S. 13,844 59.2 Apple Inc. 1,737 36.1 Hurriyet Internet Group 13,028 55.7 Swisscom Sites 1,620 33.6 Dailymotion.com 11,989 51.3 VEVO 1,430 29.7 DK Gazetecilik 11,801 50.5 Amazon Sites 1,283 26.6 Aksoy Group 10,892 46.6 Axel Springer AG 1,214 25.2 Yeni Medya 10,844 46.4 Tamedia Sites 1,200 24.9 Dogan Online 9,925 42.5 Federated Media Publishing 1,141 23.7 Wikimedia Foundation Sites 9,421 40.3 MIH Limited 1,089 22.6 Dogan Gazetecilik 7,768 33.2 Glam Media 1,049 21.8 Donanimhaber.com 7,724 33.1 Deutsche Telekom 984 20.4 Turkuvaz Yayin 7,586 32.5 Viacom Digital 921 19.1 eBay 7,372 31.5 SRG SSR 909 18.9 Twitter.com 6,930 29.7 SBB CFF FFS Sites 853 17.7 Federated Media Publishing 6,915 29.6 Search.ch 800 16.6 Turk Telecom Group 6,710 28.7 eBay 797 16.5 Kokteyl Group 6,501 27.8 Source: comScore 34 IAB Europe AdEx Benchmark 2011
  • 35.
    Section 4 -Background Data TOP PROPERTIES DECEMBER 2011 UK Media Total Unique % Reach Visitors (000) Total Internet Audience: Age 6+ 42,731 100.0 Google Sites 39,154 91.6 Microsoft Sites 36,404 85.2 Facebook.com 31,633 74.0 Amazon Sites 26,455 61.9 Yahoo! Sites 25,824 60.4 BBC Sites 22,614 52.9 eBay 22,592 52.9 Glam Media 19,797 46.3 Wikimedia Foundation Sites 19,118 44.7 Apple Inc. 17,651 41.3 Ask Network 15,230 35.6 Home Retail Group 12,709 29.7 VEVO 12,621 29.5 Federated Media Publishing 12,534 29.3 Viacom Digital 11,245 26.3 CBS Interactive 11,198 26.2 AOL, Inc. 10,641 24.9 Sky Sites 10,484 24.5 Guardian Media Group 9,796 22.9 New York Times Digital 9,697 22.7 Source: comScore © IAB Europe 35
  • 36.
    Section 4 -Background Data TOP AD PUBLISHER SITES 2011 Austria Belgium Rank Sites % of Total Ad Rank Sites % of Total Ad Impressions Impressions 1 News Networld 19.3% 1 De Persgroep Publishing nv - HLN.be 14.0% 2 VOL Vorarlberg Online 11.9% 2 eBay Belgium 10.1% 3 Austria.com 10.6% 3 Immoweb.be 8.3% 4 oe24.at 7.1% 4 De Persgroep Publishing nv - 7Sur7 7.0% 5 ORF 5.3% 5 MSN / Bing Belgium 6.3% 6 derStandard 3.6% 6 2dehands.be 4.9% 7 Telekurier Online Medien - Kurier 3.6% 7 Netlog Belgium 4.8% 8 Laola1.at 3.3% 8 Corelio - Het Nieuwsblad 4.7% 9 Kleine Zeitung 3.0% 9 Skynet Belgacom 3.2% 10 HEROLD.at 3.0% 10 Corelio - De Standaard 2.9% Denmark France Rank Sites % of Total Ad Rank Sites % of Total Ad Impressions Impressions 1 Ekstra Bladet 19.3% 1 Orange France 21.8% 2 TV2 Denmark 16.9% 2 Groupe Amaury - L Equipe 6.4% 3 BT Denmark 10.6% 3 DistriGame 3.5% 4 Den Bla Avis 6.7% 4 Yahoo France 3.5% 5 Politiken Denmark 4.3% 5 01net Network - 01 Net France 3.4% 6 Jubii Denmark 3.6% 6 BENCHMARK GROUP - L internaute 2.9% 7 MSN / Bing Denmark 3.2% 7 eBay France 2.8% 8 JP - Jyllands Posten 2.8% 8 Pages Jaunes 2.5% 9 Sondagsavisen.dk 2.7% 9 Free 2.3% 10 Bold.dk 2.5% 10 20 Minutes France 2.3% Germany Italy Rank Sites % of Total Ad Rank Sites % of Total Ad Impressions Impressions 1 T-Online Germany 35.6% 1 Libero 11.1% 2 Axel Springer - Bild.de 9.4% 2 Tiscali Italy 10.0% 3 eBay Germany 8.9% Gruppo Editoriale L'Espresso - 3 9.2% 4 mobile.de 3.9% Repubblica 5 GMX Germany 3.4% 4 Alice/Virgilio 8.2% 6 Web.de 3.0% 5 YouTube Italy 8.0% 7 Spiegel Verlag - Spiegel Online 2.8% 6 Il Meteo 5.8% 8 Freenet.de 2.6% 7 RCS - Corriere della Sera 4.2% 9 Olympia Verlag - Kicker Online 1.6% 8 eBay Italy 3.2% 10 Yahoo Germany 1.5% 9 Yahoo Italy 2.9% 10 Gazzetta dello Sport 2.7% Source: Nielsen 36 IAB Europe AdEx Benchmark 2011
  • 37.
    Section 4 -Background Data TOP AD PUBLISHER SITES 2011 Netherlands Norway Rank Sites % of Total Ad Rank Sites % of Total Ad Impressions Impressions 1 Sanoma - NU.nl 11.3% 1 VG Nett 27.3% 2 Sanoma - Startpagina.nl 10.8% 2 Finn.no 12.8% 3 Marktplaats 10.8% 3 ABC Startsiden 8.6% 4 Telegraaf Media Nederland - De Telegraaf 7.0% 4 Sol Norway 7.6% 5 Algemeen Dagblad 4.7% 5 Dagbladet.no 4.9% 6 Buienradar.nl 2.9% 6 Nettavisen.no 4.4% 7 WeerOnline 2.8% 7 Aftenposten 4.3% 8 Omroep - NOS 2.8% 8 Hegnar Online 3.2% 9 VNU - Tweakers 2.1% 9 BT - Bergens Tidende 2.8% 10 TVGids Netherlands 2.0% 10 TV2 Norway 2.5% Spain Sweden Rank Sites % of Total Ad Rank Sites % of Total Ad Impressions Impressions 1 Unidad Editorial - Marca 35.8% 1 Aftonbladet 25.8% 2 Unidad Editorial - El Mundo 12.5% 2 Expressen Sweden 10.5% 3 Diario AS 4.7% 3 Tradera 7.0% 4 Idealista 4.1% 4 MSN / Bing Sweden 6.5% 5 Grupo Prisa - El Pais 3.6% 5 SVD - Svenska Dagbladet 4.8% 6 Terra Spain 3.3% 6 Blogg.se 4.6% 7 Corp. Publicitaria - Sport.es 3.2% 7 DN - Dagens Nyheter 3.3% 8 MSN / Bing Spain 2.2% 8 Dagens Industri Sweden - Di.se 2.4% 9 Mundo Deportivo 1.7% 9 Spray Sweden 1.7% 10 YouTube Spain 1.5% 10 TV.nu 1.5% Switzerland Turkey Rank Sites % of Total Ad Rank Sites % of Total Ad Impressions Impressions 1 Swisscom / Bluewin 34.8% 1 Mynet - Mynet 14.3% 2 Tamedia - 20 Minuten Switzerland 9.9% 2 Medyanet - Hurriyet 7.4% 3 Ringier - Blick Online 6.7% 3 Netbook Media - Haberturk.com 6.7% 4 Autoscout24 Switzerland 5.3% 4 Medyanet - Milliyet.com.tr 6.2% 5 Tamedia - Tagesanzeiger 5.0% 5 Netbook Media - Memurlar.net 6.1% 6 MSN / Bing Switzerland 4.2% 6 Aksoy Group - sahibinden.com 5.8% 7 Homegate 3.6% 7 Turkuvaz Medya Digital - SABAH 4.1% 8 GMX Switzerland 3.0% 8 Medyanet - Ekolay.net 4.0% 9 NZZ Online / Neue Zürcher Zeitung 2.2% 9 Medya Guru - Sahadan.com 3.3% 10 Ticinonline 2.1% 10 Logaritma - YeniSafak 2.8% Source: Nielsen © IAB Europe 37
  • 38.
    Section 4 -Background Data TOP AD PUBLISHER SITES 2011 UK Rank Sites % of Total Ad Impressions 1 YouTube UK 14.4% 2 eBay United Kingdom 12.0% 3 DMGT - Mail Online 7.3% 4 Yahoo United Kingdom 6.7% 5 MSN / Bing United Kingdom 5.7% 6 Amazon United Kingdom 3.0% 7 ITV 3.0% 8 Hearst Magazines - Digital Spy 2.8% Guardian News and Media - Guardian. 9 2.8% co.uk 10 Sky.com United Kingdom 2.7% Source: Nielsen 38 IAB Europe AdEx Benchmark 2011
  • 39.
    Section 4 -Background Data INTERNET PENETRATION IN EUROPE 2011 Austria Belgium Internet penetration by household 77.0% Internet penetration by household 72.2% Bulgaria Czech Republic Internet penetration by household 42.6% Internet penetration by household 64.0% Denmark Finland Internet penetration by household 87.9% Internet penetration by household 74.5% France Germany Internet penetration by household 70.6% Internet penetration by household 76.9% Greece Hungary Internet penetration by household 49.3% Internet penetration by household 62.7% Ireland Netherlands Internet penetration by household 69.1% Internet penetration by household 93.6% Norway Poland Internet penetration by household 89.5% Internet penetration by household 50.0% Russia Serbia Internet penetration by household 43.5% Internet penetration by household 89.5% Source: IHS Screen Digest © IAB Europe 39
  • 40.
    Section 4 -Background Data INTERNET PENETRATION IN EUROPE 2011 Slovakia Slovenia Internet penetration by household 59.6% Internet penetration by household 71.5% Spain Spain Internet penetration by household 60.3% Internet penetration by household 60.3% Sweden Switzerland Internet penetration by household 81.3% Internet penetration by household 84.1% Turkey UK Internet penetration by household 42.5% Internet penetration by household 77.8% Source: IHS Screen Digest 40 IAB Europe AdEx Benchmark 2011
  • 41.
    Section 5 -Appendices Appendix i: Definition of formats Integrated content Advertising space without a direct link to the advertiser’s website, Online display advertising including tenancies and sponsorships (see below for detailed defi- Banners, buttons, skyscrapers, overlays, interstitials, pop ups dis- nitions of these). played on a website. E-Mail marketing (excluded from the AdEx Benchmark) Online video advertising Where the body of the email is determined by the advertiser and There are numerous definitions of online video advertising. is sent on their behalf by an email list manager/owner. Principally included can be: • in-stream video advertising (pre-rolls, mid-rolls, post-rolls) Newsletter advertising • in-stream banner overlays Advertising (text or banner) that appears around the unrelated edi- • out-of-stream video advertising (e.g. self-play video on social torial content of email newsletters. network, not embedded in non-advertising video content) • contextual video advertising (e.g. branded video players, Interactive Television contextual banner advertising sold against video content). Any advertising distributed through the digital television platform. Affiliate marketing Mobile advertising - display Fees paid to third party (affiliate) for traffic generation (e.g. pay- Any display advertising viewed or read on a mobile phone includ- per-visit). Note: for the time being affiliate spend will be included in ing rich media advertising. This could be browser-based as well display spend in the Ad Ex survey (rather than reported as stand- as in-app. alone category). Mobile advertising - search Online classifieds Advertising appearing on specific word requests on search en- A fee is paid by an advertiser to display an ad or listing around gines, viewed on a mobile device. a specific vertical such as automotive, recruiting and real estate, regardless of the outcome of the ad (ie, the fee is paid even if there Mobile advertising - SMS/MMS is no ‘sale’). 3rd party ads in SMS and outbound SMS only - this includes ad- vertising either within the body copy of an SMS / MMS message, Online directories or outbound messaging. Online version of printed yellow pages (business listing paid for by advertiser). Mobile advertising - other All other mobile advertising (e.g. mobile classifieds). Paid-for-search advertising Advertising appearing on specific word requests on search en- Online auctions gines. The fees received by online auction houses, e.g. Ebay, from suc- cessful sales through their sites. Search engine optimisation (excluded from the AdEx Benchmark) In-game advertising Fees paid to a 3rd party to improve website ranking in search Fees paid for advertising, sponsorship or product placements engines. within an online game. © IAB Europe 41
  • 42.
    Section 6 -Appendices Tenancies IAB Chapter in Denmark (Danske Medier) Long term partnership between advertiser and media owner. Me- http://danskemedier.dk/ Source: Danske Medier dia owner benefits from content or service offered by tenant to their customers, although media space may be paid for in usual IAB Finland ways. http://www.iab.fi/ Partner: TNS Gallup (for Display and Classifieds) Sponsorships IAB France Advertiser sponsorships of content areas. http://www.iabfrance.com/ Source: France Pub Interruptive formats IAB Chapter in Germany (OVK) A type of internet display advertising that interrupts the user expe- http://www.bvdw.org/ rience with the page content eg pop ups, overlays. Partner: Nielsen Media Research The following four formats are collated as part of this report IAB Greece • Display advertising: includes online display advertising, online video advertising, affiliate marketing, integrated http://www.iab.gr/ content, newsletter advertising, interactive television, mobile IAB Hungary advertising – display, online auctions, in-game advertising, tenancies, sponsorships, and interruptive formats as http://www.iab.hu/ Partner: PwC 1 described above and social media where reported • Paid-for-search advertising IAB Ireland • Classifieds & Directories: includes online classifieds and http://www.iabireland.ie/ Partner: PwC online directories as described above • ‘Other’ advertising: an umbrella category for ad spend which IAB Italy could not be redistributed to the three formats above http://www.iab.it/ Partner: FCP/Nielsen Media Research Appendix ii: The Participating IABs IAB Netherlands http://www.iab.nl/ IAB Austria Partner: Deloitte http://www.iab-austria.at Source: Focus Media Research and Werbeplanung.at IAB Chapter in Norway http://www.inma.no/ IAB Belgium Source: IRM/INMA http://www.iab-belgium.be IAB Poland Source: Mediaxim and IHS Screen Digest http://www.iabpolska.pl/ IAB Chapter in Bulgaria (Interactive Association) Partner: PwC http://www.iabulgaria.bg IAB Romania http://www.iab-romani.ro/ IAB Croatia Partner: PwC Romania http://www.inama.hr/ 1. IAB Europe and IHS Screen Digest do not provide a standardised definition of social media advertising as there is still no consensus on this matter. 42 IAB Europe AdEx Benchmark 2011
  • 43.
    Section 6 -Appendices IAB Russia rates, the prior year’s figures are also re-calculated using the cur- http://www.iabrus.ru/ rent report’s year-average exchange rate in order to give transpar- Partner: AKAR (Russian Association of Communication Agencies) ency over the growth rate. IAB Serbia The chart below shows the amount of actual, estimated and ad- http://www.iab.rs/ justed data included in the 2011 AdEx Benchmark. IAB Chapter in Slovakia (AIM) http://www.aimsr.sk/ Appendix iv: Adjustments by country IAB Slovenia Austria http://www.soz.si/ Source: Mediana • Ratecard data provided for all formats by Focus Media Research and Werberplanung.at (an Austrian consulting IAB Spain company) in coordination with IAB Austria http://www.iabspain.net/ Source: PwC • 2010 data restated to ensure comparability by the companies mentioned above IAB Sweden • 2011 discounts applied based on IHS Screen Digest http://www.iabsvergie.se/ estimates as follows: Source: IRM o Display – 40% IAB Switzerland o Classifieds & Directories – 20% http://www.iabswitzerland.ch/ o Paid-for-search – 5% Partner: MediaFocus o Mobile Display – 40% IAB Turkey • 2010 discounts applied based on IHS Screen Digest http://www.iab-turkiye.org/ estimates as follows: o Display – 38.5% IAB UK o Classifieds & Directories –18.5% http://www.iabuk.net/ o Paid-for-search – 5% Partner: PwC Belgium Appendix iii: Methodology and adjusted data • Ratecard data provided for Display market by Mediaxim • Display discounted by 55.8% Each national IAB runs its own annual online advertising spend • Classifieds & Directories and Paid-for-search estimated benchmark study. As the methodology for the studies varies based on European averages slightly by country, IAB Europe works with IHS Screen Digest to ensure that the findings in the European report are comparable. Bulgaria This involves re-adjusting figures to allow for different original • Net data provided by IAB Bulgaria methodologies, adjusting currencies where local data is not col- • Data collected by survey and estimated by the IAB Board to lected in Euros and ensuring the year average exchange rate at adjust for missing participants; paid-for-research revenues 2011 has been used. To provide data for previous year growth based on estimated of Bulgarian Google revenues • Data grossed up as follows based on local IAB recommendations: © IAB Europe 43
  • 44.
    Section 6 -Appendices o Display – 5% o Classifieds & Directories – 15% to 100% of Classifieds o Classifieds & Directories – 0.5% & Directories total o Paid-for-search – 4% o Paid-for-search – 15% to 50% of Paid-for-Search o Other – 5% • “Other” category not redistributed in any of the above France formats as it was not possible to identify the type of ad • Newsletter advertising extracted from E-mail marketing spend (estimated at 20% of E-mail marketing) and added into Display Croatia • E-mail marketing excluded • No data supplied by IAB Croatia for 2011 • Classifieds & Directories category only includes Directories • Classifieds & Directories and Paid-for-search modelled based figure published by IREP on CEE average rate and applied to 2010 figures • Display estimated based on local IAB recommendations Germany • Ratecard data provided by OVK/Nielsen Czech Republic • Data was discounted as follows based on IHS Screen Digest • Ratecard data provided for Display and Classifieds & estimates: Directories o Display excl. video – 63.6% • Mobile advertising distributed as follows: o Affiliate marketing – 63.6% o Mobile internet advertising into Display and Paid-for- • Online video figure based on IHS Screen Digest estimates Search based on their market share of total online ad • Affiliate marketing and video added into Display category spend • Data grossed up as follows: o Mobile messaging into Other o Online video – 15% to 95% of Online video total • Paid-for-search reduced by 155,962,000 CZK to exclude o Paid-for-search – 10% to 100% of Paid-for-search pan-European spend total • Data discounted by 34.1% in all categories apart from Paid- for-search, based on local IAB recommendations Greece • Classifieds & Directories figures for 2010 and 2011 estimated Denmark by IHS Screen Digest • Net data provided by Danske Medier • E-mail marketing excluded Hungary • Data grossed up as follows: • E-mail marketing excluded o Display – 7% on 60% of Display total • Mobile messaging included into Other category o Paid-for-search – 7% on 40% of Paid-for-Search total Ireland • Unspecified spend distributed as follows: Finland o 90% into Display category • Net data provided by TNS Gallup for Display and Classifieds; o 10% into Classifieds & Directories and Paid-for-Search IAB Finland for Paid-for-search and Directories based on their share of total online ad spend • Data grossed up as follows based on local IAB • 2010 Display category restated in Gross rate (grossed up by recommendations: 15%) o Display – 15% to 100% of Display total 44 IAB Europe AdEx Benchmark 2011
  • 45.
    Section 6 -Appendices Italy Russia • Net data provided by IAB and FCP/Nielsen • Net data provided by IAB Russia/AKAR • E-mail marketing excluded • Data grossed up as follows based on local IHS Screen • Mobile advertising distributed as follows: Digest estimates: o Mobile Display into Display category o Display – 15% on 100% of Display total o Mobile messaging into Other o Paid-for-search – 15% on 30% of Paid-for-Search total • Data grossed up as follows based on local IAB • Classifieds & Directories not estimated because they are recommendations: negligible in Russia, based on IAB Russia recommendations o Display – 15% to 100% of total Display o Mobile advertising – 15% to 77.5% of Mobile Serbia advertising • SEO and e-mail marketing excluded • Growth rate was calculated including ‘Other’ because most Netherlands of the ‘Other’ category constituted of social media, which is • Net data provided by IAB Netherlands and Deloitte traditionally included in the Display category Netherlands • Affiliate marketing redistributed as follows: Slovakia o 10% excluded as it was SEO • Sponsorships, Lead Generation, Slotting fees, and Video o 90% added into Display category included in Display category • E-mail marketing excluded • E-mail marketing excluded • Data grossed up as follows based on local IAB recommendations: Slovenia o Display – 15% • All categories reduced by 4% to exclude production costs o Mobile display – 15% Spain Norway • Net data provided by IAB Spain and PwC Spain • No adjustments needed • Classifieds extracted from Display using IAB Europe estimate and moved into Classifieds & Directories category Poland • Newsletter advertising extracted from E-mail marketing and • E-mail marketing excluded added into Display • Unspecified spend distributed among all categories based • E-mail marketing excluded on each category’s share of total online ad spend • Video advertising, in-game advertising, and mobile display advertising added into the Display category Romania • Mobile search added into the Paid-for-search category • Net data provided by IAB Romania and PwC Romania • Data grossed up as follows based on IHS Screen Digest • Affiliate marketing, integrated content, newsletter advertising, estimates: contextual advertising, and all unspecified advertising added o Display – 10% into the Display category o Mobile Display – 10% • Display was grossed up by 5% based on local IAB recommendations Sweden • Net data provided by IRM • E-mail marketing excluded © IAB Europe 45
  • 46.
    Section 6 -Appendices • Mobile advertising distributed as follows: UK o Mobile Display into Display category • Display, Classifieds & Directories, and Paid-for-search kept o Mobile Search into Paid-for-search as reported o Mobile messaging into Other • Other calculated as the difference of the Total reported and • Reported paid-for-search reduced by 10% to exclude SEO Total of Display, Classifieds & Directories and Paid-for-search revenue (this includes Lead-generation, Social Media, Solus Email) • Display reduced by 10% to exclude transaction-oriented • 2010 was restated using the same methodology payments • Data was grossed up as follows based on local IAB recommendations: o Display – 6% on 75% of Display total for 2011 and 70% of Display total for 2010 o Mobile advertising – 1.8% on 100% of Mobile total Switzerland • Affiliate marketing category moved into Display Turkey • Net data provided by IAB Turkey • E-mail marketing excluded • Paid-for-search is 90% of the sum of reported Paid-for- search and Search engine advertising revenues • Classifieds & Directories include only Classifieds • Mobile Display and 10% of the sum of reported Paid-for- search and Search engine advertising revenues ( which are in fact display ads) added into the Display category • Mobile messaging was included in Other category • Data grossed up as follows: o Display – 15% o Classifieds & Directories – 15% o Paid-for-search – 15% o Mobile display – 15% o Mobile messaging – 15% on 80% of Mobile Messaging total • 2010 figures restated based on IHS Screen Digest estimated 2011 growth rates 46 IAB Europe AdEx Benchmark 2011
  • 47.
    OUR RESEARCH PARTNERS IHSScreen Digest is the pre-eminent firm of industry analysts cov- comScore, Inc. (NASDAQ: SCOR) is a global leader in measuring ering global media markets including film, television, broadband the digital world and preferred source of digital business analytics. media, mobile media, cinema, home entertainment, gaming, and comScore helps its clients better understand, leverage and profit advertising. In November 2010, Screen Digest Limited was ac- from the rapidly evolving digital marketing landscape by providing quired by US research company iSuppli Corporation who were data, analytics and on-demand software solutions for the meas- subsequently acquired by IHS, one of the biggest providers of mar- urement of online ads and audiences, media planning, website ket research and insight globally. Together IHS Screen Digest and analytics, advertising effectiveness, copy-testing, social media, IHS iSuppli offer the most complete and insightful analysis of the search, video, mobile, cross-media, e-commerce, and a broad global technology, media and telecommunications (TMT) sector. variety of emerging forms of digital consumer behavior. comScore www.screendigest.com services, which now include the product suites of recent acquisi- tions AdXpose, Nedstat, Nexius XPlore, ARSGroup and Certifica, are used by more than 1,800 clients around the world, includ- ing global leaders such as AOL, Baidu, BBC, Best Buy, Carat, Deutsche Bank, ESPN, Facebook, France Telecom, Financial Times, Fox, Microsoft, MediaCorp, Nestle, Starcom, Terra Net- SPA Future Thinking has developed to become one of the fastest works, Universal McCann, Verizon Services Group, ViaMichelin growing and largest independent market research companies in and Yahoo!. Europe, with more than 200 employees across offices in the UK, Central to most comScore services is the comScore panel, the France, Germany and Italy and a partner network in 38 countries largest continuously measured consumer panel of its kind. With worldwide. With combined industry experience of over 40 years approximately 2 million worldwide consumers under continuous we offer thought leadership across a wide range of specialisms measurement, comScore delivers one of the highest quality, most and we provide genuine expertise and understanding across a comprehensive views of internet browsing, buying and other ac- wide range of industry sectors. tivity, in the digital environment. Complementing the panel is a We provide strategic research and actionable insights to a wide unique census-level data collection method, which allows for the range of leading companies; offering both bespoke solutions, integration of consumers’ internet behaviour with powerful audi- analytics and proprietary techniques to help guide the decisions ence-measurement insights. The methodology that comScore that you make in areas like, market development, new product utilises to thread census-level collected data with the comScore development, innovation, customer satisfaction and experience, panel is called Unified Digital Measurement. brand, communications, buying behaviour and more. www.comscore.com www.spafuturethinking.com Nielsen Holdings N.V. (NYSE: NLSN) is a global information and measurement company with leading market positions in market- ing and consumer information, television and other media meas- urement, online intelligence, mobile measurement, trade shows and related properties. Nielsen has a presence in approximately 100 countries, with headquarters in New York, USA and Diemen, the Netherlands. For more information, visit www.nielsen.com. www.nielsen.com © IAB Europe 47
  • 48.
    ABOUT IAB EUROPE Our Executive Team Our Board Alain Heureux, President and CEO, has more than 20 years pan- Made up of nine national IABs and nine corporate members, the European marketing experience having established several mar- Board represents the wide-ranging interests of the many stake- keting services companies across Europe. A well-known figure holders in the European digital marketing industry. in the European digital and interactive advertising scene, Alain speaks at conferences and events across the region promoting Chairman: Guy Phillipson, IAB UK the value of online advertising. president@iabeurope.eu Vice-Chairman: Thomas Duhr, United Internet Media Alison Fennah, Vice-President Research and Marketing, has Corporate members: Adconion Media Group, Adobe, ADTECH, worked with trade organisations for more than 10 years and in Alcatel-Lucent, AOL Advertising Europe, AudienceScience, BBC interactive marketing since the early 1990s. Advertising, CNN, CoAdvertise, comScore Europe, CPX Interac- vprm@iabeurope.eu tive, Criteo, eBay International Advertising, Expedia Inc, Fox Inter- active Media, Gemius, Goldbach Media Group, Google, GroupM, Kimon Zorbas, Vice-President Public Affairs, known and respected Hi-Media, Koan, Microsoft Europe, Millward Brown, News Corpo- in European institutions for more than 10 years, heads up the pub- ration, nugg.ad, Nielsen Online, OMD, Orange Advertising Net- lic policy programme of the association. work, PHD, Prisa, Publicitas Europe, Quisma, Sanoma Digital, vp@iabeurope.eu Selligent, TradeDoubler, Triton Digital, United Internet Media, Val- ueClick, Verisign, Viacom International Media Networks, Webtrekk, White & Case, Yahoo! and zanox Country members: Austria, Belgium, Bulgaria, Croatia, Czech Re- public, Denmark, Finland, France, Germany, Greece, Hungary, Ire- land, Italy, Netherlands, Norway, Poland, Romania, Russia, Serbia, Slovakia, Slovenia, Spain, Sweden, Switzerland, Turkey, Ukraine and United Kingdom representing their 5.000 members. The IAB network represents over 90% of European digital revenues and is acting as voice for the industry at National and European level. 48 IAB Europe AdEx Benchmark 2011
  • 49.
    Section 6 -Appendices AND FINALLY Also from IAB Europe Special thanks One of IAB Europe’s three core objectives is to demonstrate the With sincere thanks to all the contacts at the national IABs who have value of the online advertising industry through a programme of supported the production of this report by supplying and explaining research. IAB Europe brings together the best of research avail- their data to IAB Europe. able on the European online advertising market through its network of members, national IABs and partners. Current projects include: Thanks to our members comScore and Nielsen for audience meas- urement figures. During Spring 2012, IAB Europe created an AdEx Benchmark Task- force on report strategy, questionnaire and methodology. We would Mediascope Europe is the industry standard European piece of like to thank the AdEx Benchmark Task Force for their valuable feed- cross-media consumer research. Conducted since 2003 and it back and guidance in the production of this report: has made a major contribution to the understanding of chang- Serena Belloni, Marketing and Research Manager, IAB Italy ing media consumption patterns, the evolving consumer and Alexey Belyaev, Head of Internet Research, Video International and e-commerce trends. It covers consumer use of internet, radio, Chair of IAB Russia Research Committee TV, mobile, newspapers and magazines – including the evolution Tim Elkington, Director of Research and Strategy, IAB UK of media multi-tasking. Emerging and evolving online media in- Bjorn Kaspring, Head of Online Marketing and Market Development, cluding internet use via mobile, tablet and games console, video IAB Germany consumption and social media are investigated in depth to give Frederik Raviol, Business Analyst, United Internet Media a rounded picture of the interactive consumer. 28 markets are Endre Somogyi, General Manager, IAB Hungary now included– UK, Germany, France, Italy, Spain, Belgium, Neth- erlands, Denmark, Norway, Sweden, Poland, Portugal, Russia, Switzerland, Turkey, Austria, Bulgaria, Croatia, Czech Republic, Authors of the AdEx Benchmark 2011 report Finland, Greece, Hungary, Ireland, Romania, Serbia, Slovakia, Slo- venia and Ukraine. Contact: mediascope@iabeurope.eu http://www.iabeurope.eu/research/mediascope-europe.aspx The CCB is a free online research tool produced by Google and IAB Europe which uses TNS data to provide agencies and adver- tisers with consumer insights across 27 countries and 36 prod- uct categories. Some material available exclusively to IAB Europe member on the Knowledge Bank. Daniel Knapp, Eleni Marouli, Regional report : Central & Eastern Europe Director of Advertising Research, Analyst, Advertising Research ‘Do you CEE?’ produced in partnership with Gemius, gives thor- IHS Screen Digest IHS Screen Digest ough overview of CEE audiences and trends by country. www.IABEurope.eu/research & www.IABEurope.eu/knowledgebank © IAB Europe 49
  • 50.
    Section 6 -Appendices CONTACT IAB Europe www.iabeurope.eu Alain Heureux Alison Fennah Daniel Knapp Bénédicte Blondel President VP, Research & Marketing Director of Advertising Research Communications Manager IAB Europe IAB Europe IHS Screen Digest IAB Europe president@iabeurope.eu vprm@iabeurope.eu daniel.knapp@ihs.com communication@iabeurope.eu 50