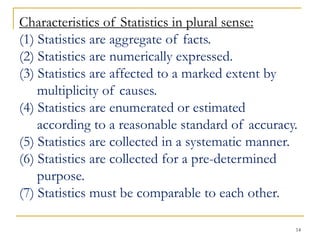
1
INTRODUCTION
LECTURE #01
2
Overview
 HISTORY
 Observation, population, sample.
 Parameter and statistic.
 MEANING OF STATISTICS
 CHARACTERISTICS OF STATISTICS
 DEFINITIONS OF STATISTICS
 VARIABLE AND CONSTANT
 Discrete variable and Continuous variable.
 Quantitative and Qualitative Data.
3
Overview
 Errors of measurement.
 BRANCHES OF STATISTICS
 Theoretical Statistics, Descriptive Statistics
 Inferential Statistics, Applied Statistics.
 FUNCTIONS OR USES OF STATISTICS
 LIMITATIONS OF STATISTICS
 IMPORTANCE OF STATISTICS IN DIFFERENT
FIELDS
4
 COLLECTION OF DATA
 Primary Data and Secondary Data.
 Collection of Primary Data.
 Collection of Secondary Data.
 ACCURACY
 SIGNIFICANT FIGURES
 ROUNDING OF FIGURES
 MATHEMATICAL NOTATION
 Multiplication, Inequalities, Approximations, Limits.
 Modulus, Factorials, and Summation.
Overview
5
HISTORY: The word “Statistics” which comes
from the Latin word “Status”- means political
state, originally meant information useful to the
state.
 Also, In Italian there is a word “Statista”.
 Another word is “statistik” in the German language.
 e.g. Information about the sizes of populations and
armed forces.
 There is a lot of gap between the old statistics and
the modern Statistics. But the old statistics also
makes a part of the present statistics.
 Knowledge of Statistics has become important for a
common man. A person without a knowledge of
6
Statistics is not a literate person.
 A man equipped with the knowledge of Statistics is
a better ruler, a better policy maker and a better
administrator.
OBSERVATION: Numerical measure of some
condition is called an observation. Work on
Statistics is called statistical work and statistical
work starts with a set of observations.
 We take the observations by counting or by
measurement. e.g. the number of patients in
different hospitals are counted and their blood
pressures are measured.
7
POPULATION: The entire lot of anything
(individuals) having some common characteristics
is called population. Population can be finite or
infinite.
Countable number of elements in a population is
called finite population.
Uncountable number of elements in a population
is called infinite population.
Some populations are called countably infinite
(very large but countable).
8
Sample: A small representative part of population
is called sample. The sample is studied and on the
basis of the sample study, we try to know
something about the population. The sample size
is denoted by n.
 This journey from the sample to the population is
called inference which is an important branch of
statistics.
 The method of selecting sample from the
population is called sampling.
 The ratio n/N is called sampling fraction.
9
PARAMETER: Any numerical quantity derived
from population is called parameter. OR
Any measure of the population is called a
parameter.
 It is usually unknown.
 The symbol µ (mue) is used for population mean
and the symbol σ2 (sigma square) is used for
population variance.
 These symbols relates to population and are called
parameters.
 The parameters are usually unknown and are
estimated through samples.
 They can also be called population constants
10
Because it is a fixed quantity.
STATISTIC: Any numerical quantity derived
from Sample is called Statistic. OR
Any measure of the sample is called a statistic.
11
MEANING OF STATISTICS: The word
“Statistics” has 3 different meanings:
Statistics in plural sense:
The word statistics in plural sense are the
numerical observations collected for some definite
purpose regarding some field of study. These
observations may be for sample or the population.
These observations are also called data.
Inference or inferential statistics.
 e.g. Statistics of prices, births, accidents, deaths,
educational institutions, etc. In all these examples,
the word “Statistics” is used to indicate a set of
numerical data in respective fields.
12
Statistics in Singular sense:
In the 2nd place, Statistics is a discipline which
deals with procedures and techniques to collect,
process and analyse numerical data to make valid
conclusions and to make inferences in the face of
uncertainty.
uncertainty≠ ignorance
uncertainty= incompleteness & instability of the
data
It is singular in this sense. It is also called Scientific
method as it embodies more or less all stages of
general process of learning.
13
14
Characteristics of Statistics in plural sense:
(1) Statistics are aggregate of facts.
(2) Statistics are numerically expressed.
(3) Statistics are affected to a marked extent by
multiplicity of causes.
(4) Statistics are enumerated or estimated
according to a reasonable standard of accuracy.
(5) Statistics are collected in a systematic manner.
(6) Statistics are collected for a pre-determined
purpose.
(7) Statistics must be comparable to each other.
15
Definitions of Statistics:
(1) In the old days statistics was defined as:
“the science of kings, political arithmetic and science of
statecraft”.
(2) A.L. Bowley defined statistics as:
“Statistics is the science of counting”.
(3) A.L. Bowley has also defined it as:
“science of averages”.
(4) Prof. Boddington has defined statistics as:
“science of estimates and probabilities”.
16
(5) W.I king defined statistics as:
“the science of statistics is the method of judging
collective, natural or social phenomena from the results
obtained from the analysis or enumeration or collection
of estimates”.
This definition is close to modern statistics but it
doesn’t cover the entire scope. The most accurate
definition was given by Secrist as:
“Statistics are the numerical statements of facts
capable of analysis and interpretation and the
science of statistics is the study of the principles and
the methods applied in collecting, presenting, analysis
17
and interpreting the numerical data in any field of
inquiry”.
Variable:
Any phenomenon that may change from one
individual to another or from one object to
another object is called a variable e.g. height,
weight and blood pressure etc.
Constant:
Any phenomenon that cannot be changed or that
remains fixed is called a constant e.g. the number
of days in a week, the number of months in a
calendar year etc.
18
Discrete variable:
A variable is called a discrete variable if it can take
only some specific values in a given interval. A
variable that is the result of counting or
enumeration is called a discrete variable. It may
also be called count variable. A set of observations
on discrete variable is called discrete data. E.g. the
number of goals scored in a hockey match is an
example of a discrete variable.
Continuous variable:
A variable which can assume all possible values
within a given range is called a continuous variable.
19
It may also be called measure variable. A set of
observations on a continuous variable is called
continuous data. E.g. temperature at a certain place
is an example of a continuous variable.
Quantitative Data:
A set of observations generated by counting
(enumeration) or by measurements is called
quantitative data. Both discrete and continuous
data come under the quantitative data. The data on
the number of accidents on roads, the number of
teachers in different schools, the intelligence
quotients of the students, the temperature in
20
different cities, the consumption of electricity in
different houses are quantitative data.
Qualitative Data:
The word Qualitative data is used for that
information which is generated by observing the
presence or absence of some quality (called
attribute) in individuals. The individuals may be
the students and the quality may be the
intelligence. We examine whether or not
intelligence is present in the students. The
observations are recorded with the help of ‘yes’
for intelligence and ‘no’ for non-intelligence. Thus
21
‘yes’ or ‘no’ generate the observations and the data
thus obtained are called qualitative data.
22
“Let’s work on some numerical data”
23
X 1 3 5 7 9 11
Y 10 8 6 4 2 1

Chapter#01 Introduction.ppt

  • 1.
  • 2.
    2 Overview  HISTORY  Observation,population, sample.  Parameter and statistic.  MEANING OF STATISTICS  CHARACTERISTICS OF STATISTICS  DEFINITIONS OF STATISTICS  VARIABLE AND CONSTANT  Discrete variable and Continuous variable.  Quantitative and Qualitative Data.
  • 3.
    3 Overview  Errors ofmeasurement.  BRANCHES OF STATISTICS  Theoretical Statistics, Descriptive Statistics  Inferential Statistics, Applied Statistics.  FUNCTIONS OR USES OF STATISTICS  LIMITATIONS OF STATISTICS  IMPORTANCE OF STATISTICS IN DIFFERENT FIELDS
  • 4.
    4  COLLECTION OFDATA  Primary Data and Secondary Data.  Collection of Primary Data.  Collection of Secondary Data.  ACCURACY  SIGNIFICANT FIGURES  ROUNDING OF FIGURES  MATHEMATICAL NOTATION  Multiplication, Inequalities, Approximations, Limits.  Modulus, Factorials, and Summation. Overview
  • 5.
    5 HISTORY: The word“Statistics” which comes from the Latin word “Status”- means political state, originally meant information useful to the state.  Also, In Italian there is a word “Statista”.  Another word is “statistik” in the German language.  e.g. Information about the sizes of populations and armed forces.  There is a lot of gap between the old statistics and the modern Statistics. But the old statistics also makes a part of the present statistics.  Knowledge of Statistics has become important for a common man. A person without a knowledge of
  • 6.
    6 Statistics is nota literate person.  A man equipped with the knowledge of Statistics is a better ruler, a better policy maker and a better administrator. OBSERVATION: Numerical measure of some condition is called an observation. Work on Statistics is called statistical work and statistical work starts with a set of observations.  We take the observations by counting or by measurement. e.g. the number of patients in different hospitals are counted and their blood pressures are measured.
  • 7.
    7 POPULATION: The entirelot of anything (individuals) having some common characteristics is called population. Population can be finite or infinite. Countable number of elements in a population is called finite population. Uncountable number of elements in a population is called infinite population. Some populations are called countably infinite (very large but countable).
  • 8.
    8 Sample: A smallrepresentative part of population is called sample. The sample is studied and on the basis of the sample study, we try to know something about the population. The sample size is denoted by n.  This journey from the sample to the population is called inference which is an important branch of statistics.  The method of selecting sample from the population is called sampling.  The ratio n/N is called sampling fraction.
  • 9.
    9 PARAMETER: Any numericalquantity derived from population is called parameter. OR Any measure of the population is called a parameter.  It is usually unknown.  The symbol µ (mue) is used for population mean and the symbol σ2 (sigma square) is used for population variance.  These symbols relates to population and are called parameters.  The parameters are usually unknown and are estimated through samples.  They can also be called population constants
  • 10.
    10 Because it isa fixed quantity. STATISTIC: Any numerical quantity derived from Sample is called Statistic. OR Any measure of the sample is called a statistic.
  • 11.
    11 MEANING OF STATISTICS:The word “Statistics” has 3 different meanings: Statistics in plural sense: The word statistics in plural sense are the numerical observations collected for some definite purpose regarding some field of study. These observations may be for sample or the population. These observations are also called data. Inference or inferential statistics.  e.g. Statistics of prices, births, accidents, deaths, educational institutions, etc. In all these examples, the word “Statistics” is used to indicate a set of numerical data in respective fields.
  • 12.
    12 Statistics in Singularsense: In the 2nd place, Statistics is a discipline which deals with procedures and techniques to collect, process and analyse numerical data to make valid conclusions and to make inferences in the face of uncertainty. uncertainty≠ ignorance uncertainty= incompleteness & instability of the data It is singular in this sense. It is also called Scientific method as it embodies more or less all stages of general process of learning.
  • 13.
  • 14.
    14 Characteristics of Statisticsin plural sense: (1) Statistics are aggregate of facts. (2) Statistics are numerically expressed. (3) Statistics are affected to a marked extent by multiplicity of causes. (4) Statistics are enumerated or estimated according to a reasonable standard of accuracy. (5) Statistics are collected in a systematic manner. (6) Statistics are collected for a pre-determined purpose. (7) Statistics must be comparable to each other.
  • 15.
    15 Definitions of Statistics: (1)In the old days statistics was defined as: “the science of kings, political arithmetic and science of statecraft”. (2) A.L. Bowley defined statistics as: “Statistics is the science of counting”. (3) A.L. Bowley has also defined it as: “science of averages”. (4) Prof. Boddington has defined statistics as: “science of estimates and probabilities”.
  • 16.
    16 (5) W.I kingdefined statistics as: “the science of statistics is the method of judging collective, natural or social phenomena from the results obtained from the analysis or enumeration or collection of estimates”. This definition is close to modern statistics but it doesn’t cover the entire scope. The most accurate definition was given by Secrist as: “Statistics are the numerical statements of facts capable of analysis and interpretation and the science of statistics is the study of the principles and the methods applied in collecting, presenting, analysis
  • 17.
    17 and interpreting thenumerical data in any field of inquiry”. Variable: Any phenomenon that may change from one individual to another or from one object to another object is called a variable e.g. height, weight and blood pressure etc. Constant: Any phenomenon that cannot be changed or that remains fixed is called a constant e.g. the number of days in a week, the number of months in a calendar year etc.
  • 18.
    18 Discrete variable: A variableis called a discrete variable if it can take only some specific values in a given interval. A variable that is the result of counting or enumeration is called a discrete variable. It may also be called count variable. A set of observations on discrete variable is called discrete data. E.g. the number of goals scored in a hockey match is an example of a discrete variable. Continuous variable: A variable which can assume all possible values within a given range is called a continuous variable.
  • 19.
    19 It may alsobe called measure variable. A set of observations on a continuous variable is called continuous data. E.g. temperature at a certain place is an example of a continuous variable. Quantitative Data: A set of observations generated by counting (enumeration) or by measurements is called quantitative data. Both discrete and continuous data come under the quantitative data. The data on the number of accidents on roads, the number of teachers in different schools, the intelligence quotients of the students, the temperature in
  • 20.
    20 different cities, theconsumption of electricity in different houses are quantitative data. Qualitative Data: The word Qualitative data is used for that information which is generated by observing the presence or absence of some quality (called attribute) in individuals. The individuals may be the students and the quality may be the intelligence. We examine whether or not intelligence is present in the students. The observations are recorded with the help of ‘yes’ for intelligence and ‘no’ for non-intelligence. Thus
  • 21.
    21 ‘yes’ or ‘no’generate the observations and the data thus obtained are called qualitative data.
  • 22.
    22 “Let’s work onsome numerical data”
  • 23.
    23 X 1 35 7 9 11 Y 10 8 6 4 2 1