This document provides an introduction to statistics, covering several key topics:
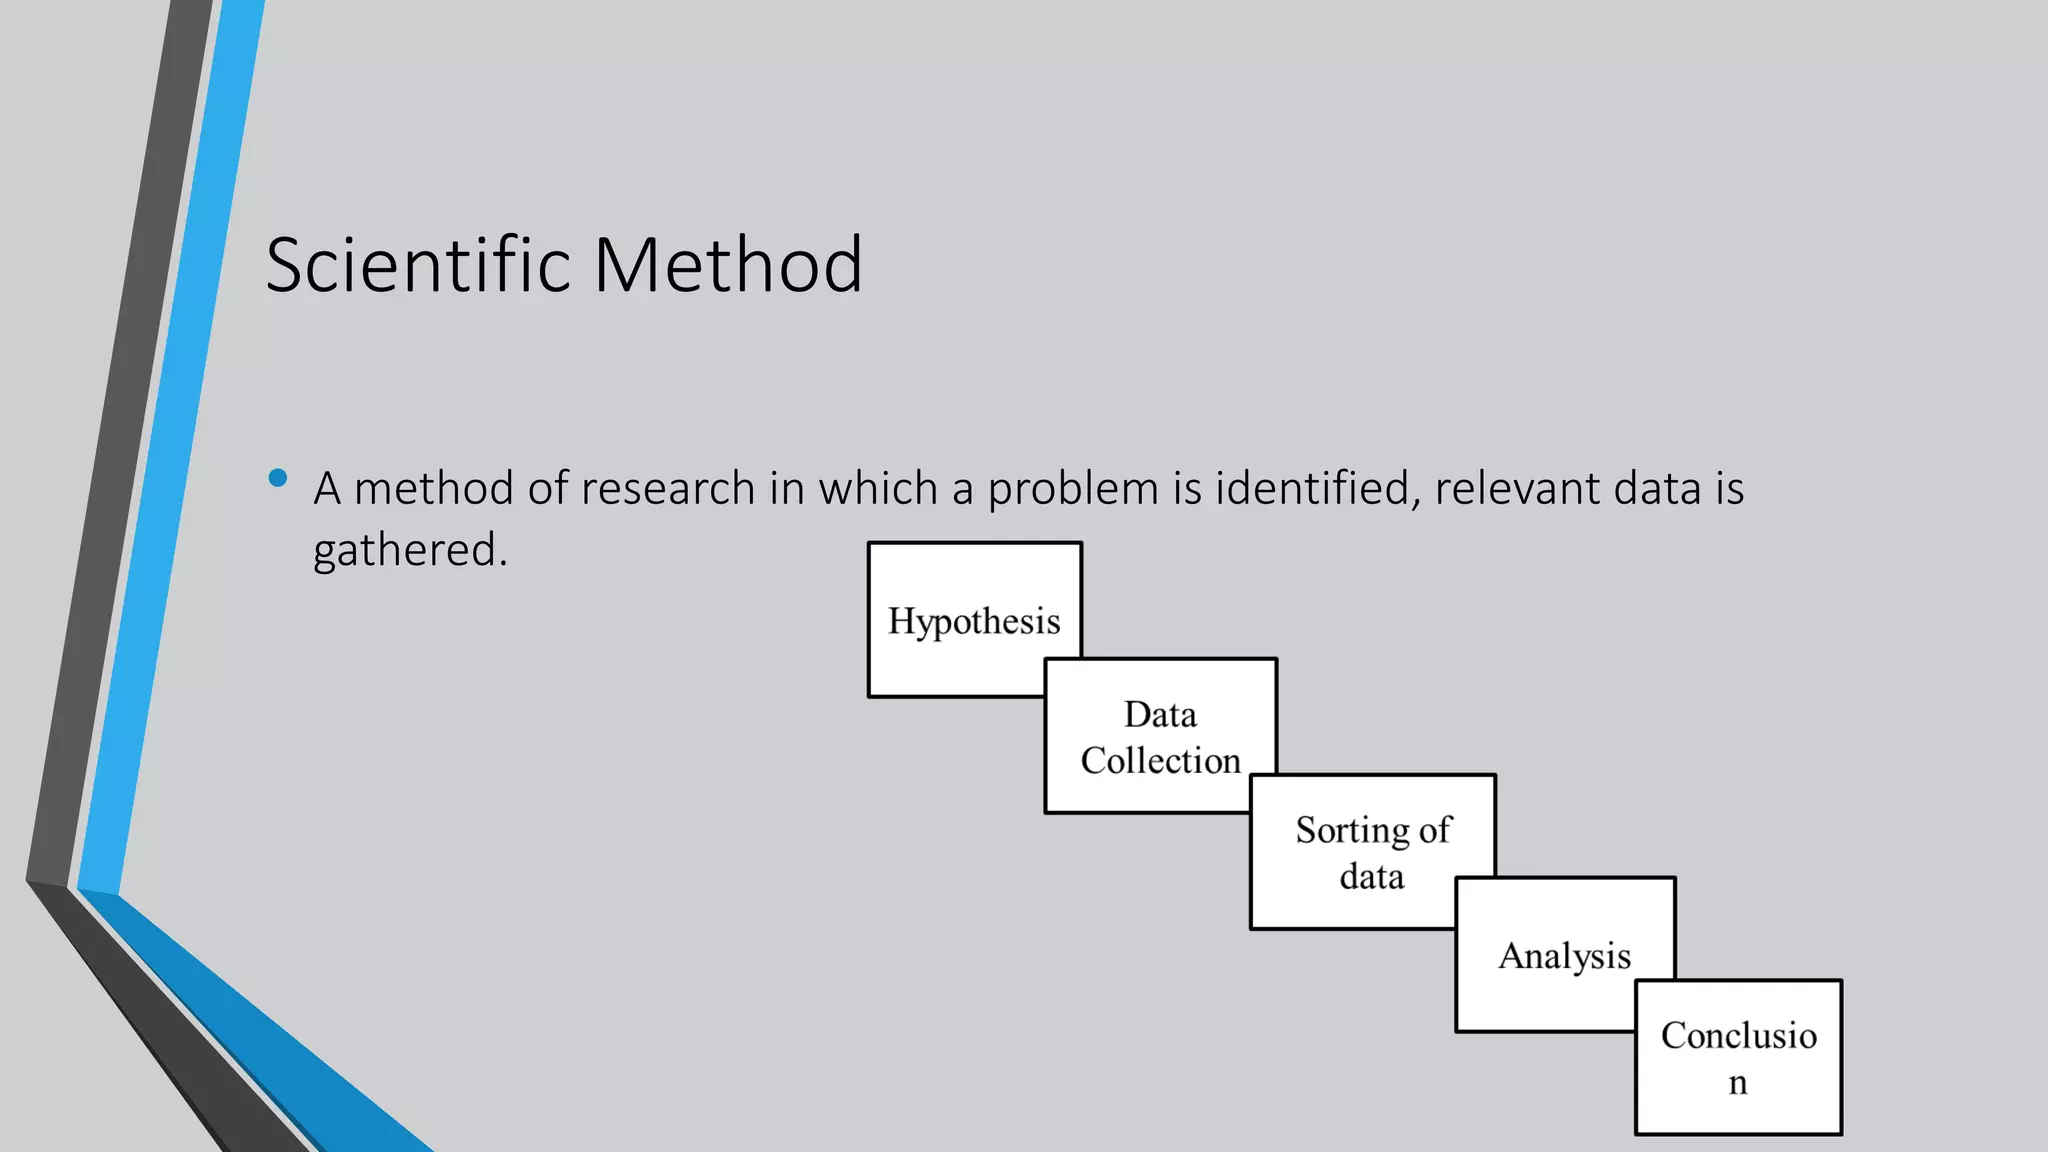
- It defines statistics as the science dealing with data collection and analysis.
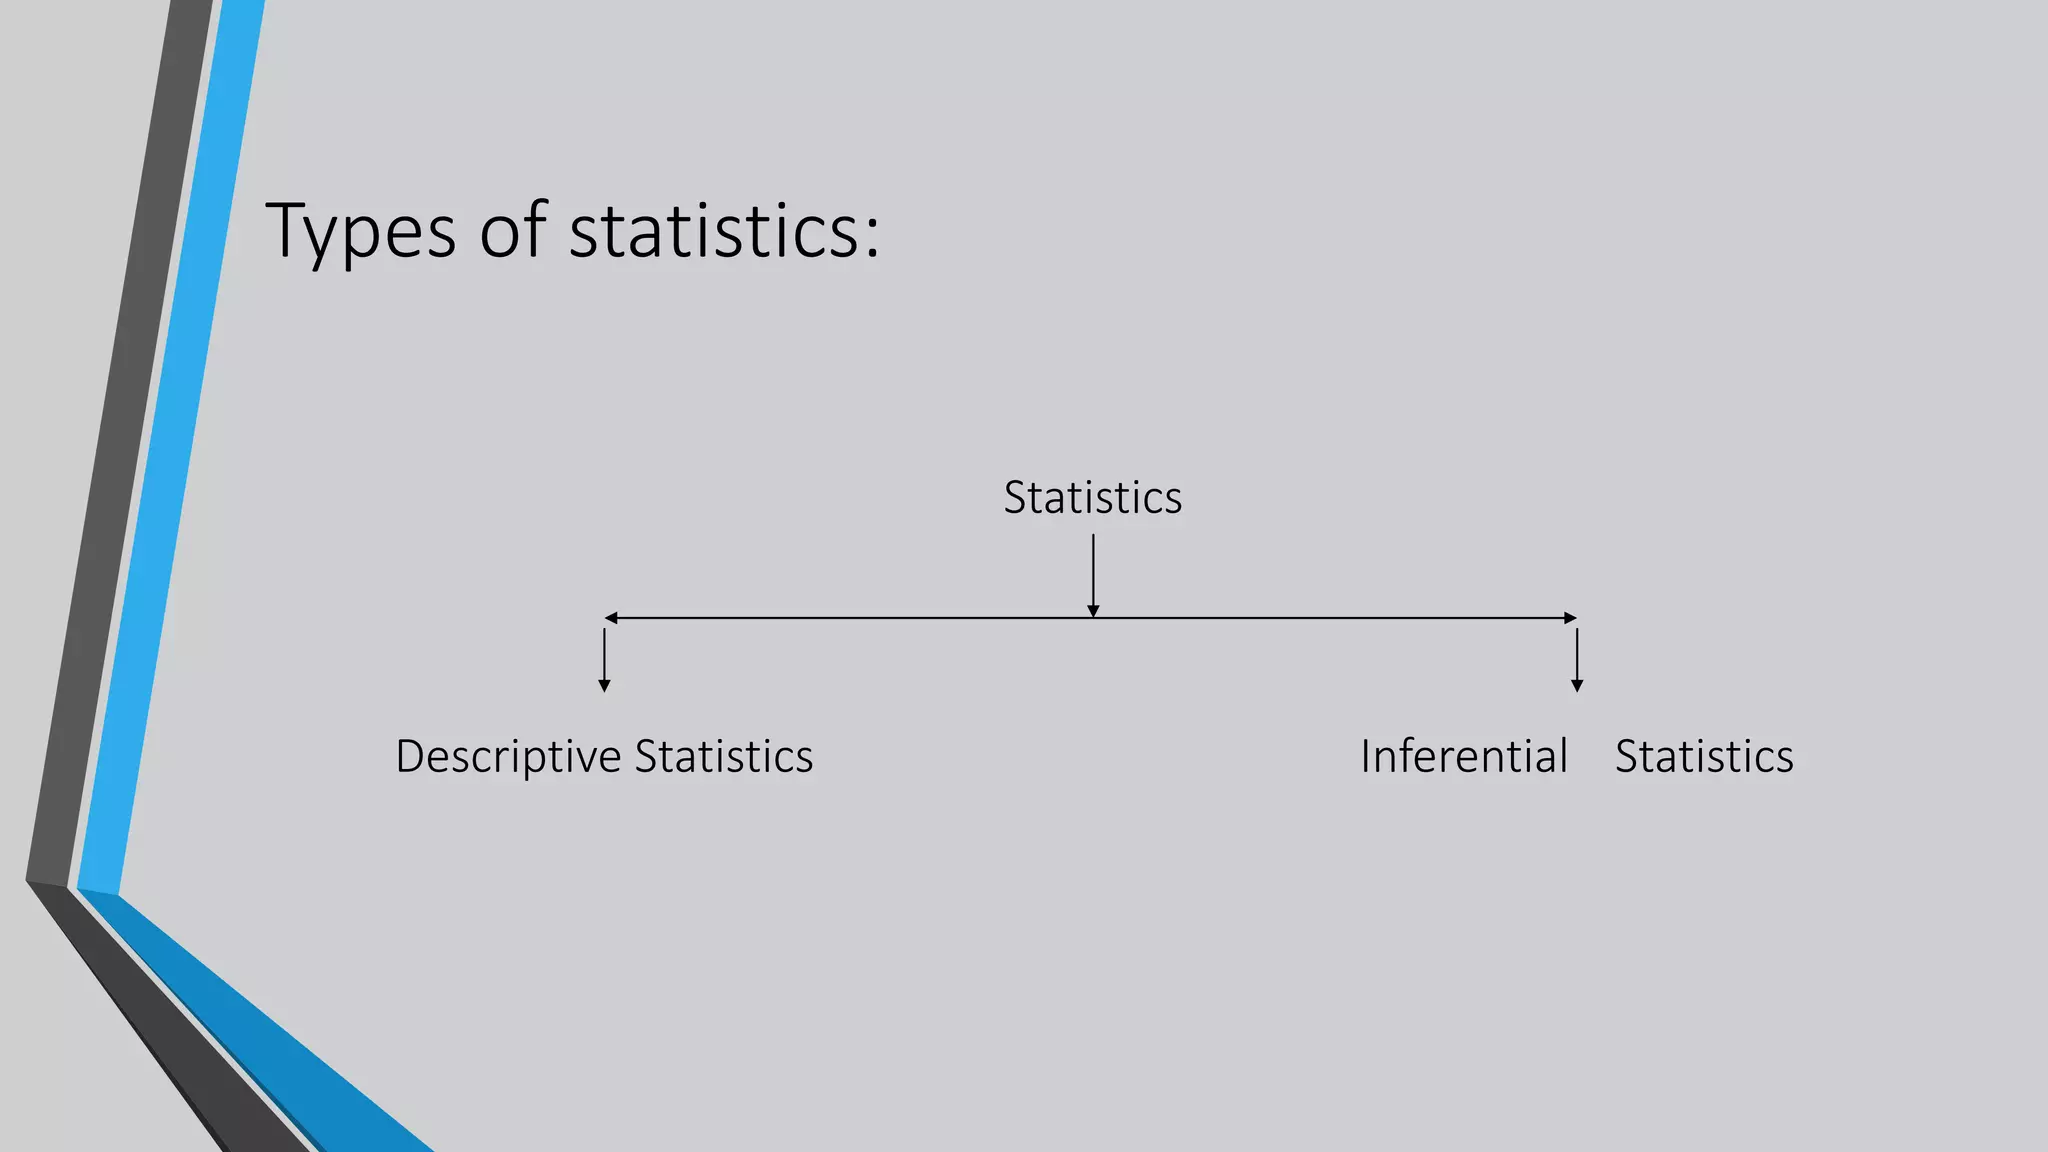
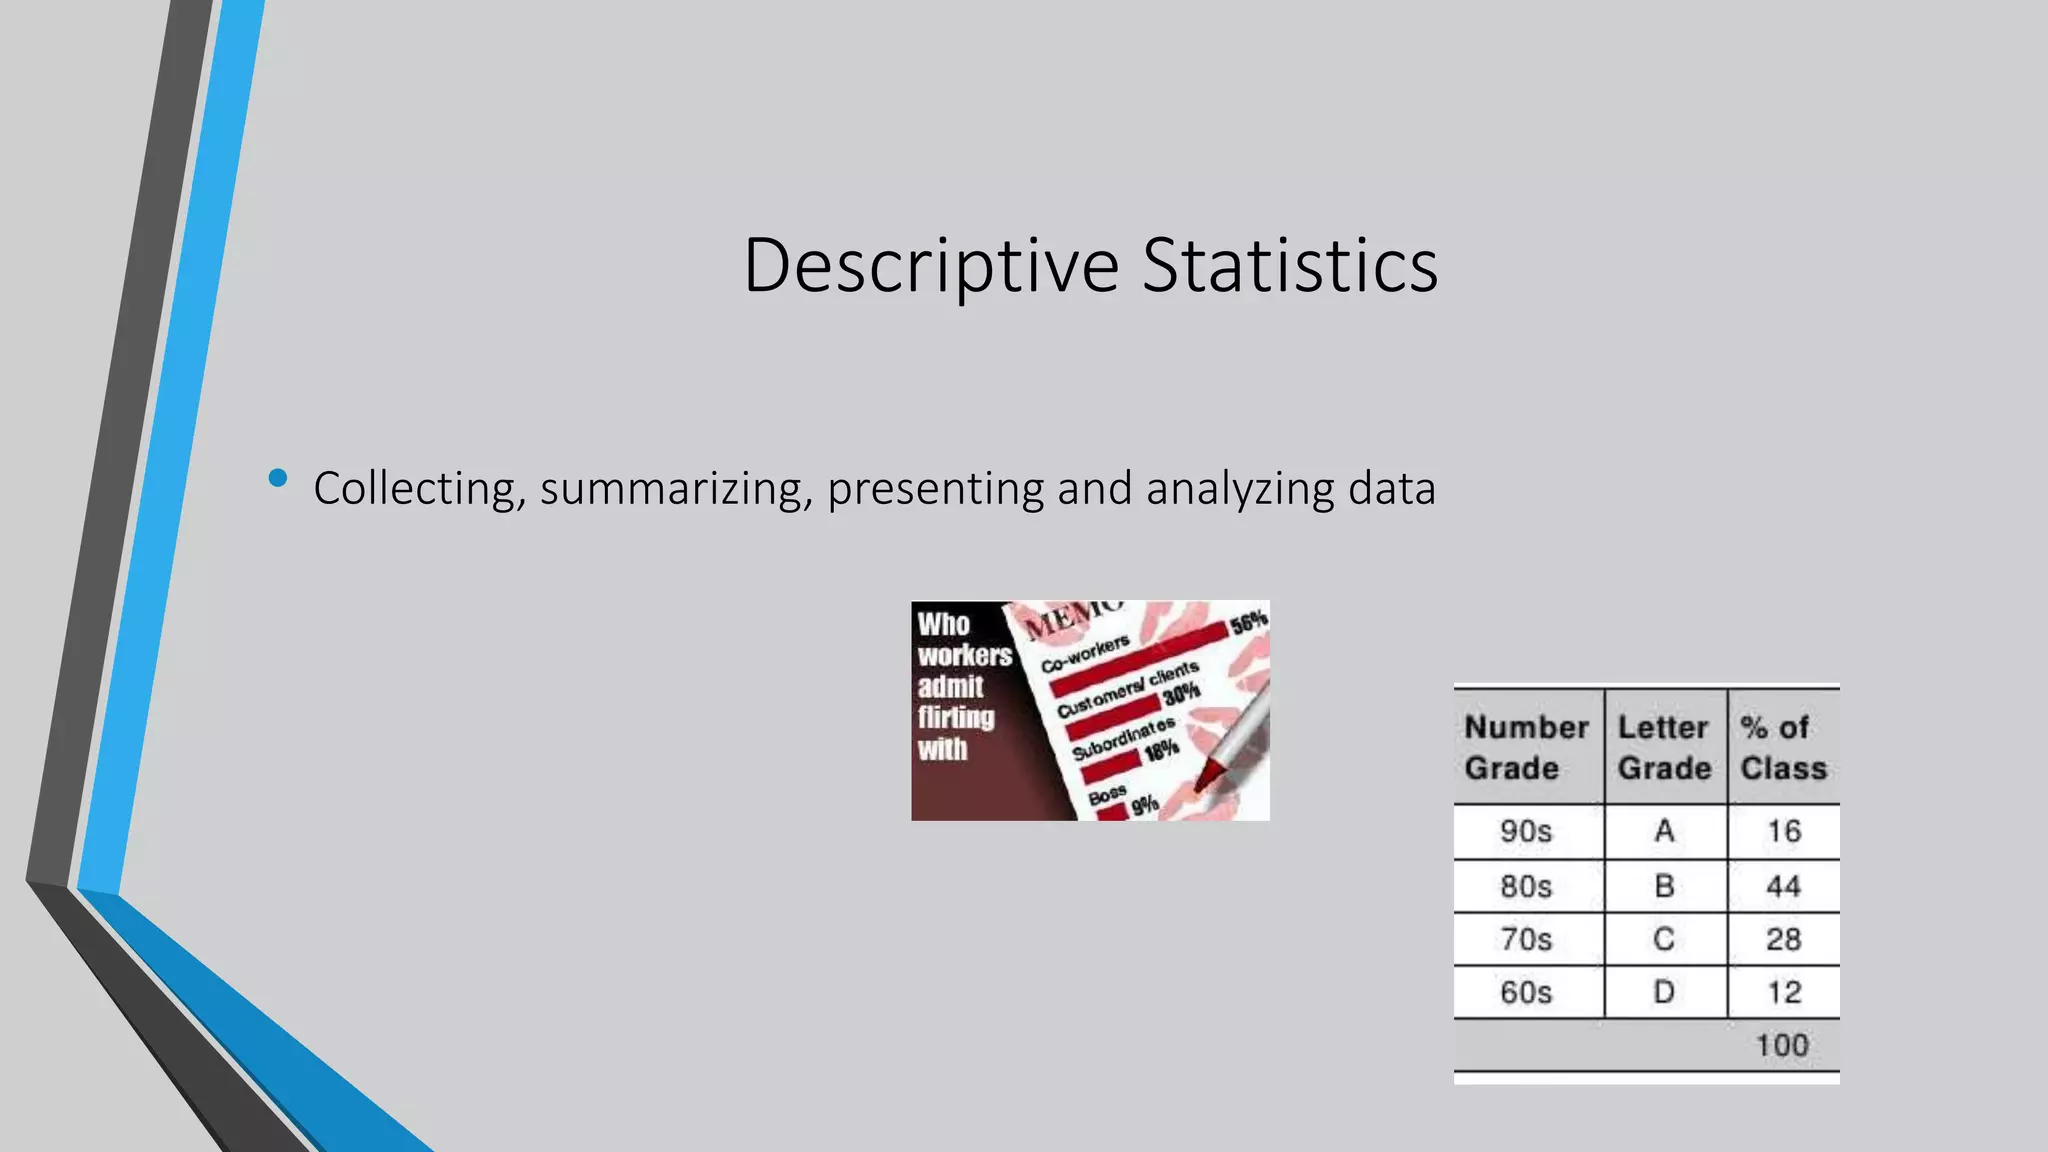
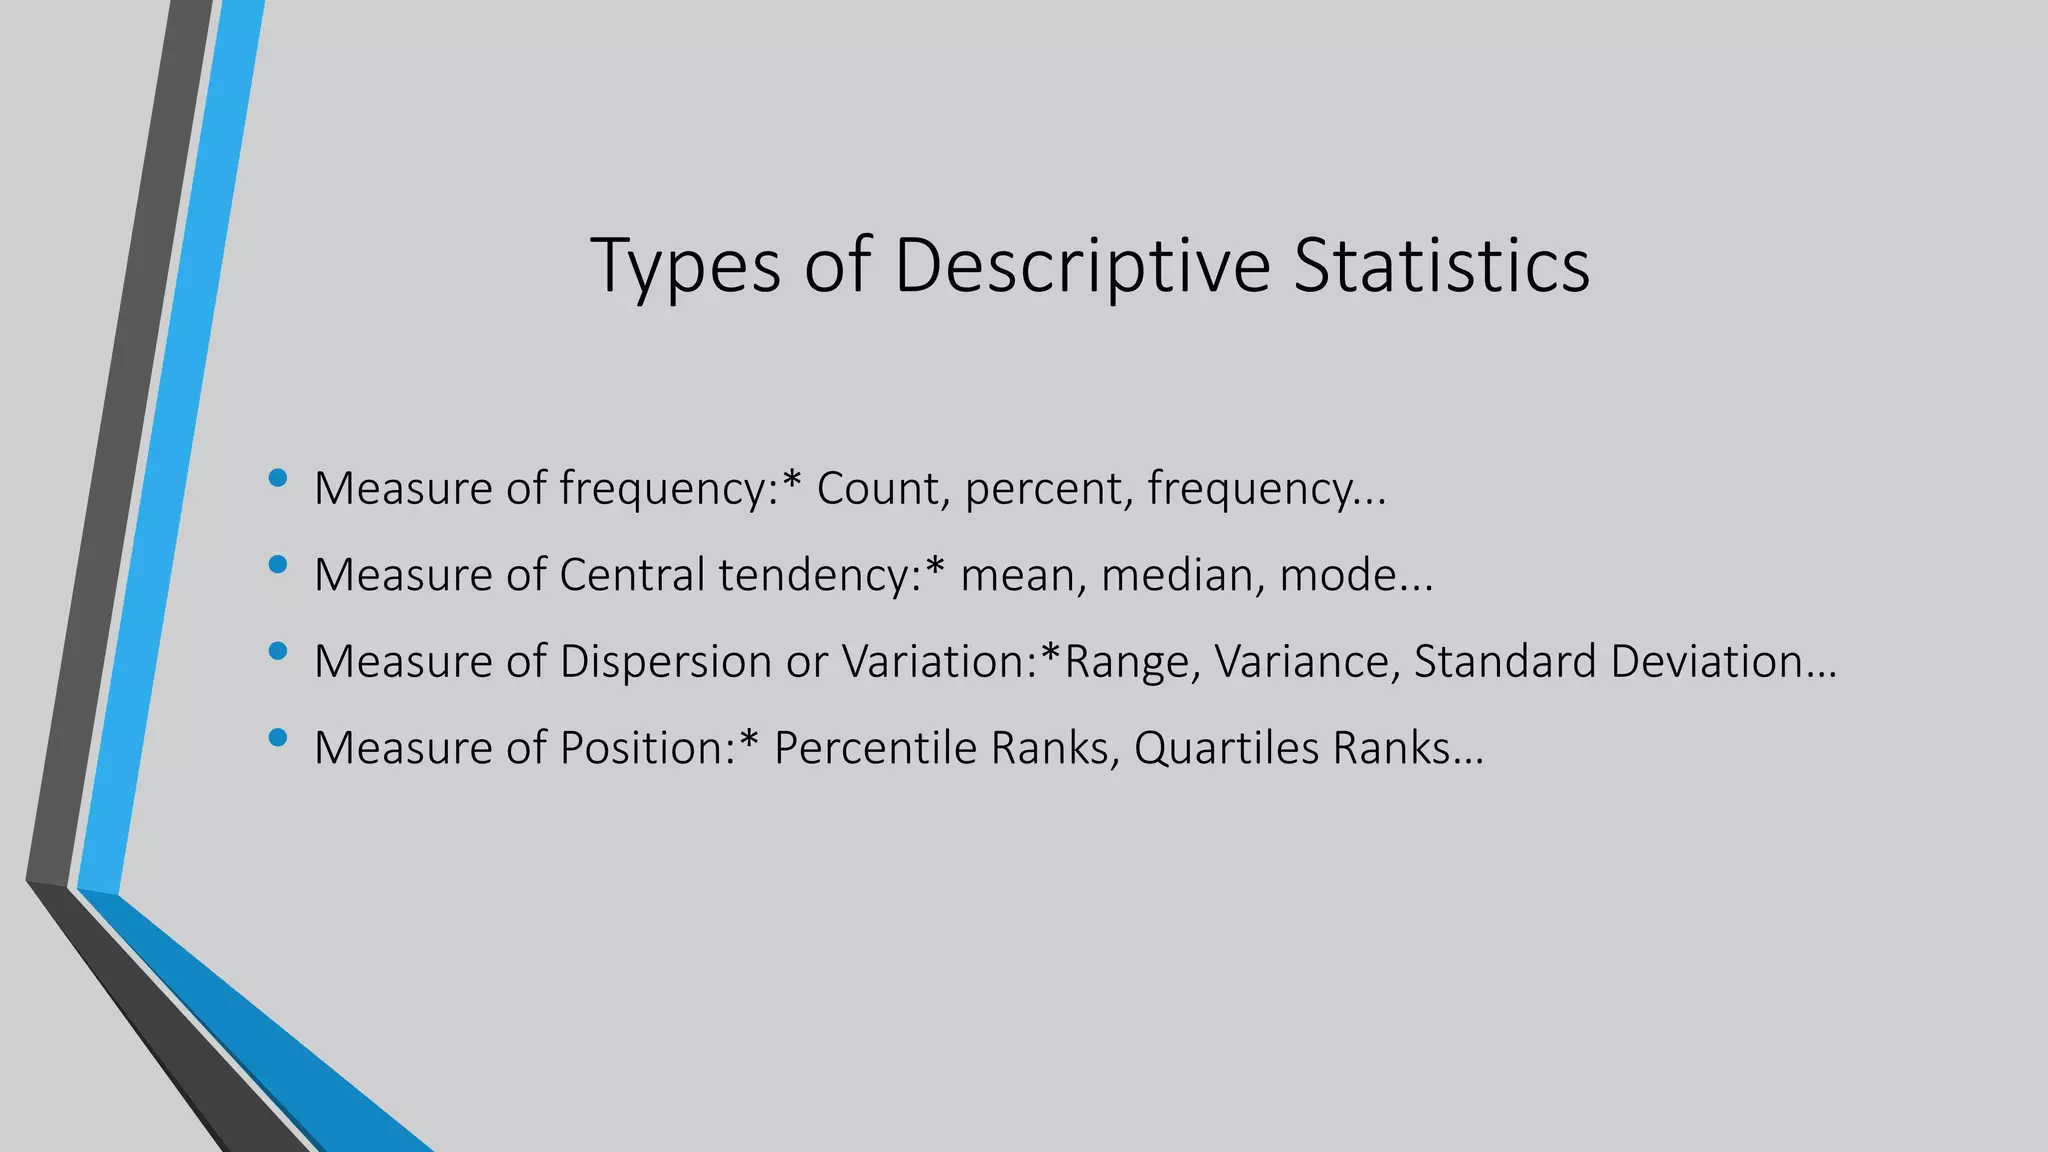
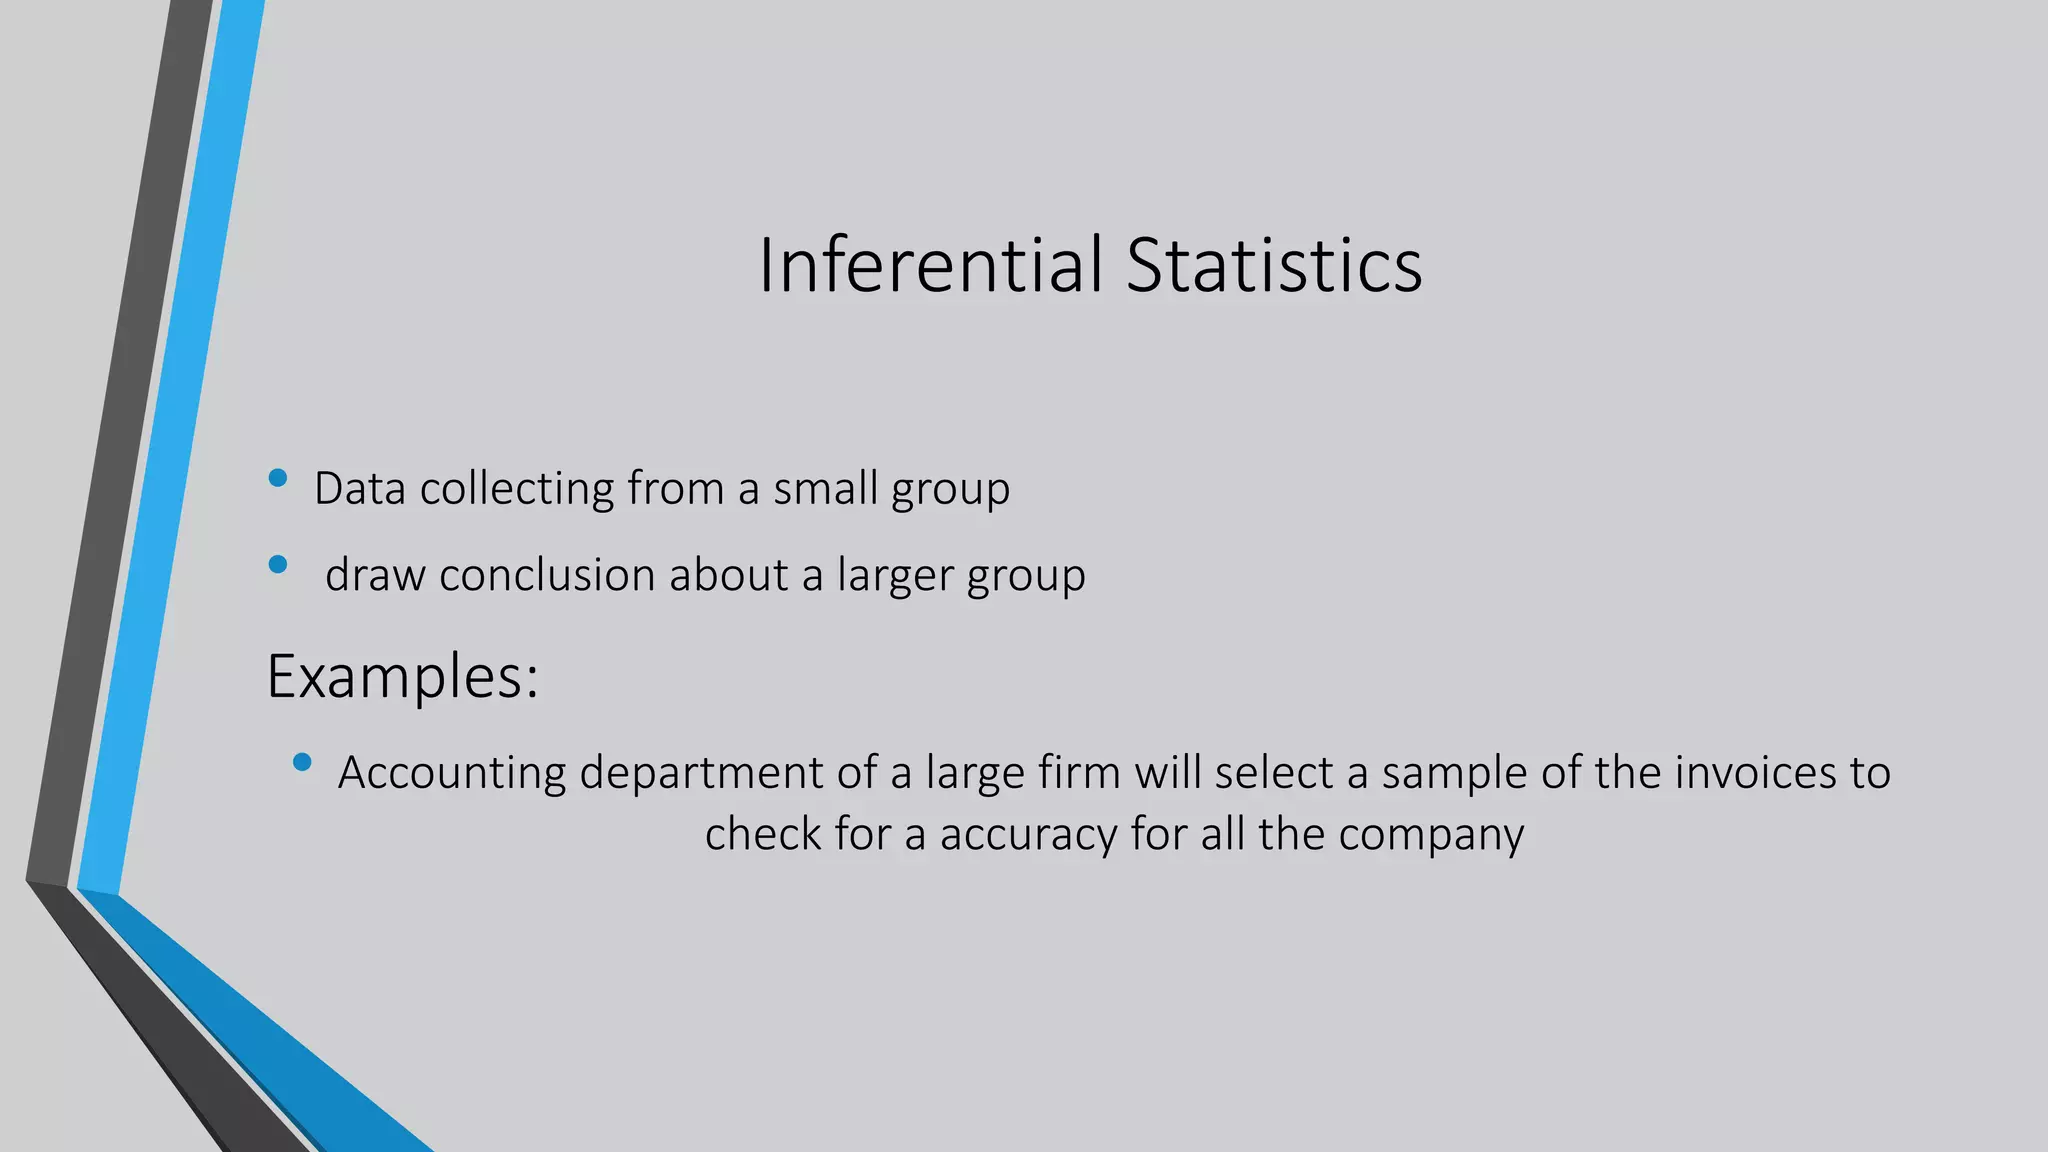
- Descriptive and inferential statistics are introduced, where descriptive involves summarizing data and inferential involves making conclusions beyond the sample data.
- The main concepts of population, sample, parameter, and estimator are defined.
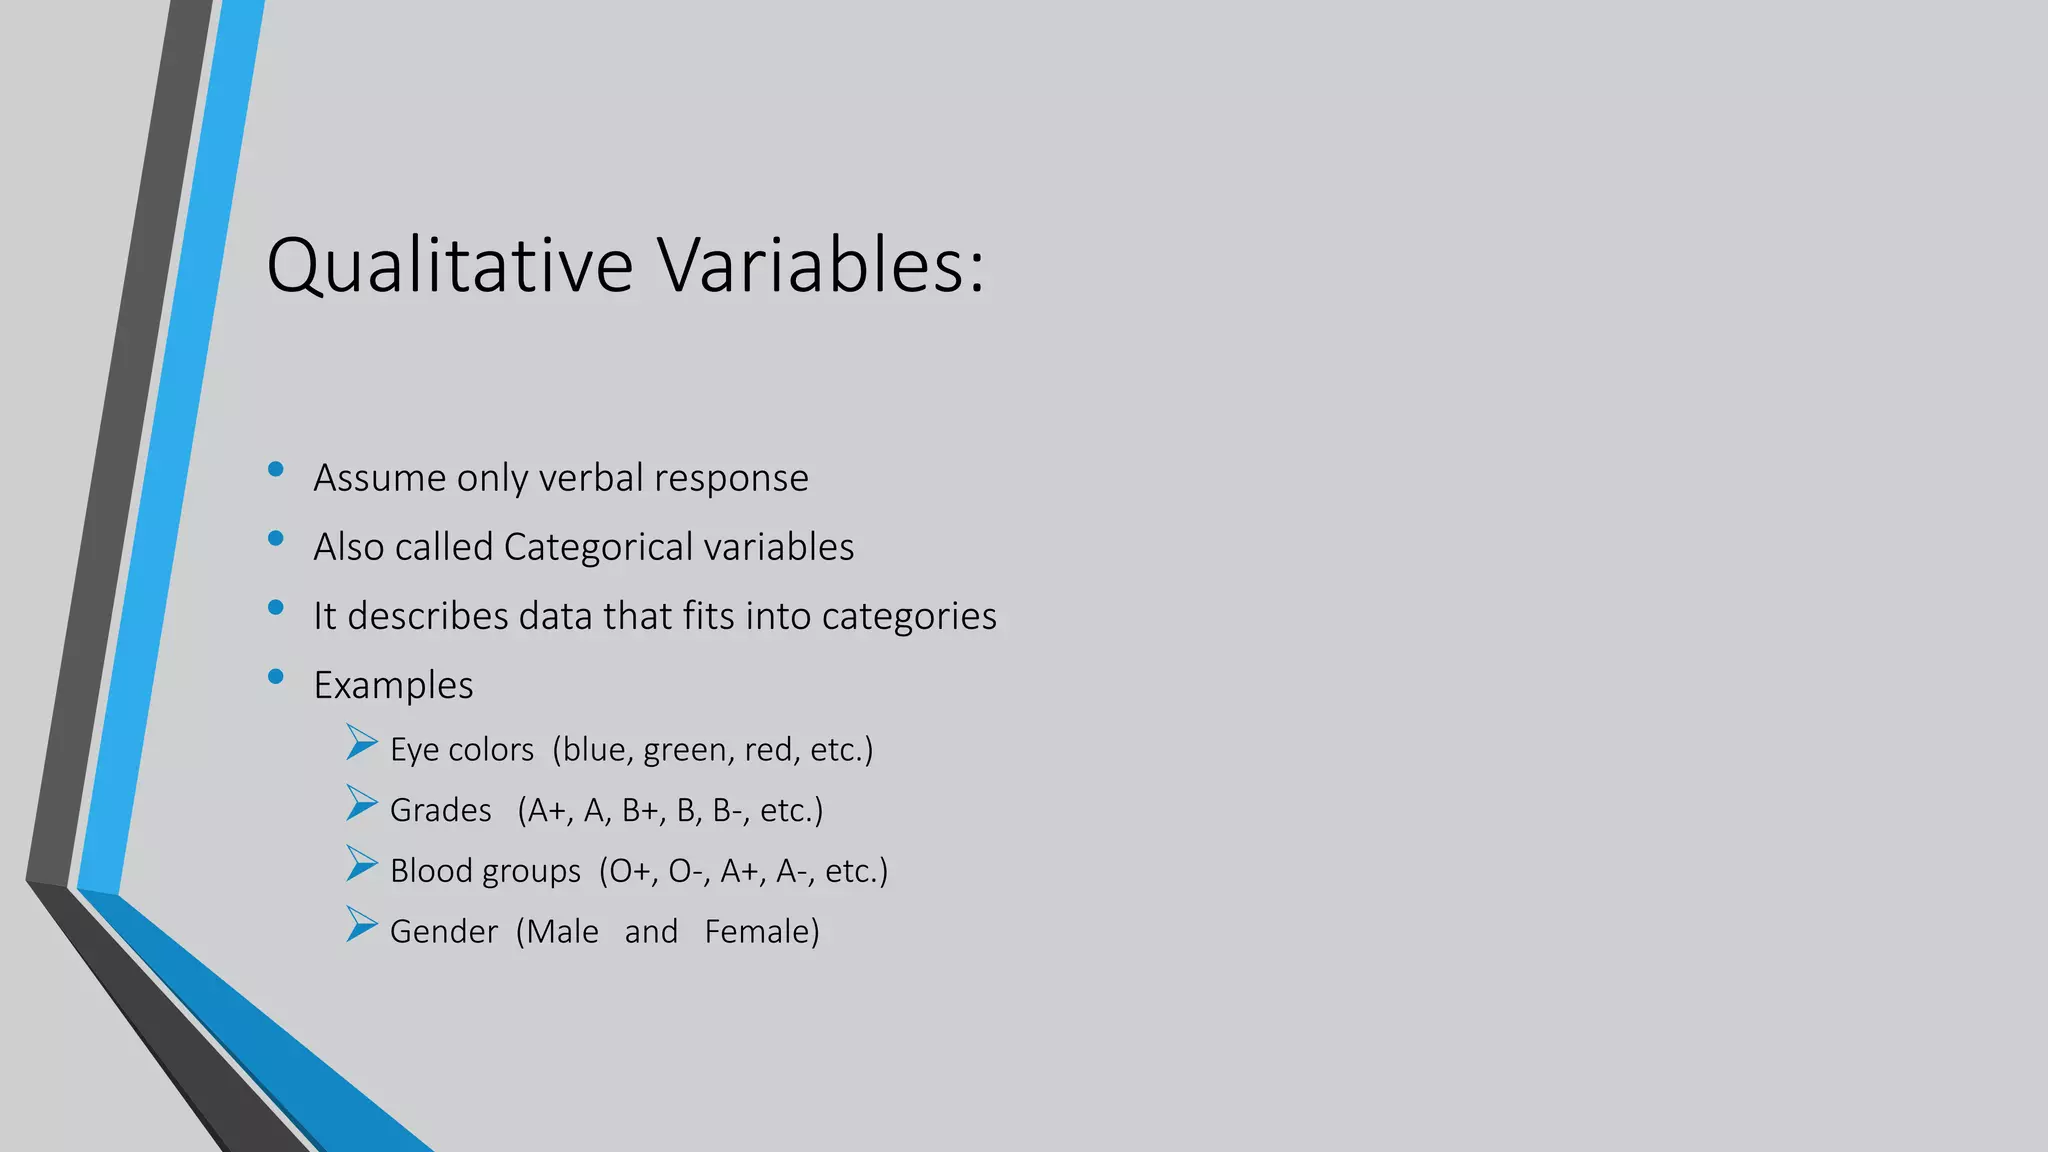
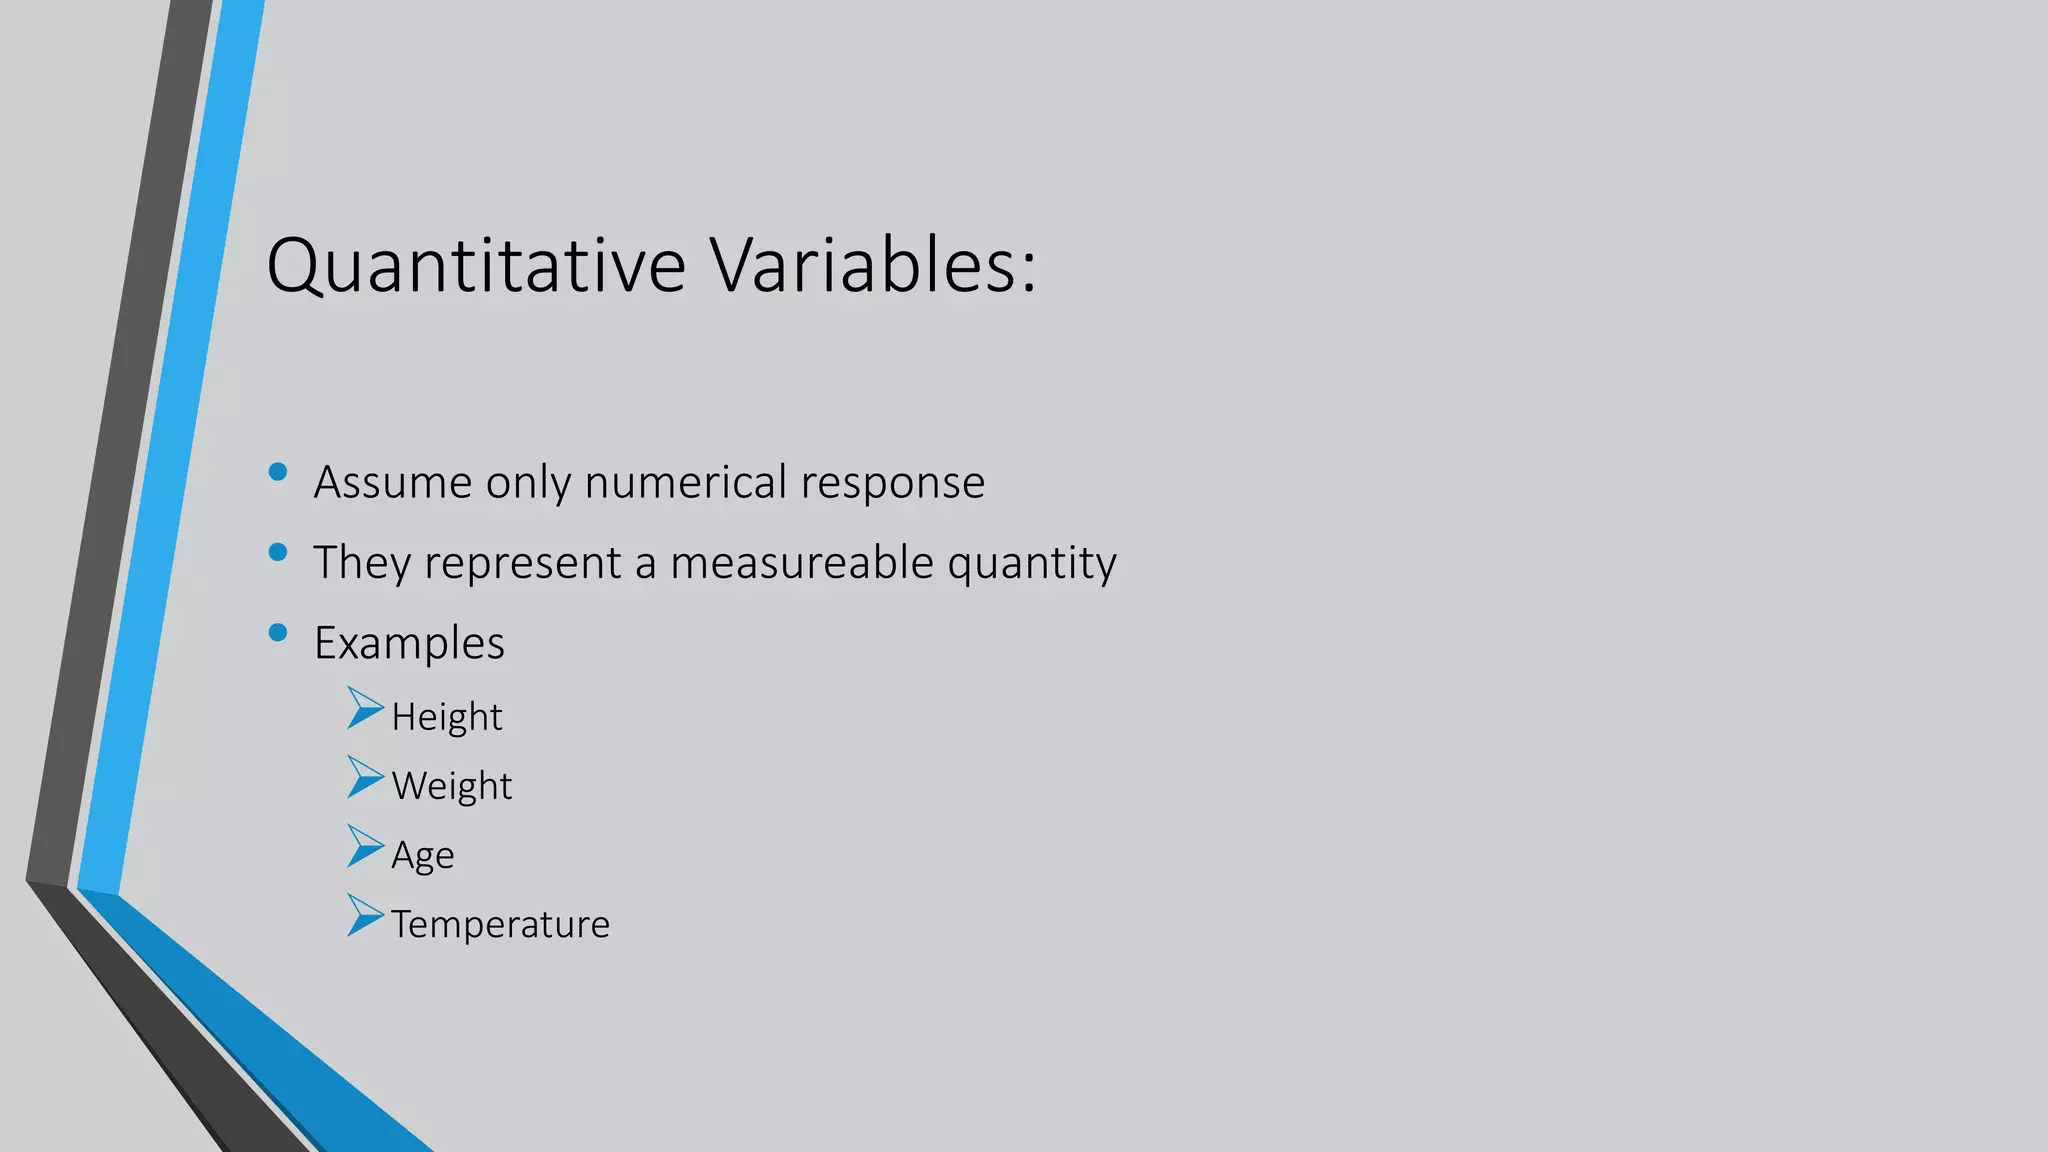
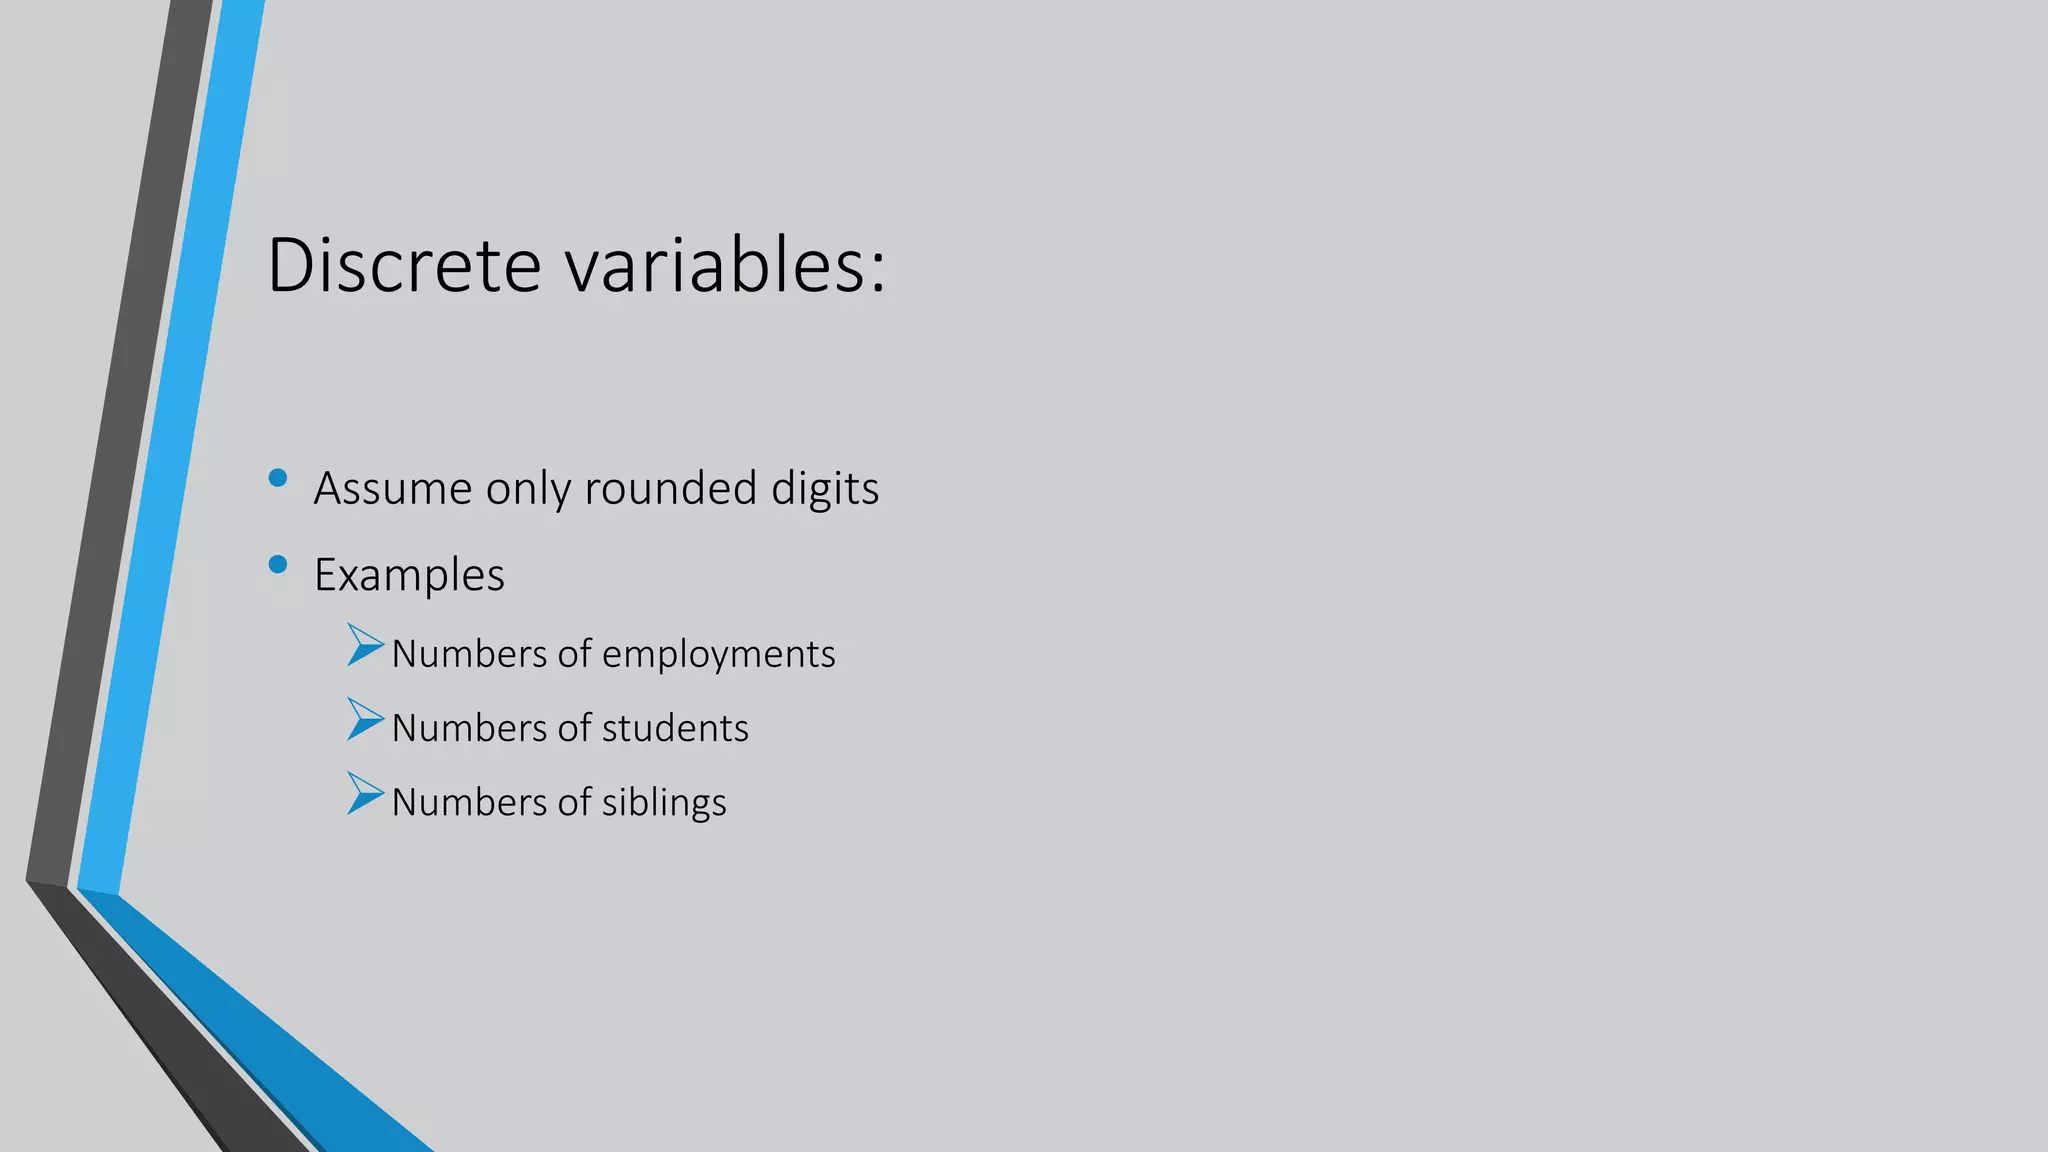
- Variables are described as being either qualitative or quantitative, and quantitative variables are further divided into discrete and continuous.
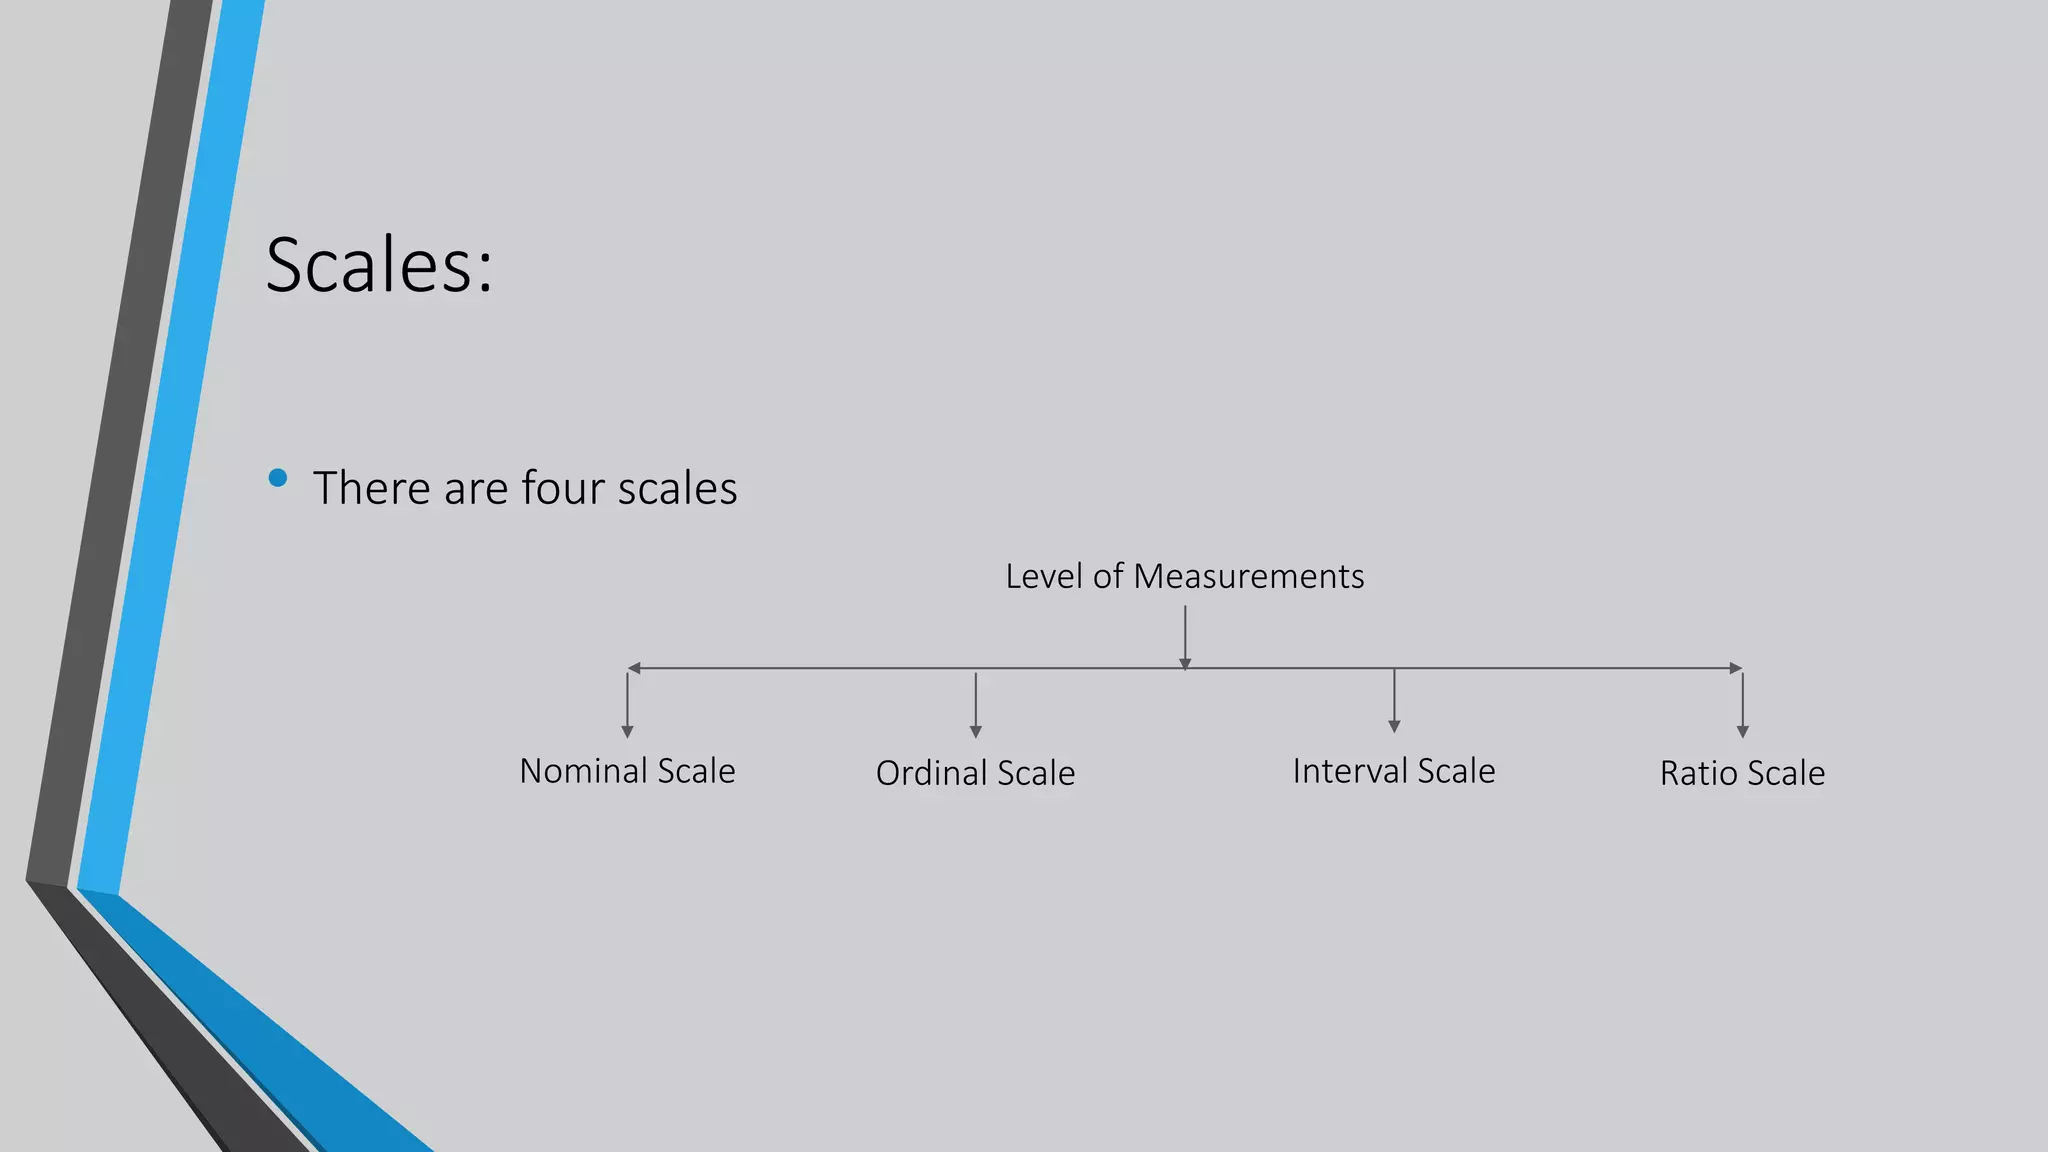
- The four levels of measurement - nominal, ordinal, interval, and ratio scales - are outlined.
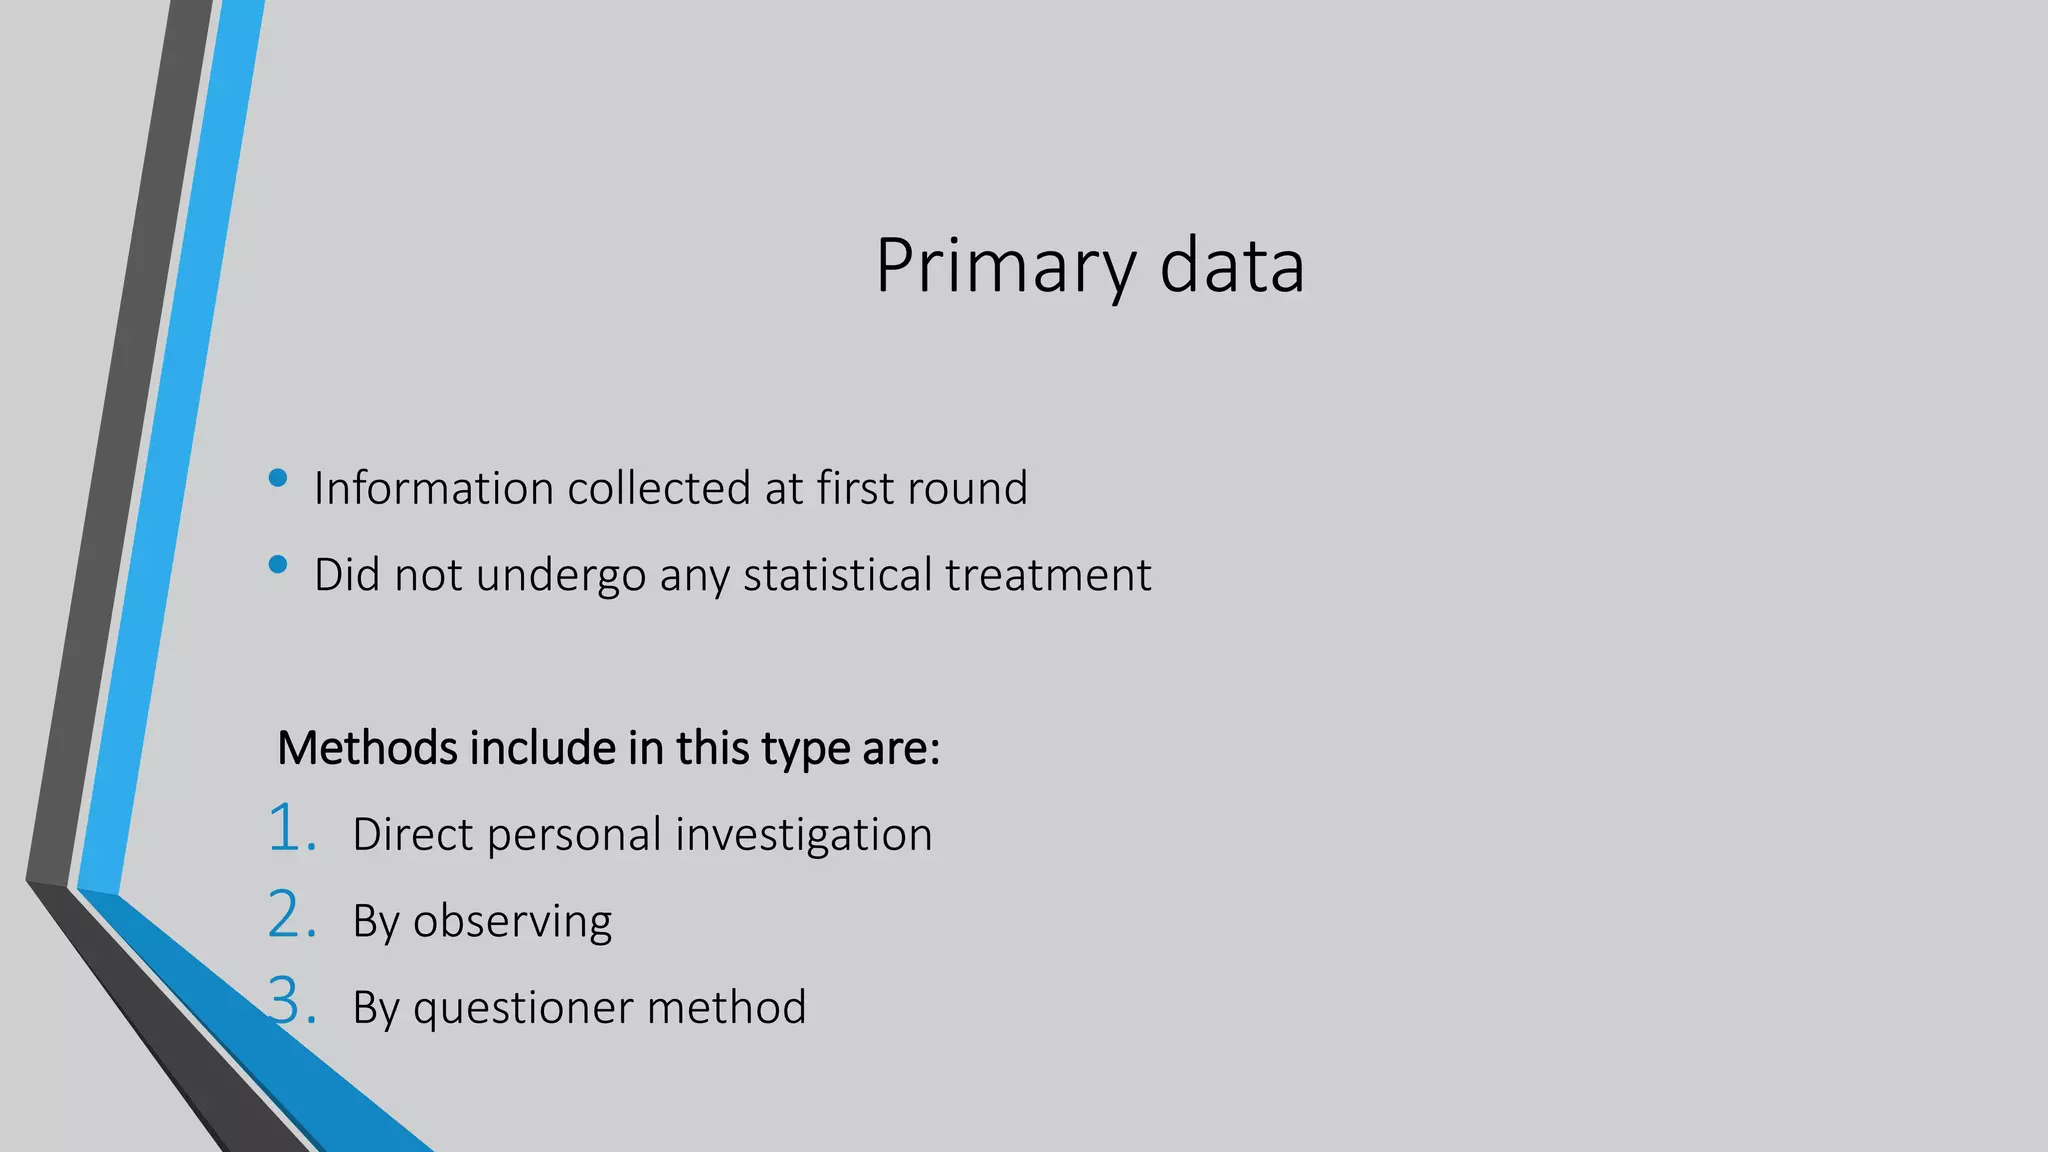
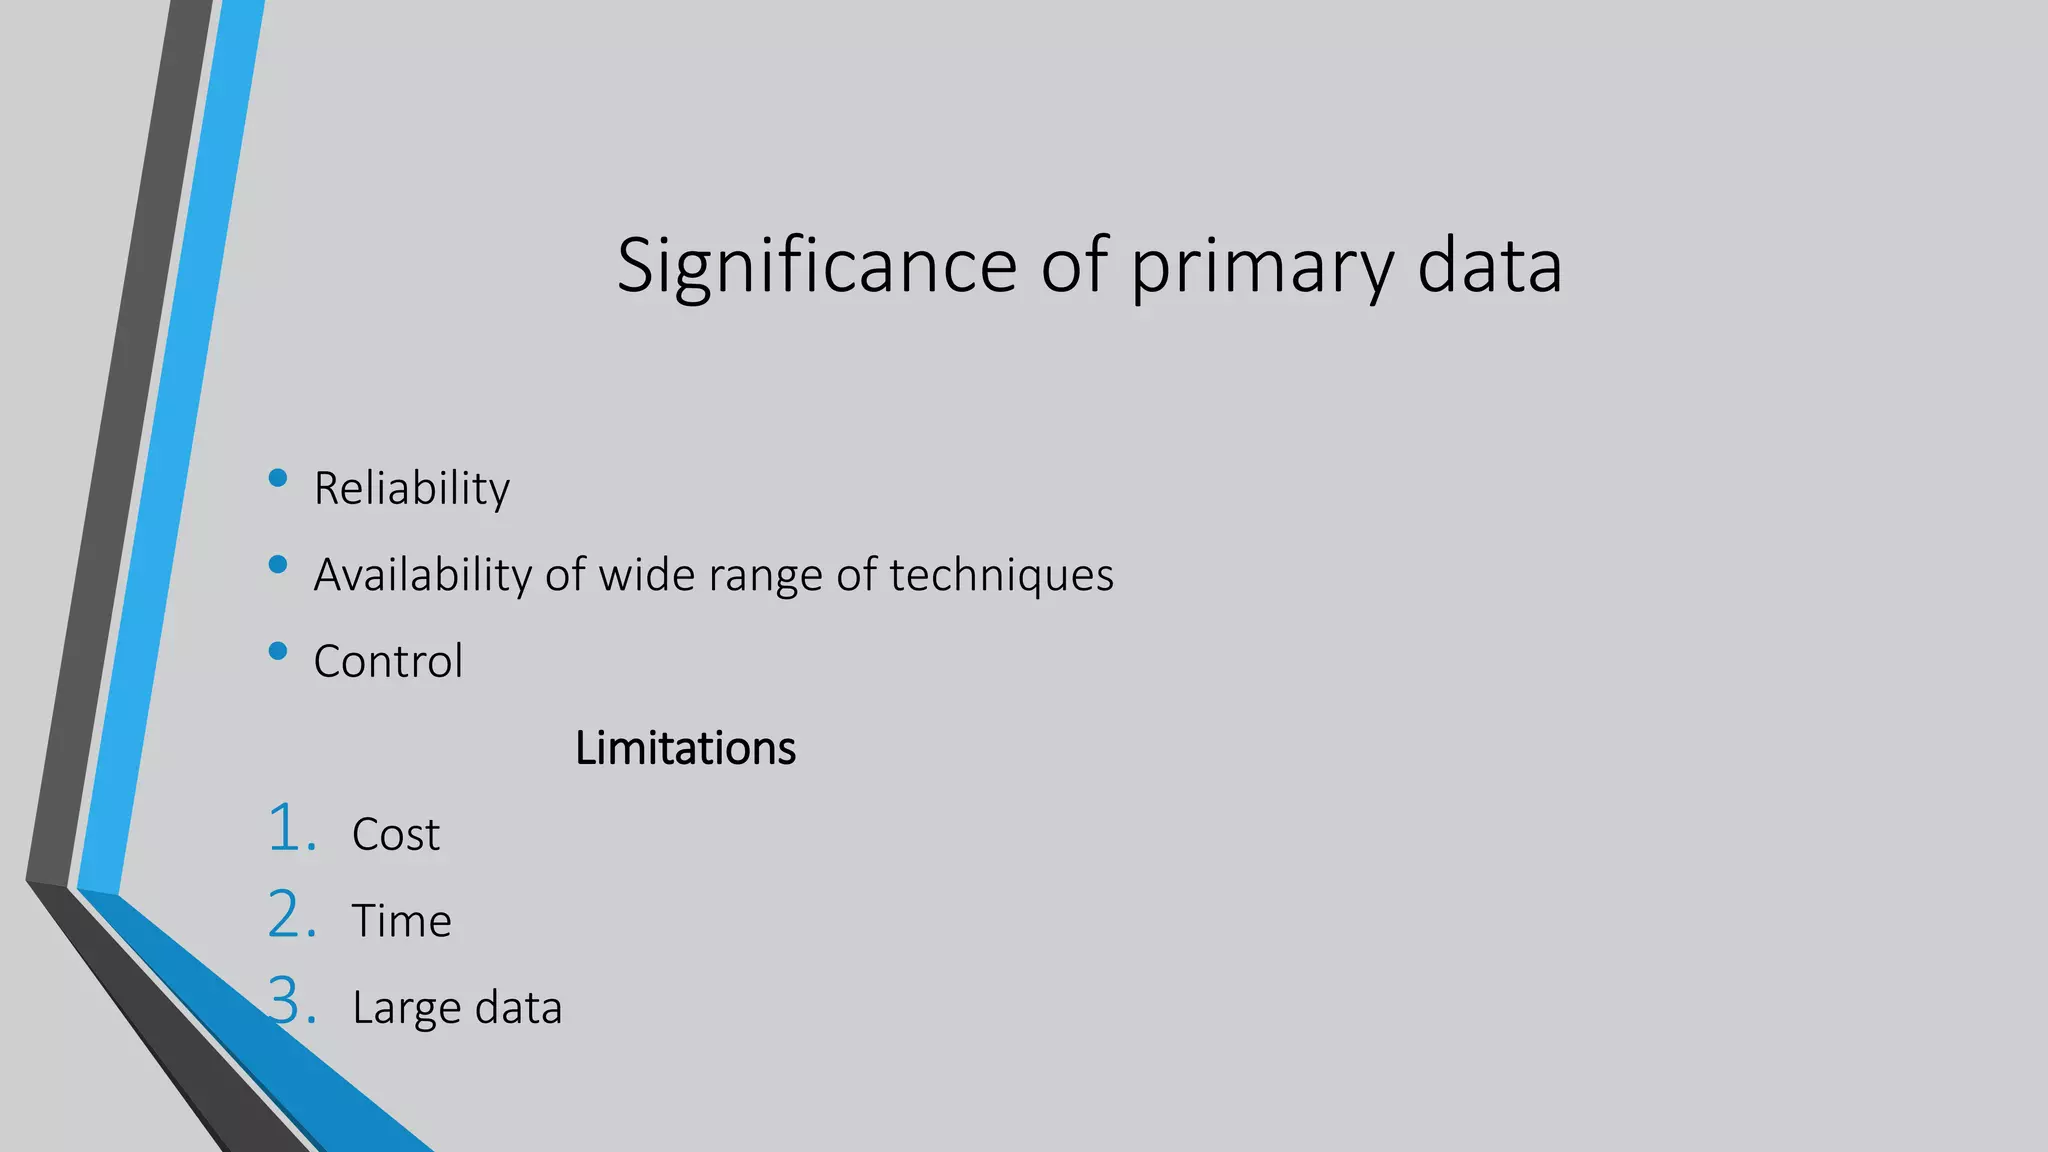
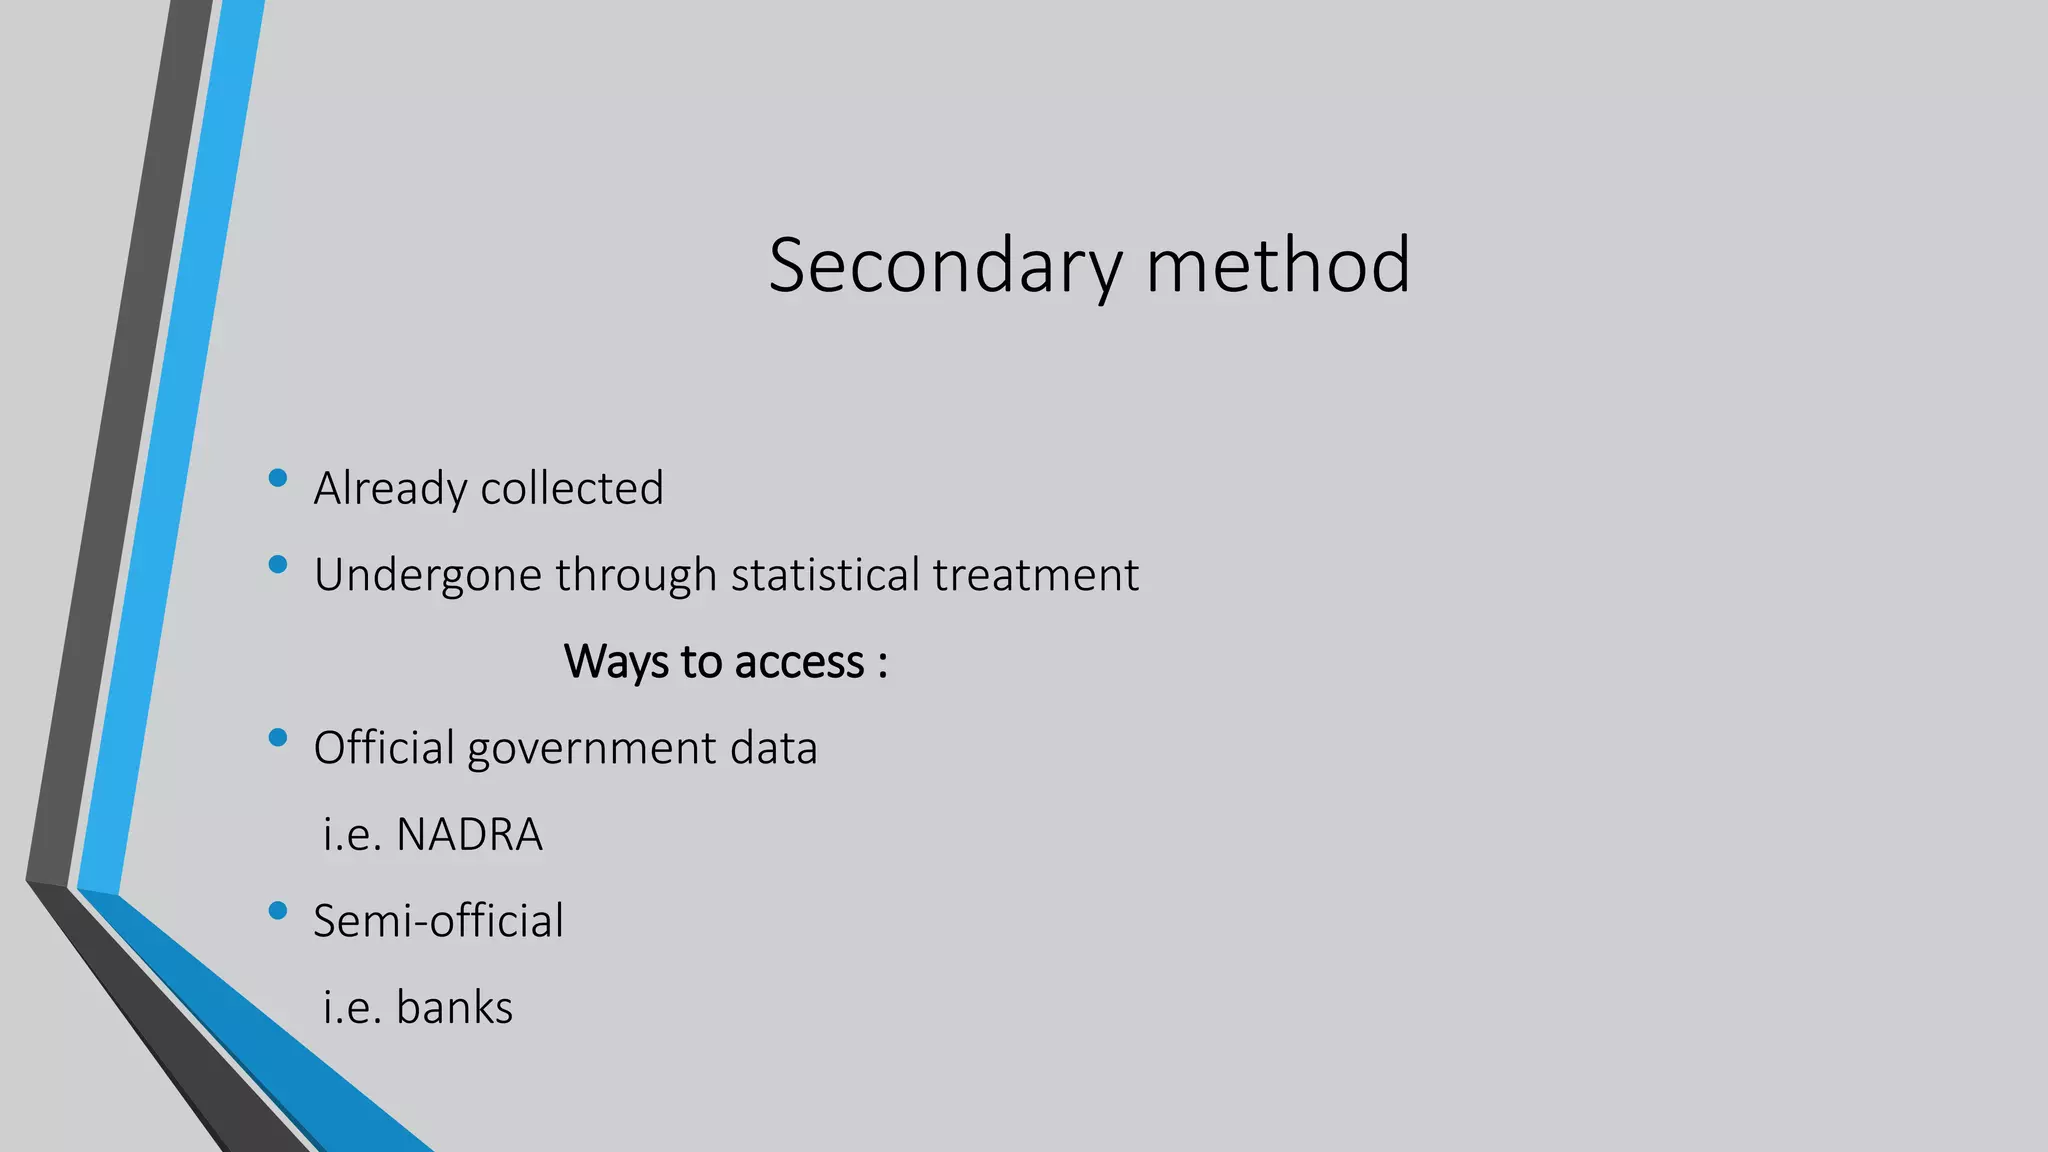
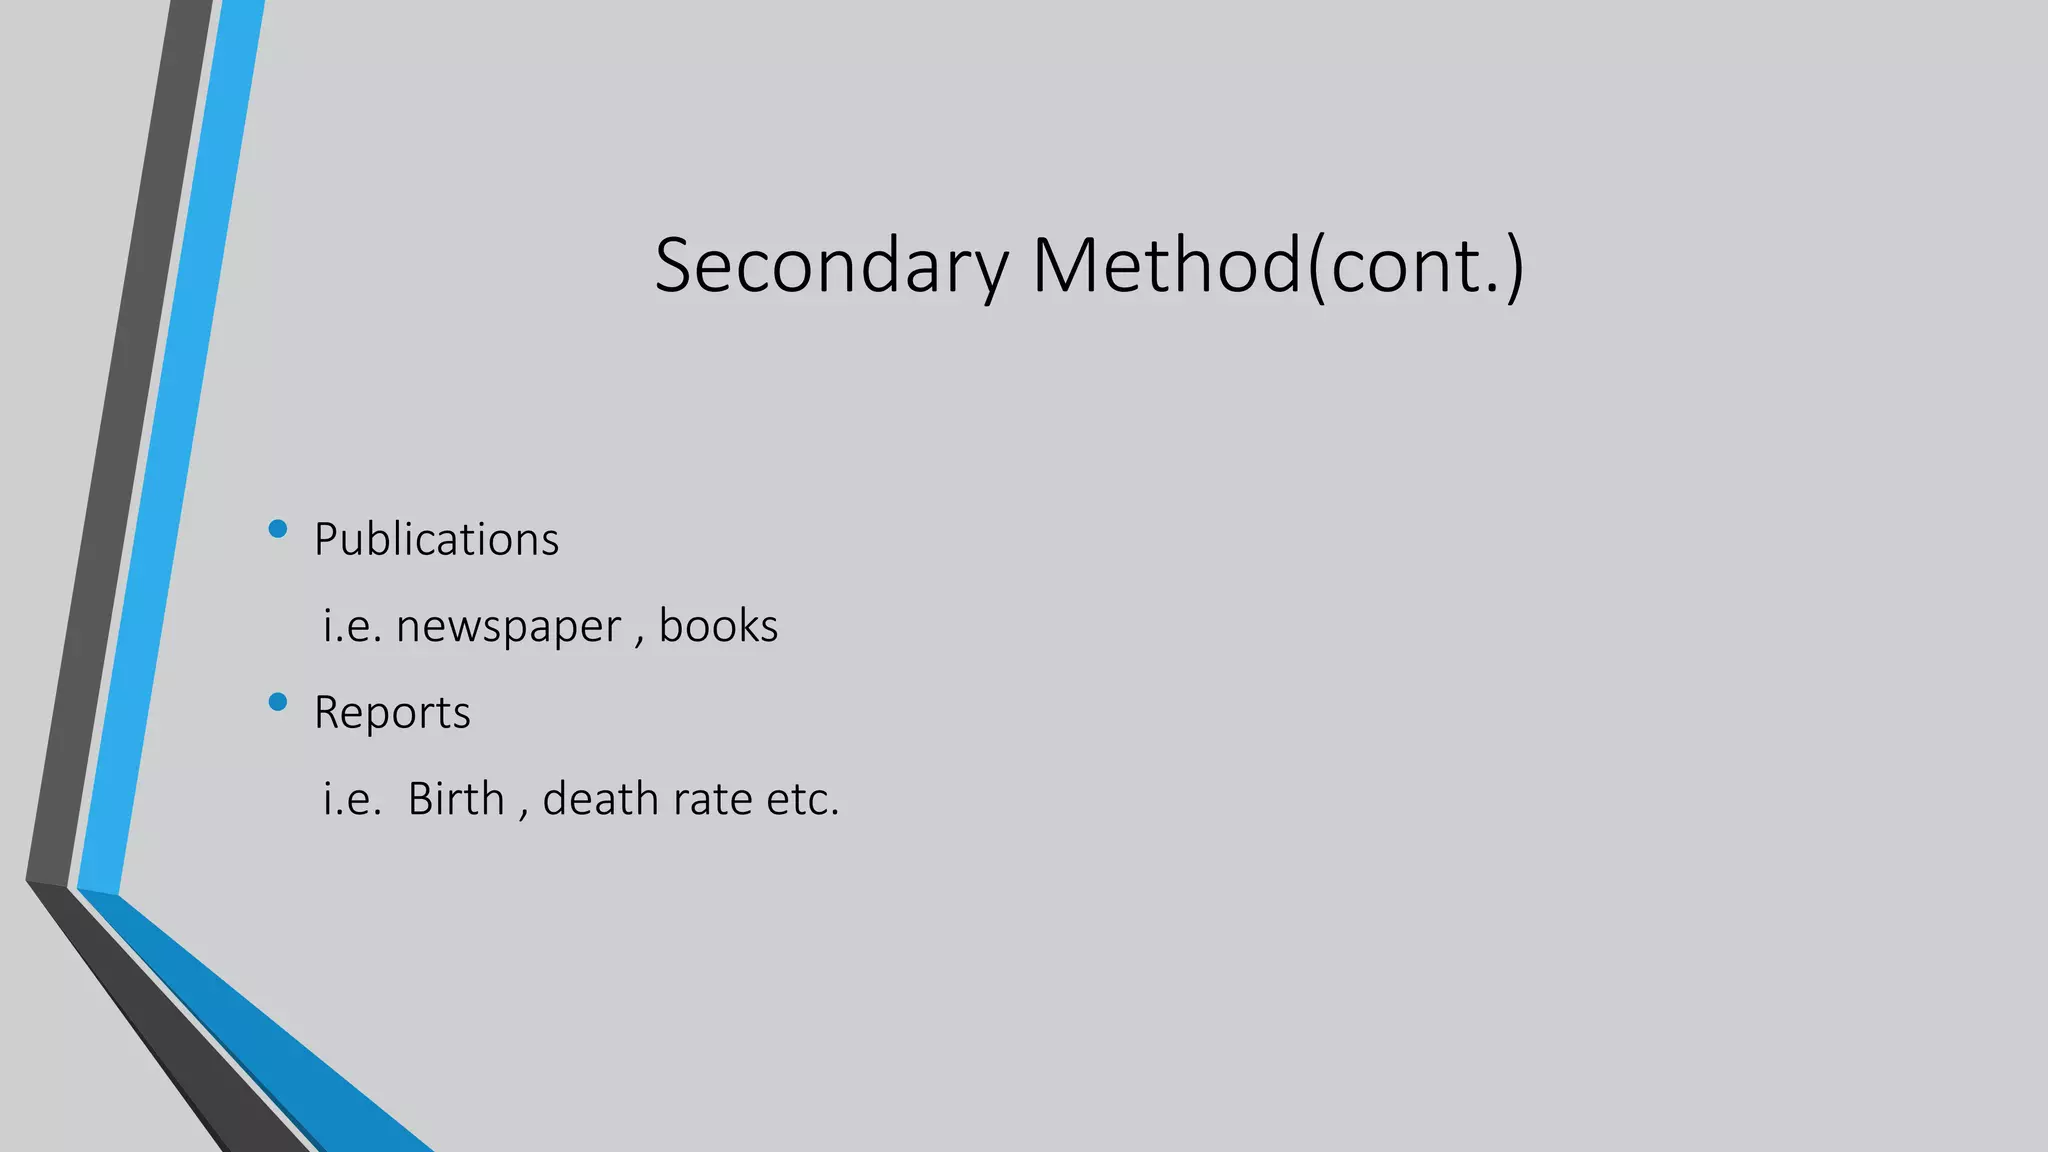
- Finally, the two main methods for data collection - primary and secondary data - are discussed.