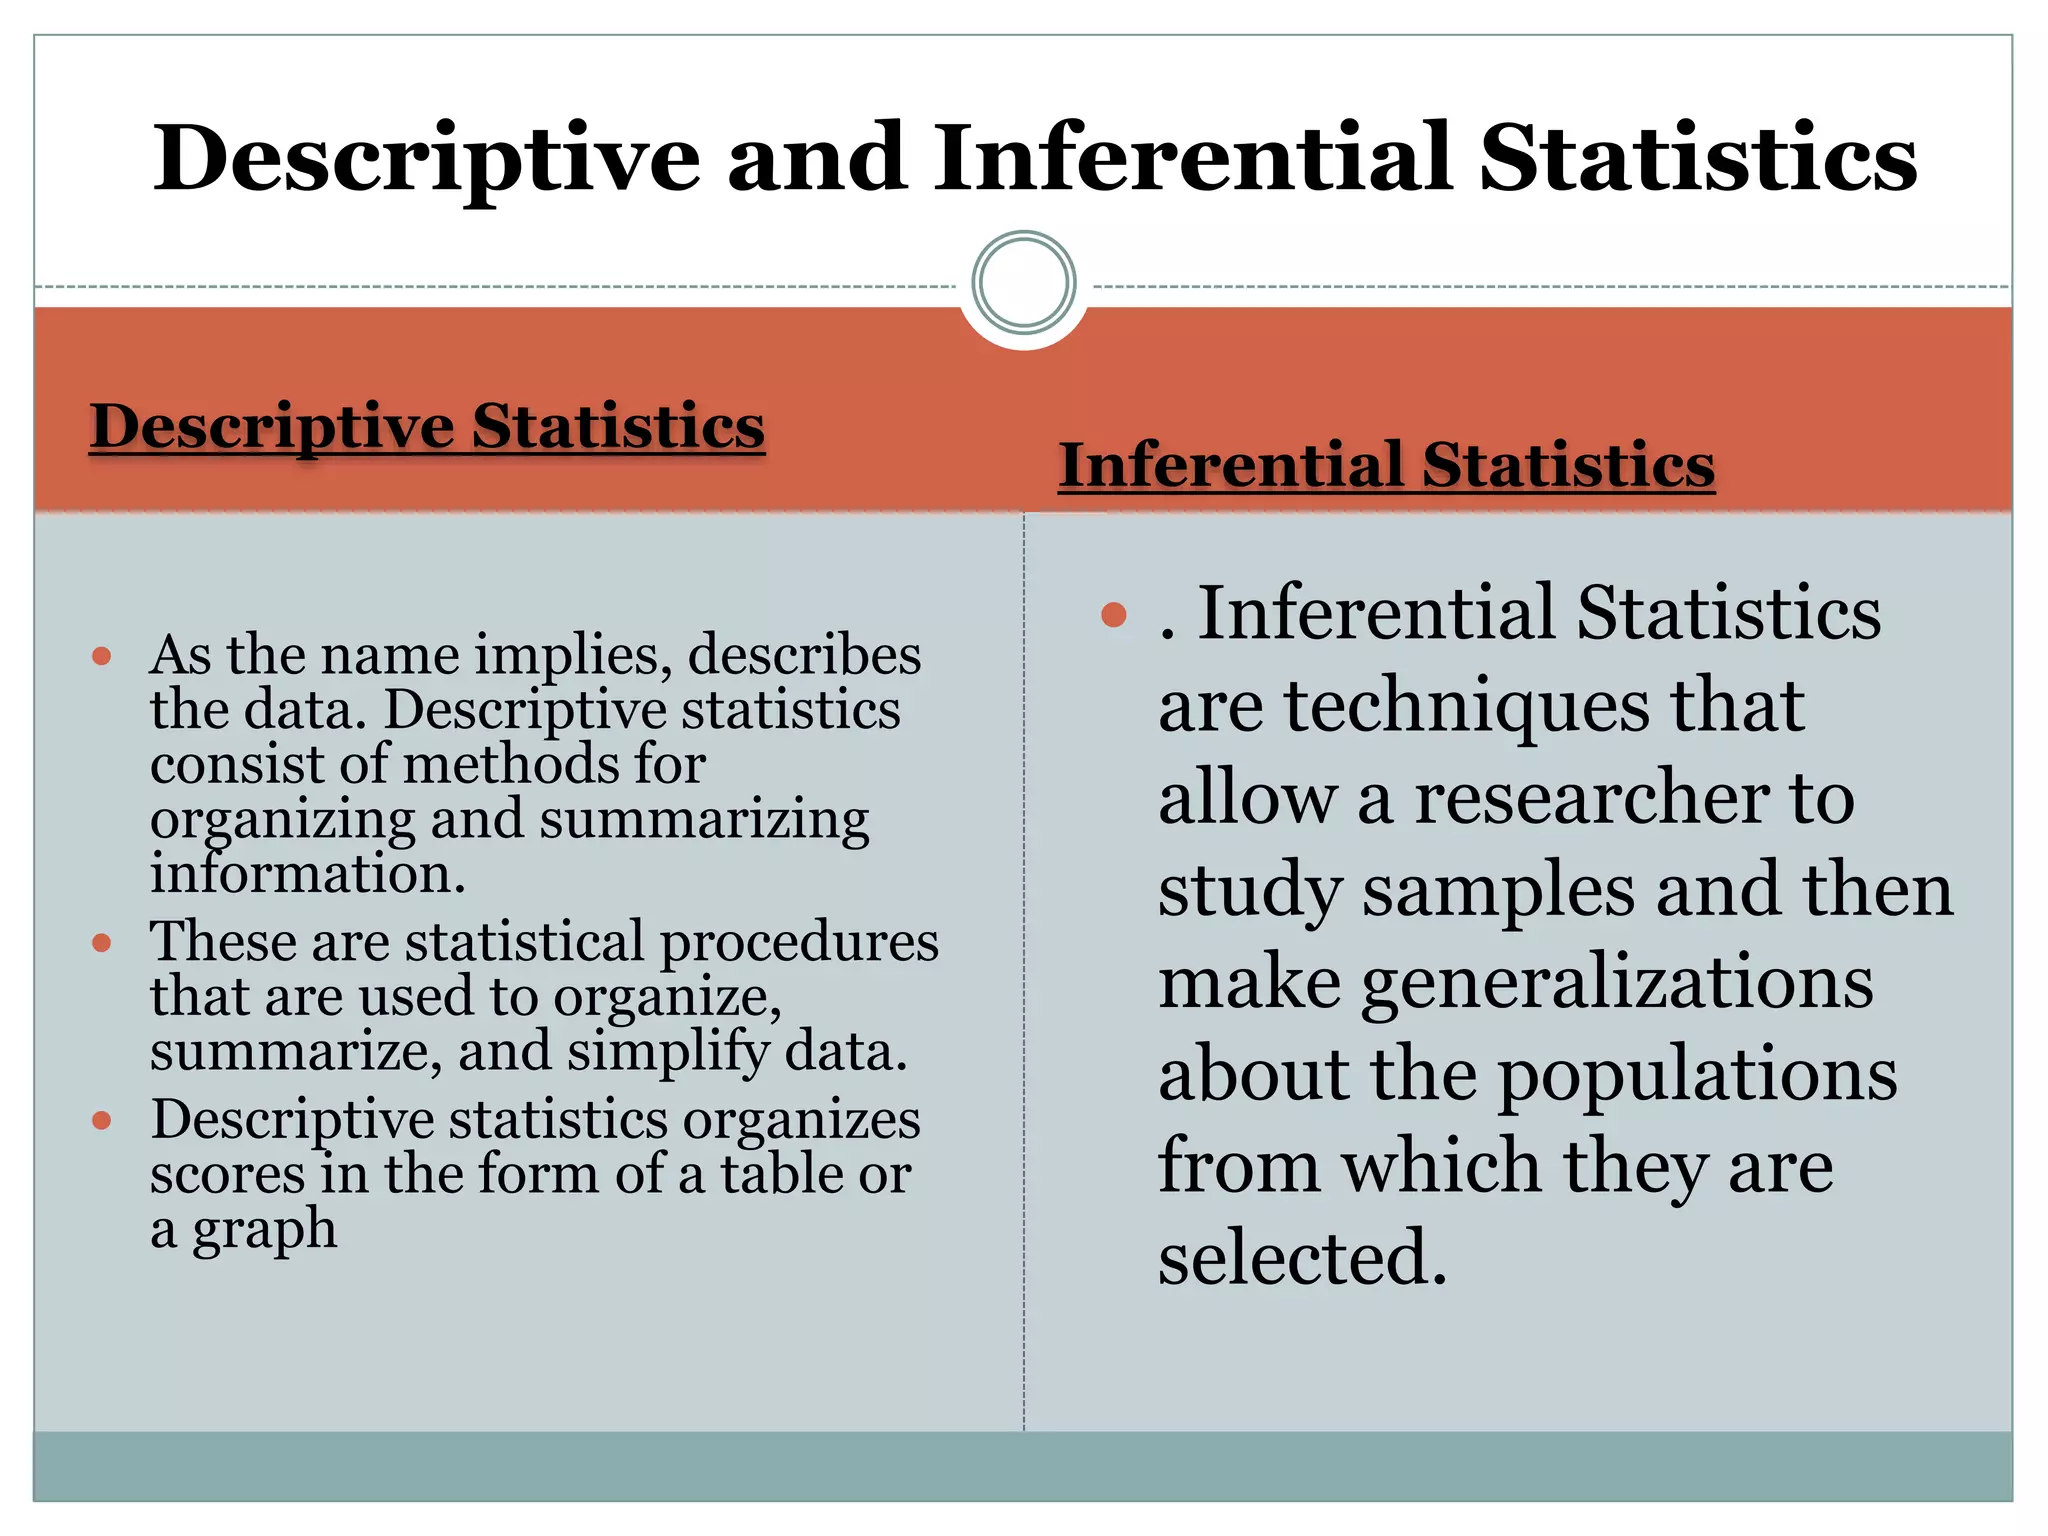
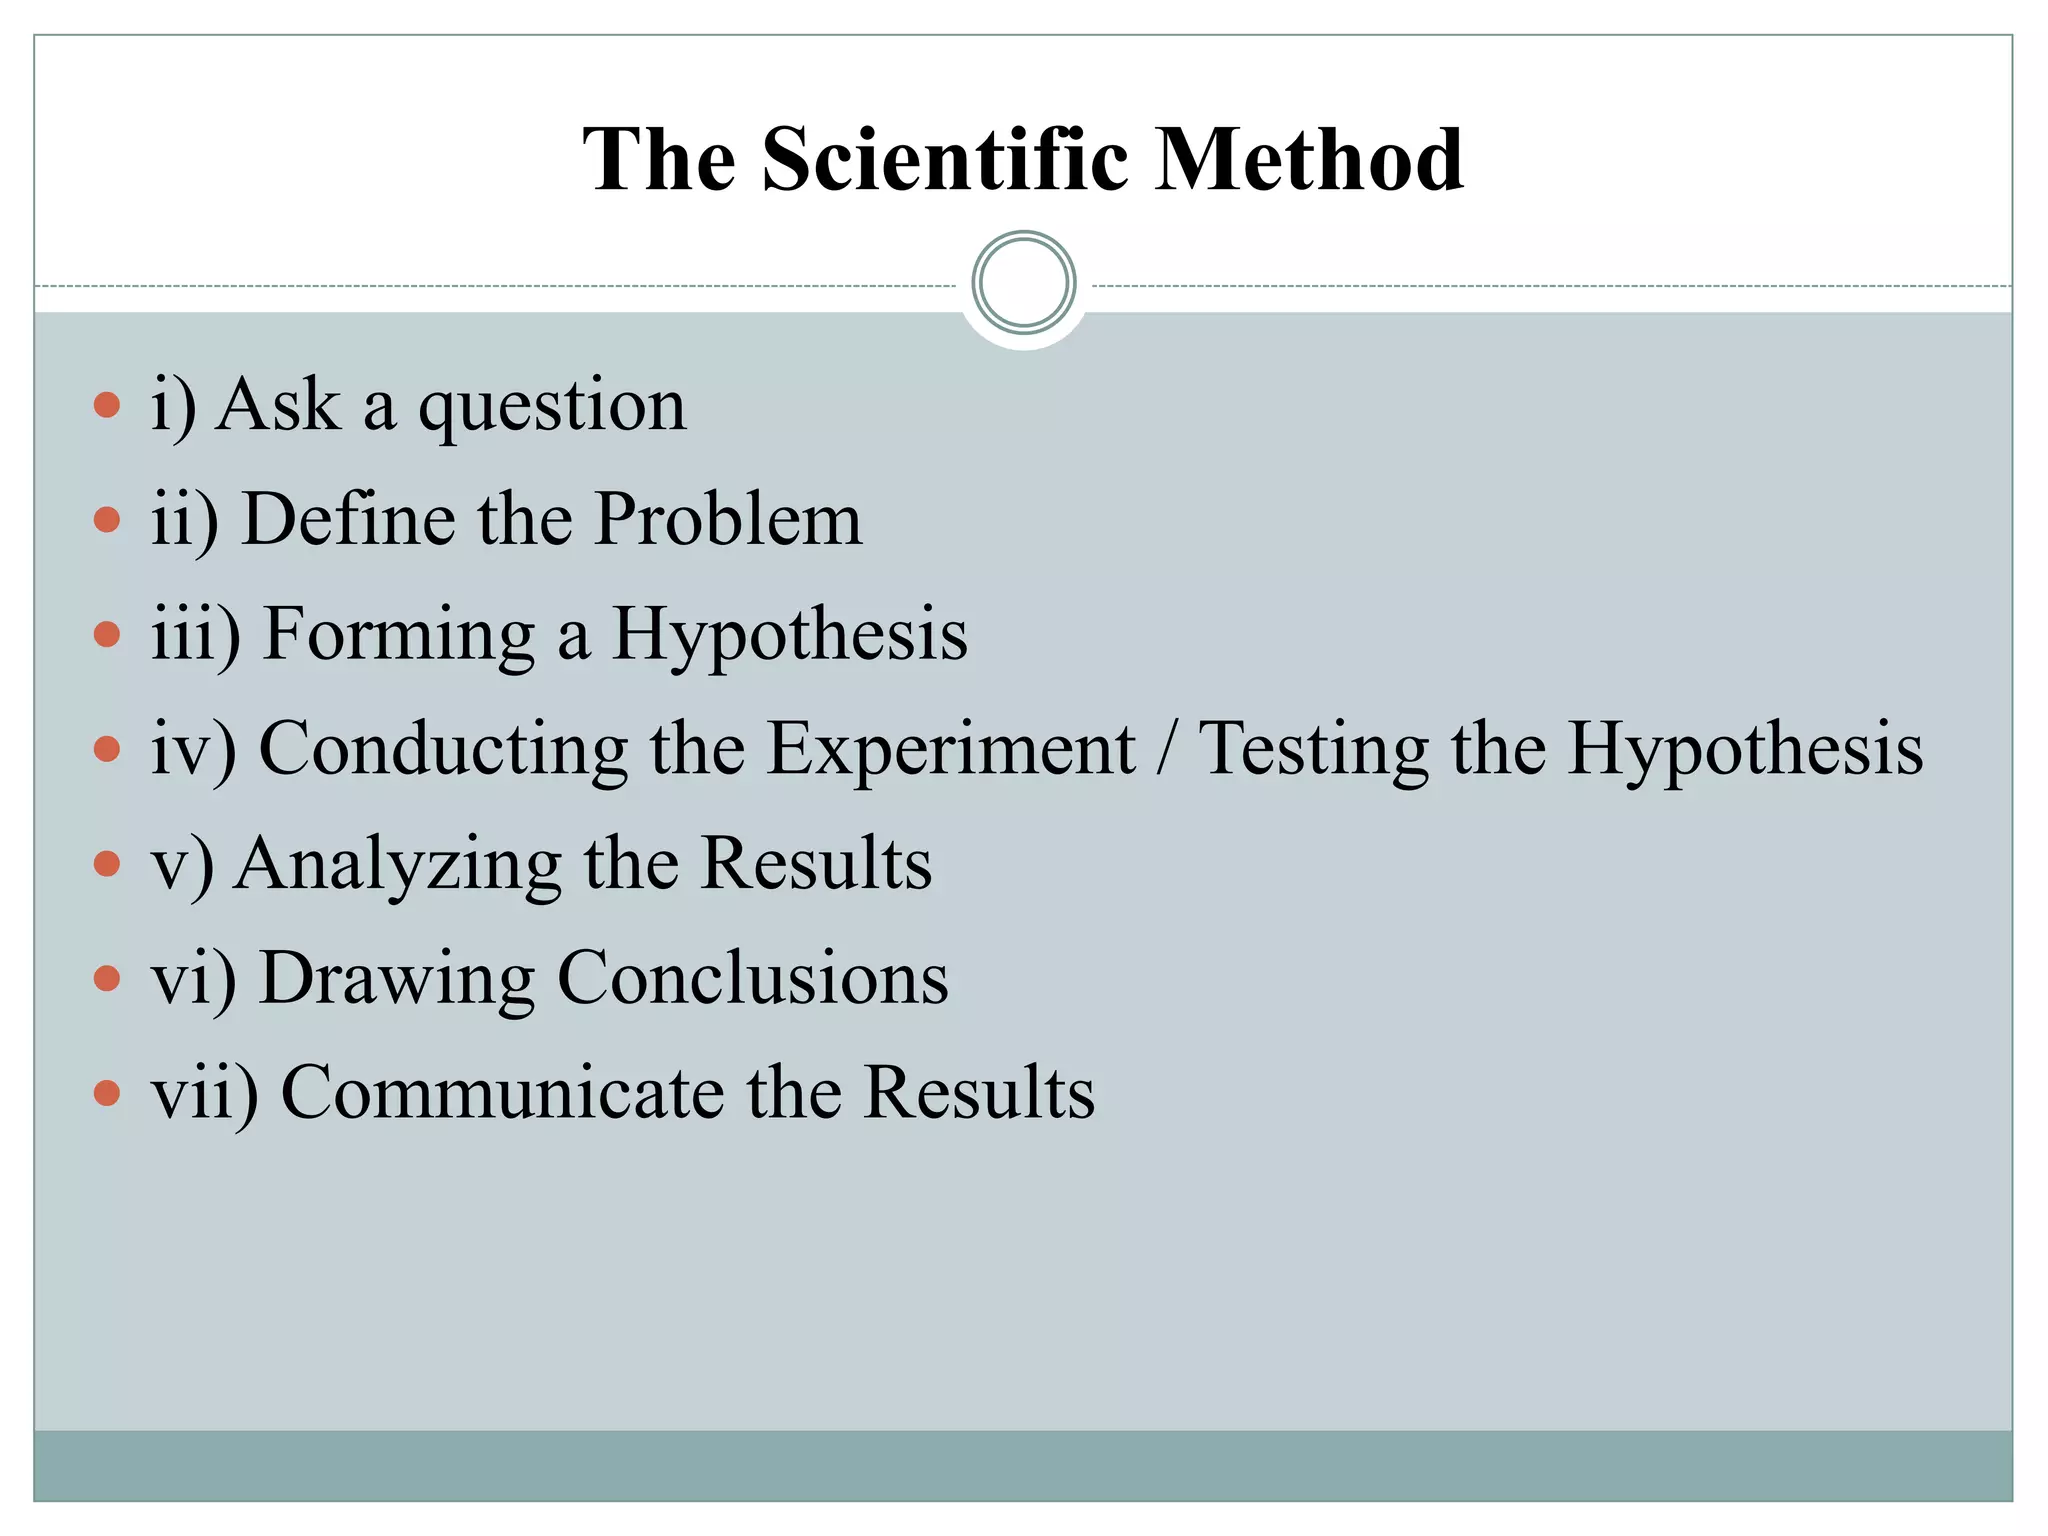
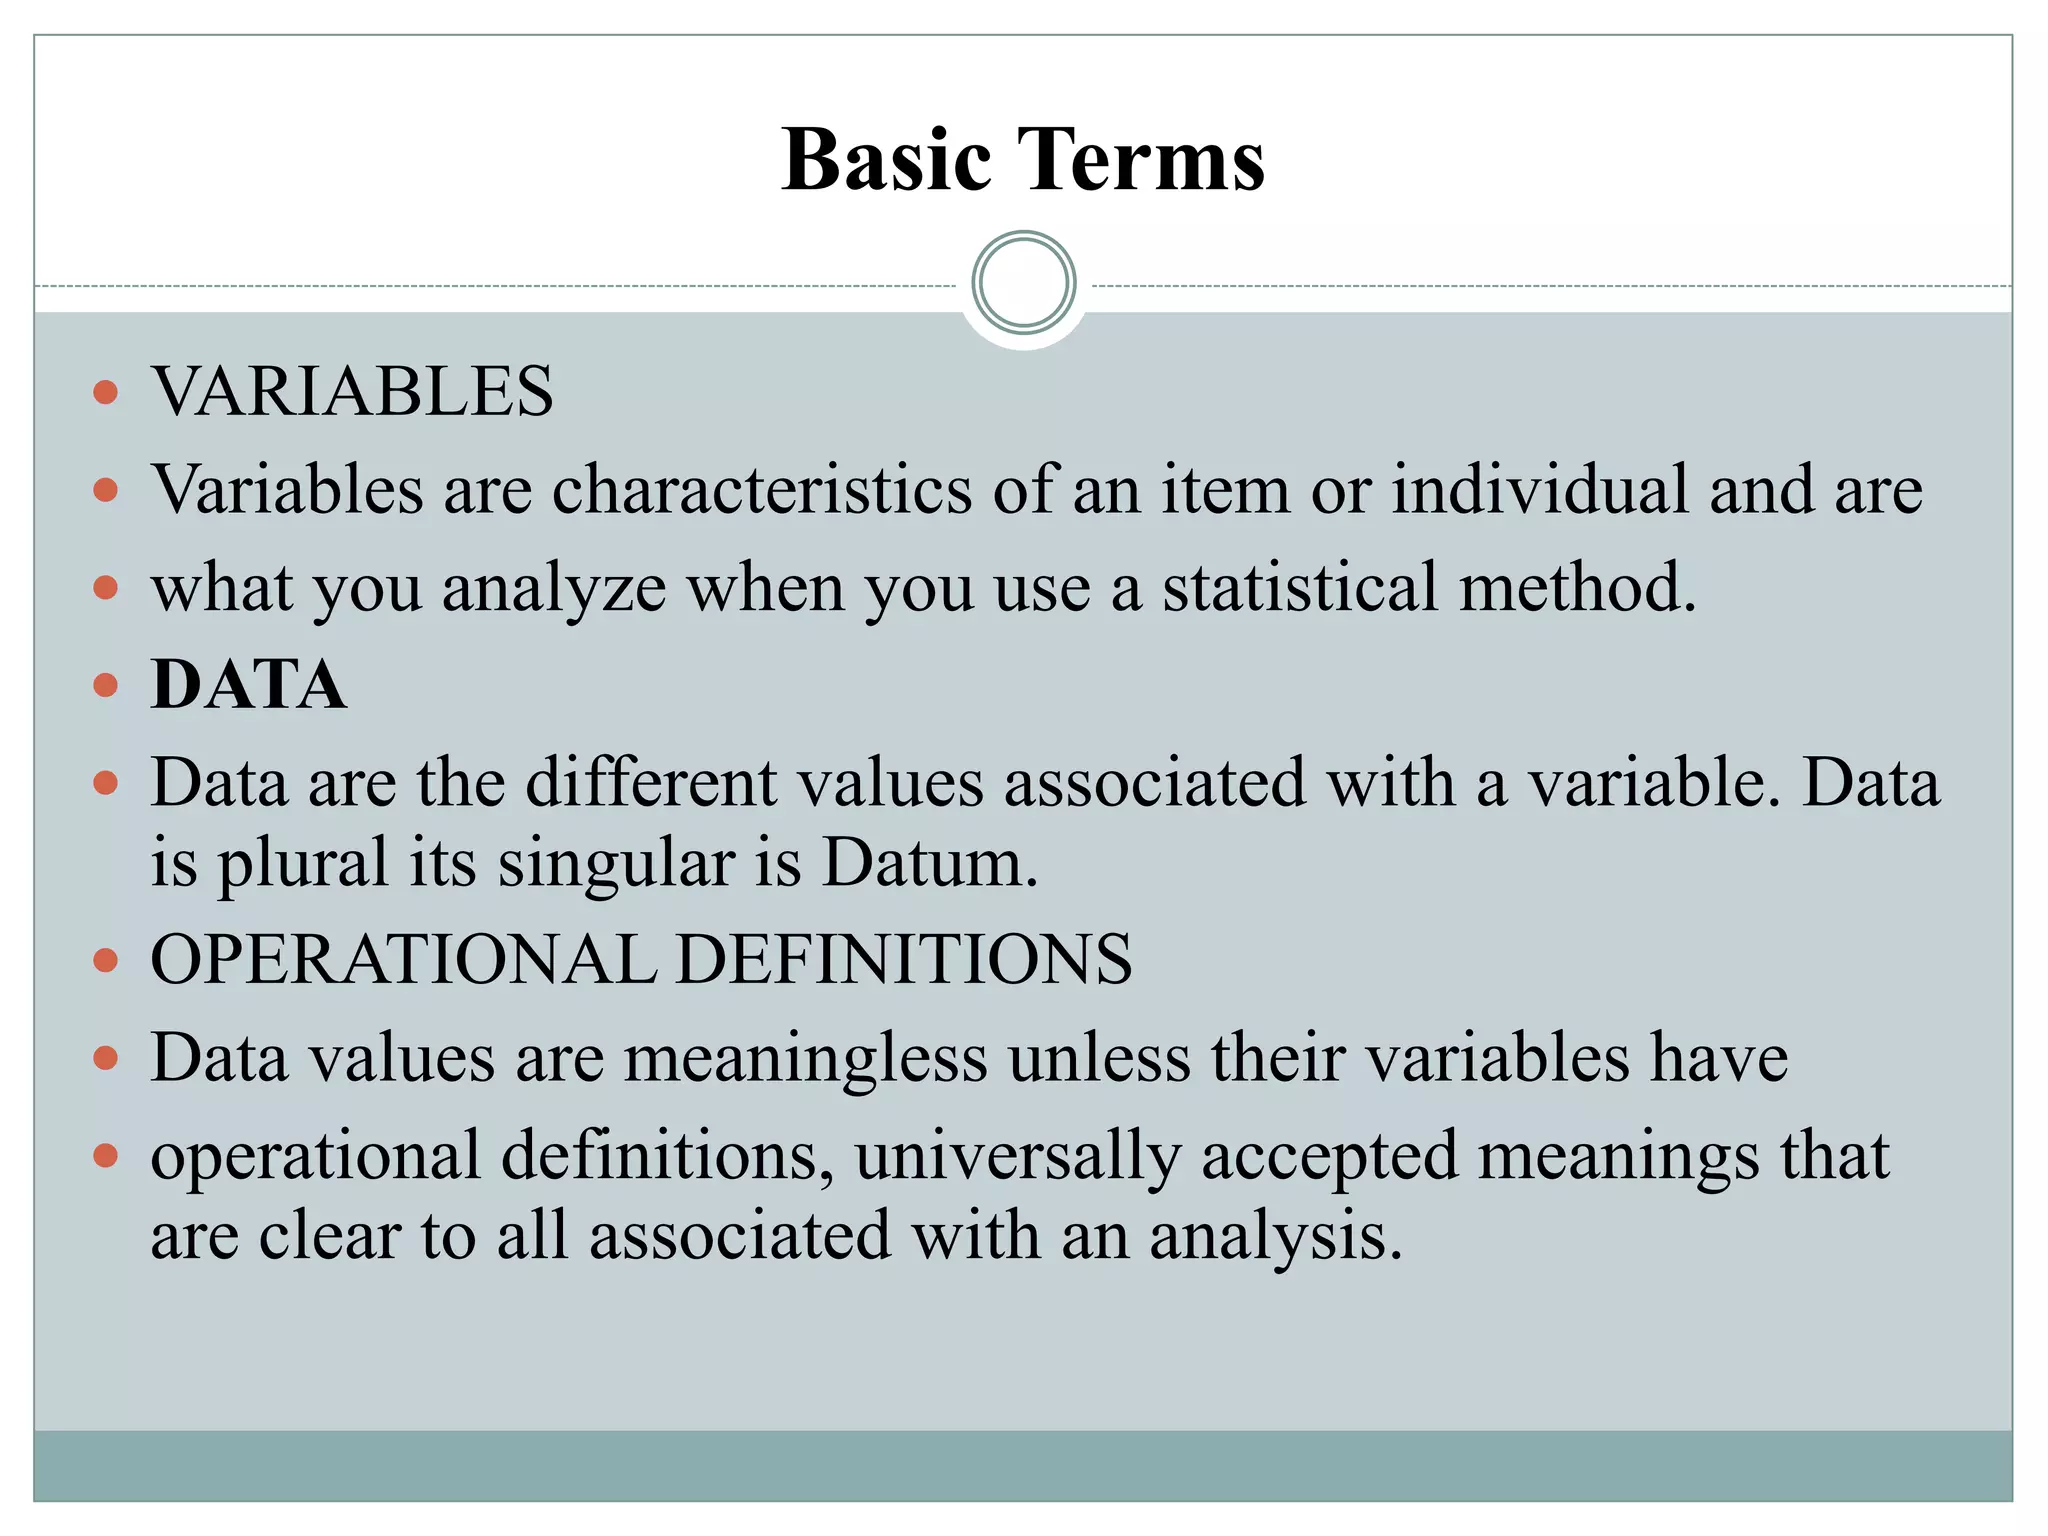
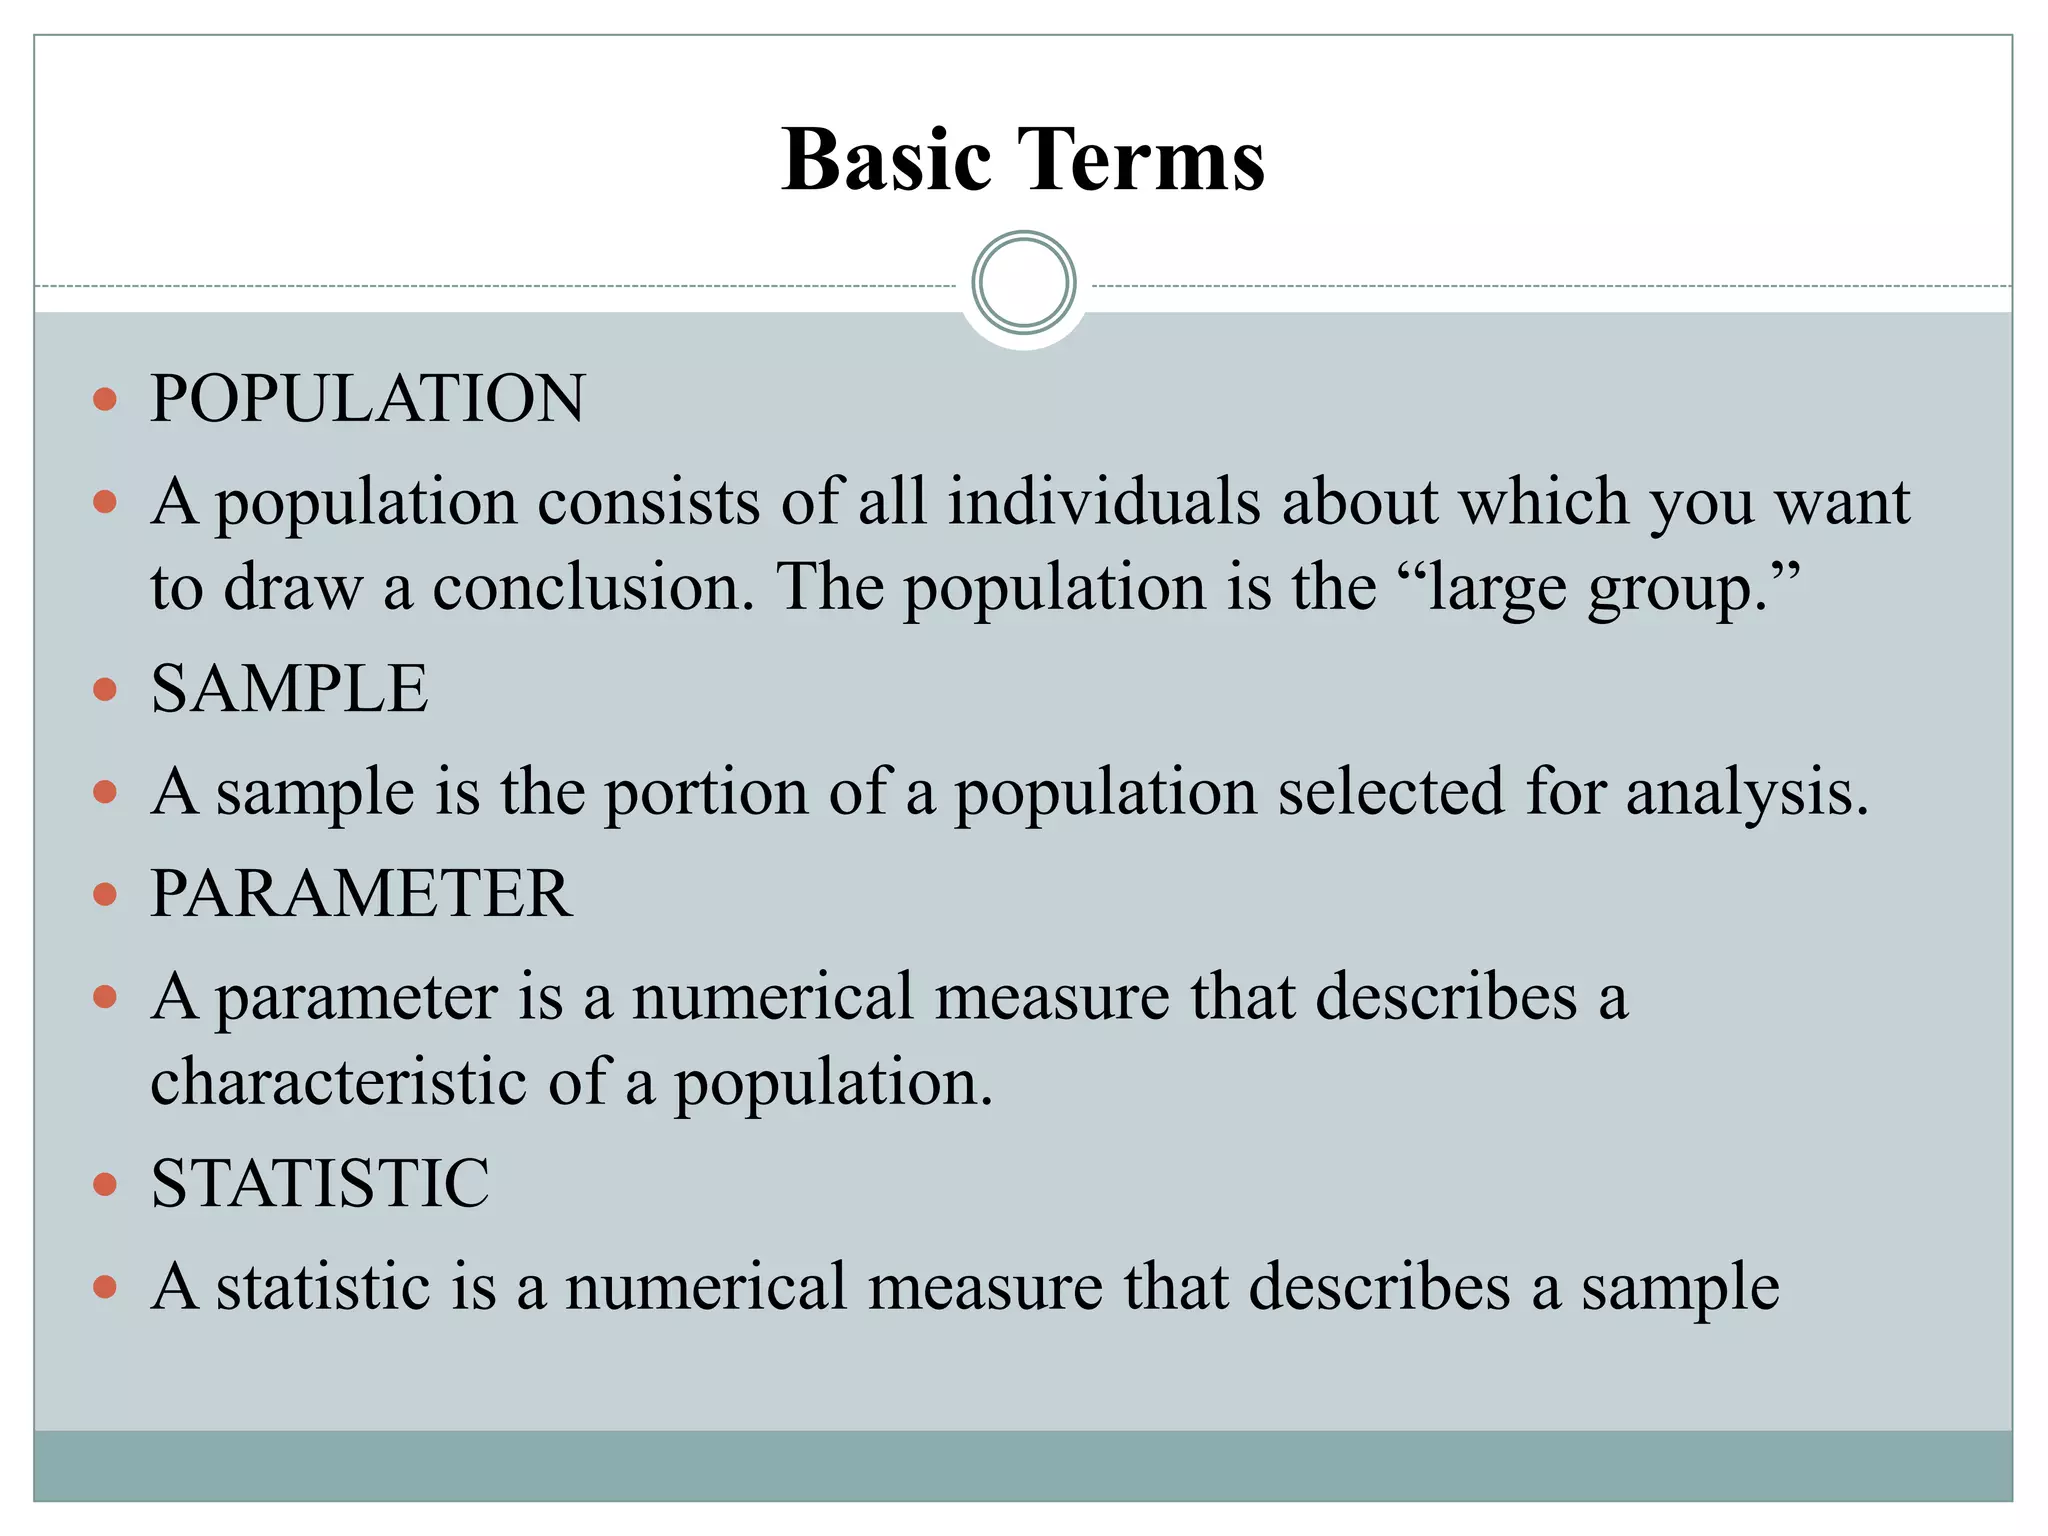
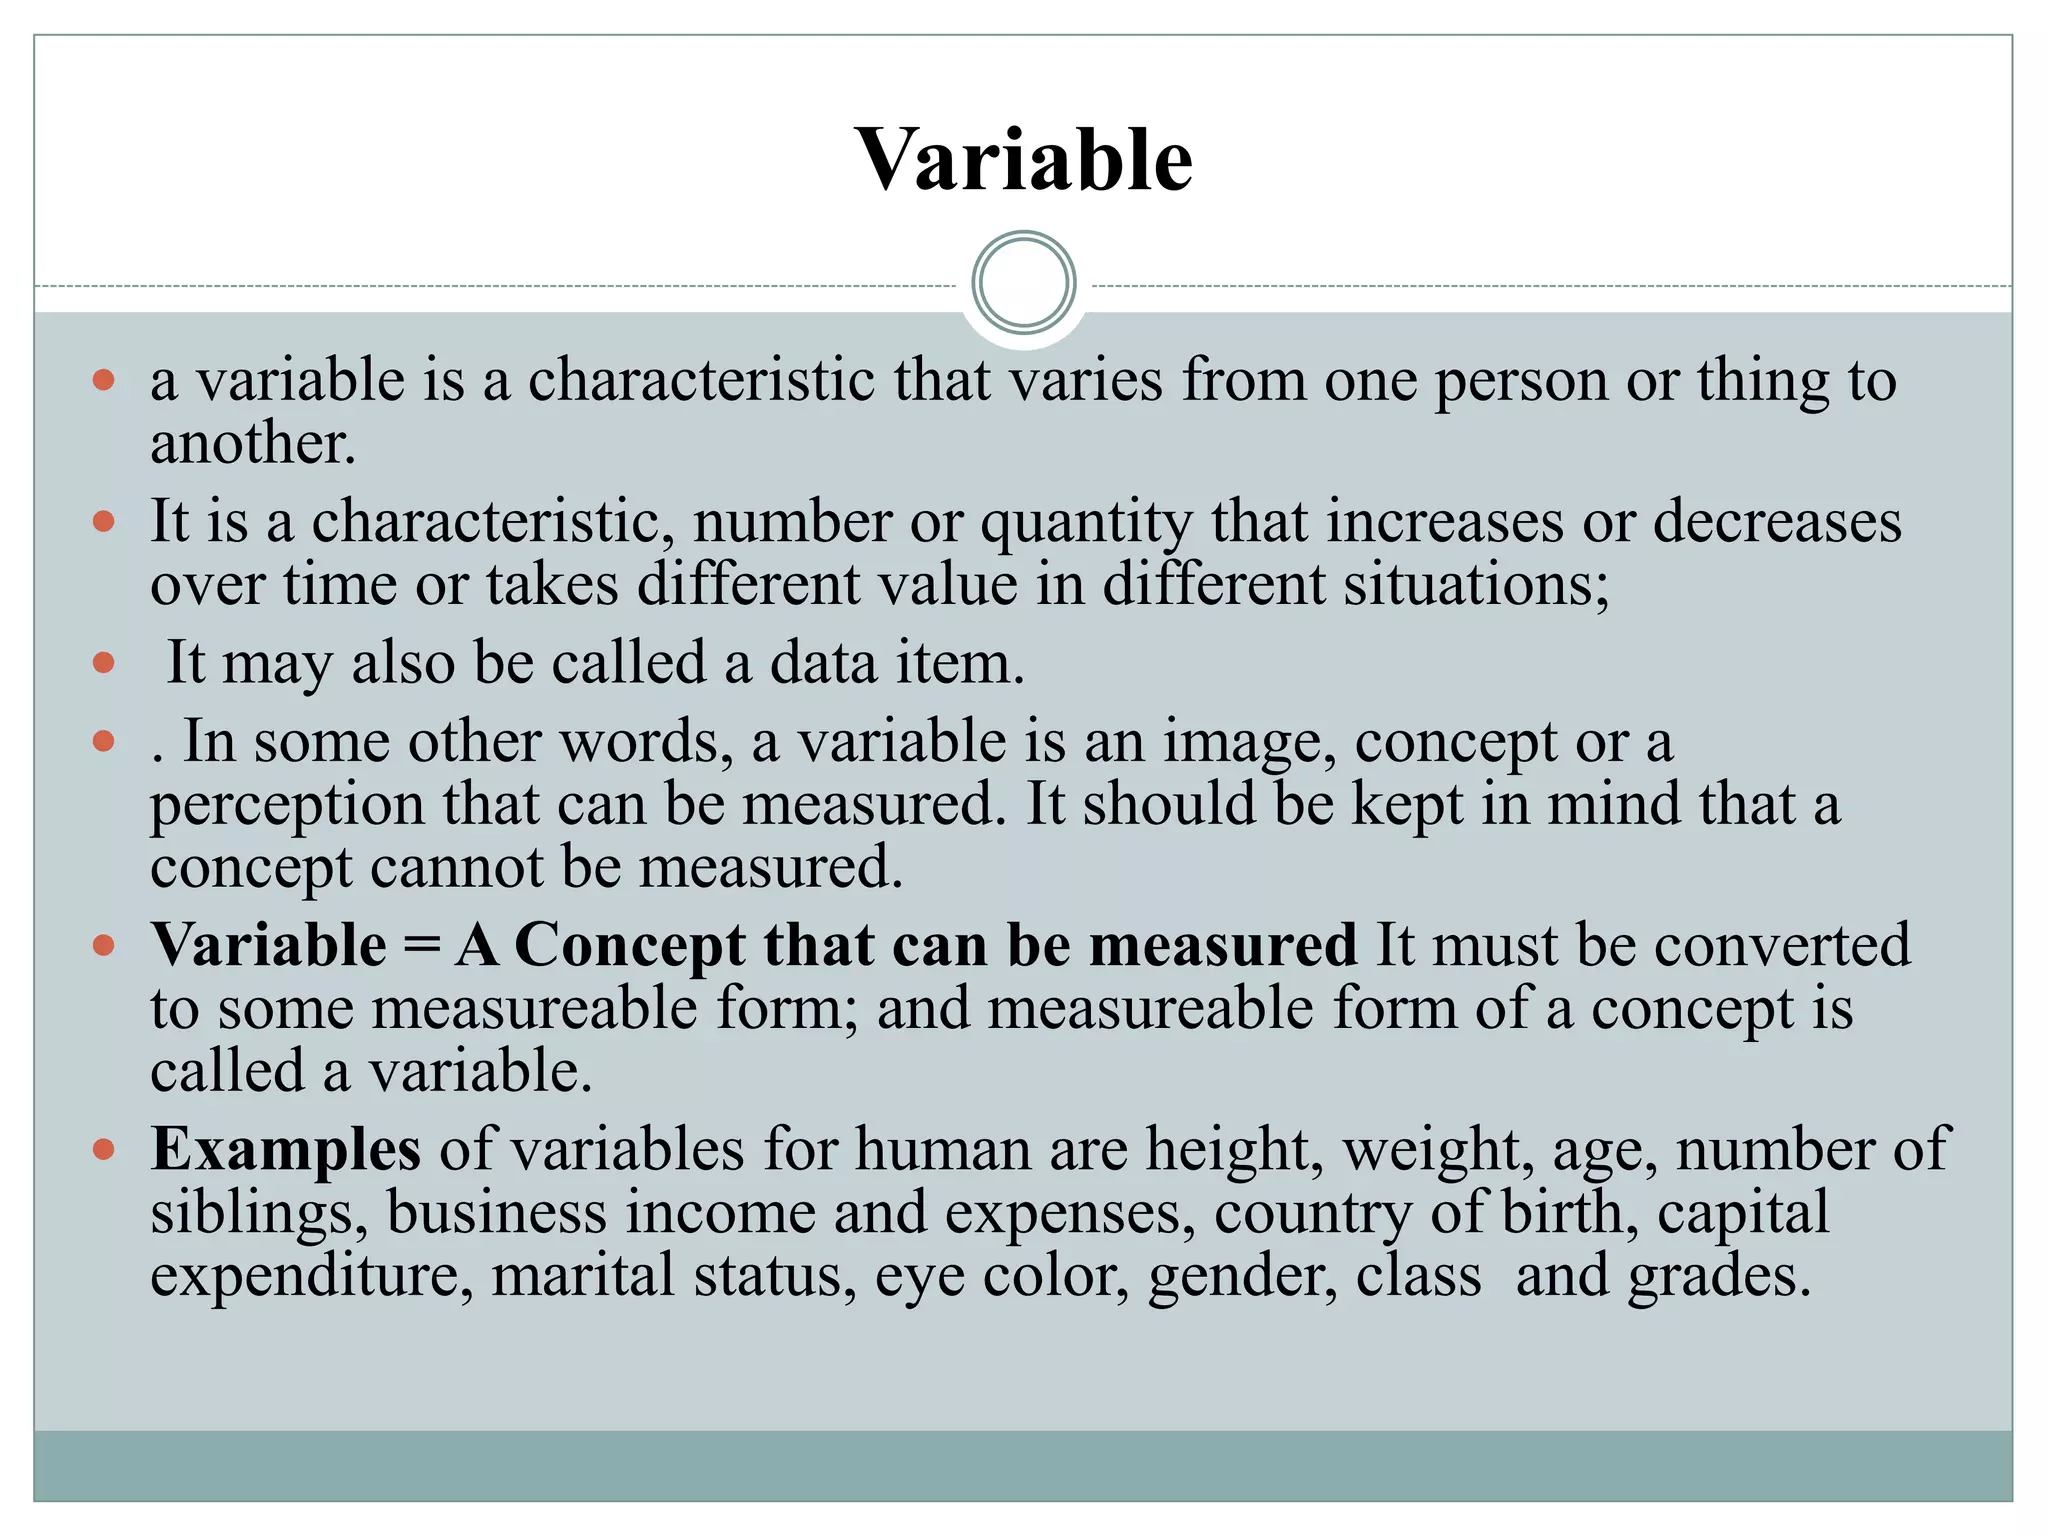
Unit–1: Introduction to Statistics
Unit–2: Basics Statistics Concepts
Course code 8614
 The term statistics refers to a set of methods and rules
for organizing, summarizing, and interpreting
information.
 statistics is a way of gathering information and data.
 Data -> statistics ->information
Stat is a parameter
while
Statistics is a measure that how the work have to be
done.
 Data are everywhere
 Statistical techniques are used to make many decisions
that affect our lives
 No matter what your career, you will make
professional decisions that involve data. An
understanding of statistical methods will help you make
these decisions efectively
 We live in the information world where most information is
determined mathematically with help of statistics.
 It means statistics keeps us informed about daily happening.
 Weather forecasting is possible due to some computer
models based on statistical concepts to predict weather.
 Researchers use statistical techniques to collect relevant
data.
 Statistics is frequently used by the researchers. They use
sstatistical techniques to collect relevant data.
 Statistical techniques are key of how traders and
businessmen invest and make money.
 Industry tools are used in quality testing by product
managers.
 Statistics play a big role in medical field. Before any
drugs prescribed, pharmacists show statistically valid
rate of effectiveness.
 Similarly, statistics is behind all other medical studies.
Doctors predict diseases on the bases of statistical
concepts
Functions of Statistics
 To present facts in a definite form
 To simplify unmanageable and complex data
 To use techniques for making comparisons
 To enlarge individual experience
 To provide guidance in the formulation of policies
 To enable measurement of the magnitude of a
phenomenon.
Limitations of Statistics
1. The use of statistics is limited to numerical studies.
2. Statistical results might lead to fallacious conclusions.
3. Statistics relies on estimation and approximations.
4. Statistical techniques deal with population or aggregate
of individuals rather than with individuals.
Application of Statistics in Educational
Research
 Statistics enters in the process right from the
beginning of the research when whole plan
for the research, selection of design,
population, sample, analysis tools and
techniques etc., is prepared.
Descriptive Statistics
Inferential Statistics
 As the name implies, describes
the data. Descriptive statistics
consist of methods for
organizing and summarizing
information.
 These are statistical procedures
that are used to organize,
summarize, and simplify data.
 Descriptive statistics organizes
scores in the form of a table or
a graph
 . Inferential Statistics
are techniques that
allow a researcher to
study samples and then
make generalizations
about the populations
from which they are
selected.
Descriptive and Inferential Statistics
 “It is the parameter, characteristics or attribute which is
usually recorded in an experiment.”
 For example, variable is gender and attributes may be male
and female.
 The variables that yield numerical
information/measurement are called quantitative
 or
 numerical variable and the variable that yield non-
numerical information or measurement
 are called qualitative or categorical variable
 There are two basic types of variables –
quantitative and categorical.
 Each uses different type of analysis and
measurement.
 There are four types of measurement scales:
nominal, ordinal, interval, and ratio.
 A scale of a variable gives certain structure to
the variable and also defines the meaning of
the variable.
Types of measurement scales
Nominal Measurement
is the values “name” the attribute uniquely.
Ordinal Measurement
Ordinal level variables are nominal level variables with a
meaningful order.
True differences are not possible just order possible
Types of measurement scales
Measurement Scales
 Nominal – categories
 Gender, ethnicity, etc.
 Ordinal – ordered categories
 Rank in class, order of finish, etc.
 Interval – equal intervals
 Test scores, attitude scores, etc.
 Ratio – absolute zero
 Time, height, weight, etc.
The Scientific Method
 Scientific method is a tool for:
 (a) forming and framing questions,
 (b) collecting information to answer those questions,
and
 (c) revising old and developing new questions.
The Scientific Method
 Scientific method is a process for explaining the world
to validate observations while minimizing observer
bias.
 It has many steps to describe the things we observe.
 Its goal is to conduct research in a fair, unbiased and
repeatable manner.
 Scientific method is a tool for:
 (a) forming and framing questions,
 (b) collecting information to answer those questions, and
 (c) revising old and developing new
The Scientific Method
 i) Ask a question
 ii) Define the Problem
 iii) Forming a Hypothesis
 iv) Conducting the Experiment / Testing the Hypothesis
 v) Analyzing the Results
 vi) Drawing Conclusions
 vii) Communicate the Results
Basic Terms
 VARIABLES
 Variables are characteristics of an item or individual and are
 what you analyze when you use a statistical method.
 DATA
 Data are the different values associated with a variable. Data
is plural its singular is Datum.
 OPERATIONAL DEFINITIONS
 Data values are meaningless unless their variables have
 operational definitions, universally accepted meanings that
are clear to all associated with an analysis.
Basic Terms
 POPULATION
 A population consists of all individuals about which you want
to draw a conclusion. The population is the “large group.”
 SAMPLE
 A sample is the portion of a population selected for analysis.
 PARAMETER
 A parameter is a numerical measure that describes a
characteristic of a population.
 STATISTIC
 A statistic is a numerical measure that describes a sample
Variable
 a variable is a characteristic that varies from one person or thing to
another.
 It is a characteristic, number or quantity that increases or decreases
over time or takes different value in different situations;
 It may also be called a data item.
 . In some other words, a variable is an image, concept or a
perception that can be measured. It should be kept in mind that a
concept cannot be measured.
 Variable = A Concept that can be measured It must be converted
to some measureable form; and measureable form of a concept is
called a variable.
 Examples of variables for human are height, weight, age, number of
siblings, business income and expenses, country of birth, capital
expenditure, marital status, eye color, gender, class and grades.
Types of Sample
Introduction to Statistics - Basics Statistics Concepts - Day 1- 8614 - B.Ed - AIOU

Introduction to Statistics - Basics Statistics Concepts - Day 1- 8614 - B.Ed - AIOU

  • 1.
    Unit–1: Introduction toStatistics Unit–2: Basics Statistics Concepts Course code 8614
  • 2.
     The termstatistics refers to a set of methods and rules for organizing, summarizing, and interpreting information.  statistics is a way of gathering information and data.  Data -> statistics ->information
  • 4.
    Stat is aparameter while Statistics is a measure that how the work have to be done.
  • 5.
     Data areeverywhere  Statistical techniques are used to make many decisions that affect our lives  No matter what your career, you will make professional decisions that involve data. An understanding of statistical methods will help you make these decisions efectively
  • 6.
     We livein the information world where most information is determined mathematically with help of statistics.  It means statistics keeps us informed about daily happening.  Weather forecasting is possible due to some computer models based on statistical concepts to predict weather.  Researchers use statistical techniques to collect relevant data.  Statistics is frequently used by the researchers. They use sstatistical techniques to collect relevant data.
  • 7.
     Statistical techniquesare key of how traders and businessmen invest and make money.  Industry tools are used in quality testing by product managers.  Statistics play a big role in medical field. Before any drugs prescribed, pharmacists show statistically valid rate of effectiveness.  Similarly, statistics is behind all other medical studies. Doctors predict diseases on the bases of statistical concepts
  • 8.
    Functions of Statistics To present facts in a definite form  To simplify unmanageable and complex data  To use techniques for making comparisons  To enlarge individual experience  To provide guidance in the formulation of policies  To enable measurement of the magnitude of a phenomenon.
  • 9.
    Limitations of Statistics 1.The use of statistics is limited to numerical studies. 2. Statistical results might lead to fallacious conclusions. 3. Statistics relies on estimation and approximations. 4. Statistical techniques deal with population or aggregate of individuals rather than with individuals.
  • 10.
    Application of Statisticsin Educational Research  Statistics enters in the process right from the beginning of the research when whole plan for the research, selection of design, population, sample, analysis tools and techniques etc., is prepared.
  • 11.
    Descriptive Statistics Inferential Statistics As the name implies, describes the data. Descriptive statistics consist of methods for organizing and summarizing information.  These are statistical procedures that are used to organize, summarize, and simplify data.  Descriptive statistics organizes scores in the form of a table or a graph  . Inferential Statistics are techniques that allow a researcher to study samples and then make generalizations about the populations from which they are selected. Descriptive and Inferential Statistics
  • 12.
     “It isthe parameter, characteristics or attribute which is usually recorded in an experiment.”  For example, variable is gender and attributes may be male and female.  The variables that yield numerical information/measurement are called quantitative  or  numerical variable and the variable that yield non- numerical information or measurement  are called qualitative or categorical variable
  • 13.
     There aretwo basic types of variables – quantitative and categorical.  Each uses different type of analysis and measurement.  There are four types of measurement scales: nominal, ordinal, interval, and ratio.  A scale of a variable gives certain structure to the variable and also defines the meaning of the variable.
  • 15.
    Types of measurementscales Nominal Measurement is the values “name” the attribute uniquely. Ordinal Measurement Ordinal level variables are nominal level variables with a meaningful order. True differences are not possible just order possible
  • 16.
  • 17.
    Measurement Scales  Nominal– categories  Gender, ethnicity, etc.  Ordinal – ordered categories  Rank in class, order of finish, etc.  Interval – equal intervals  Test scores, attitude scores, etc.  Ratio – absolute zero  Time, height, weight, etc.
  • 18.
    The Scientific Method Scientific method is a tool for:  (a) forming and framing questions,  (b) collecting information to answer those questions, and  (c) revising old and developing new questions.
  • 19.
    The Scientific Method Scientific method is a process for explaining the world to validate observations while minimizing observer bias.  It has many steps to describe the things we observe.  Its goal is to conduct research in a fair, unbiased and repeatable manner.  Scientific method is a tool for:  (a) forming and framing questions,  (b) collecting information to answer those questions, and  (c) revising old and developing new
  • 20.
    The Scientific Method i) Ask a question  ii) Define the Problem  iii) Forming a Hypothesis  iv) Conducting the Experiment / Testing the Hypothesis  v) Analyzing the Results  vi) Drawing Conclusions  vii) Communicate the Results
  • 21.
    Basic Terms  VARIABLES Variables are characteristics of an item or individual and are  what you analyze when you use a statistical method.  DATA  Data are the different values associated with a variable. Data is plural its singular is Datum.  OPERATIONAL DEFINITIONS  Data values are meaningless unless their variables have  operational definitions, universally accepted meanings that are clear to all associated with an analysis.
  • 22.
    Basic Terms  POPULATION A population consists of all individuals about which you want to draw a conclusion. The population is the “large group.”  SAMPLE  A sample is the portion of a population selected for analysis.  PARAMETER  A parameter is a numerical measure that describes a characteristic of a population.  STATISTIC  A statistic is a numerical measure that describes a sample
  • 23.
    Variable  a variableis a characteristic that varies from one person or thing to another.  It is a characteristic, number or quantity that increases or decreases over time or takes different value in different situations;  It may also be called a data item.  . In some other words, a variable is an image, concept or a perception that can be measured. It should be kept in mind that a concept cannot be measured.  Variable = A Concept that can be measured It must be converted to some measureable form; and measureable form of a concept is called a variable.  Examples of variables for human are height, weight, age, number of siblings, business income and expenses, country of birth, capital expenditure, marital status, eye color, gender, class and grades.
  • 24.