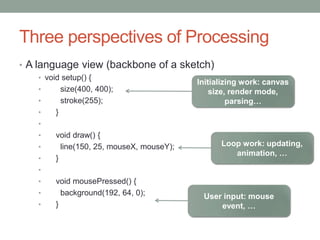
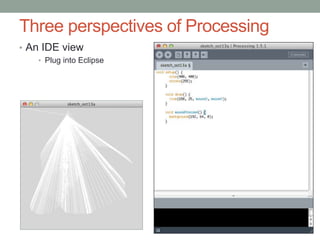
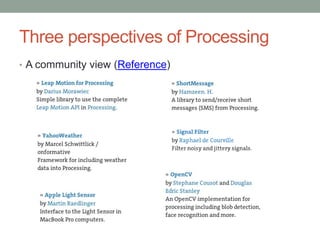
INTRODUCTION TO PROCESSING
A data visualization tool

BY: Tian LAN
The University of Hong Kong
2013-10-10
OUTLINE
• WHY
• WHAT
• HOW
• CONCLUSION.
Why Processing?
Why processing?
• Data-driven research
• Visualizing -> Data mining;
• Sensible City Lab @ MIT (Personally).
• Case: Live Singapore!
• Real time data: Phone calls and text message activities; bus transit

data; taxi trajectories; weather condition; airlines and shipment flows.
• Put city and people under lens of data
Video demo
What is Processing?
Three perspectives of Processing
• A language view
• An IDE view
• A community view
Three perspectives of Processing
• A language view
• O-O, Java “family”.
• Data type: primitive, composite
• Input: mouse and keyboard events, file.
• tablets and devices (Leap Motion, Kinect…)

• Graphics and renders: 2D/3D, shape, shaders, camera, light…

• Math
• …

• Reference
Three perspectives of Processing
• A language view (backbone of a sketch)
• void setup() {
•

size(400, 400);
stroke(255);

•
•

Initializing work: canvas
size, render mode,
parsing…

}

•

•
•
•

void draw() {
line(150, 25, mouseX, mouseY);
}

Loop work: updating,
animation, …

•
•

•
•

void mousePressed() {
background(192, 64, 0);
}

User input: mouse
event, …
Three perspectives of Processing
• An IDE view
• Plug into Eclipse
Three perspectives of Processing
• A community view (Reference)
Three perspectives of Processing
• A community view (None of our business?)
• Unfolding map library
• Geo-visualization;
• More user interaction: multi-touch gestures;
• Multi-map providers, tile-based map.
• For Processing 1.5 only.
• Shape file; GeoJASON file.
Three perspectives of Processing
• A community view (None of our business?)
• Unfolding map + TileMill
How to use Processing?
“Hello world”
Other selected solutions of visualizing data
A little bit thought

Technology or Art?
Image courtesy of Data Visualization Laboratory
Data sources
• NASA data center
• MARSA: Geolife
• HK Government: data.one
• Data Tang (数据堂)
• Stanford Network Dataset Collection

• Social media (Twitter API, micro blog API, …)
Liqui Data

Video demo
Recommended online resources:
• http://datavlab.org (Not accessible on Oct. 16)

• http://www.civn.cn (Currently not available; server down)
• Onformative studio
• http://www.visualisingdata.com/index.php/resources/
• 视物致知
Introduction to Processing

Introduction to Processing

  • 1.
    INTRODUCTION TO PROCESSING Adata visualization tool BY: Tian LAN The University of Hong Kong 2013-10-10
  • 2.
    OUTLINE • WHY • WHAT •HOW • CONCLUSION.
  • 3.
  • 4.
    Why processing? • Data-drivenresearch • Visualizing -> Data mining; • Sensible City Lab @ MIT (Personally). • Case: Live Singapore! • Real time data: Phone calls and text message activities; bus transit data; taxi trajectories; weather condition; airlines and shipment flows. • Put city and people under lens of data
  • 5.
  • 6.
  • 7.
    Three perspectives ofProcessing • A language view • An IDE view • A community view
  • 8.
    Three perspectives ofProcessing • A language view • O-O, Java “family”. • Data type: primitive, composite • Input: mouse and keyboard events, file. • tablets and devices (Leap Motion, Kinect…) • Graphics and renders: 2D/3D, shape, shaders, camera, light… • Math • … • Reference
  • 9.
    Three perspectives ofProcessing • A language view (backbone of a sketch) • void setup() { • size(400, 400); stroke(255); • • Initializing work: canvas size, render mode, parsing… } • • • • void draw() { line(150, 25, mouseX, mouseY); } Loop work: updating, animation, … • • • • void mousePressed() { background(192, 64, 0); } User input: mouse event, …
  • 10.
    Three perspectives ofProcessing • An IDE view • Plug into Eclipse
  • 11.
    Three perspectives ofProcessing • A community view (Reference)
  • 12.
    Three perspectives ofProcessing • A community view (None of our business?) • Unfolding map library • Geo-visualization; • More user interaction: multi-touch gestures; • Multi-map providers, tile-based map. • For Processing 1.5 only. • Shape file; GeoJASON file.
  • 13.
    Three perspectives ofProcessing • A community view (None of our business?) • Unfolding map + TileMill
  • 14.
    How to useProcessing? “Hello world”
  • 15.
    Other selected solutionsof visualizing data
  • 16.
    A little bitthought Technology or Art?
  • 17.
    Image courtesy ofData Visualization Laboratory
  • 18.
    Data sources • NASAdata center • MARSA: Geolife • HK Government: data.one • Data Tang (数据堂) • Stanford Network Dataset Collection • Social media (Twitter API, micro blog API, …)
  • 19.
  • 20.
    Recommended online resources: •http://datavlab.org (Not accessible on Oct. 16) • http://www.civn.cn (Currently not available; server down) • Onformative studio • http://www.visualisingdata.com/index.php/resources/ • 视物致知