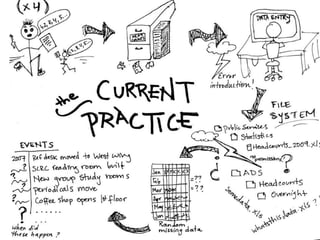
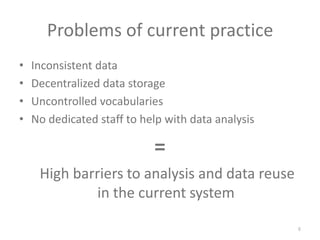
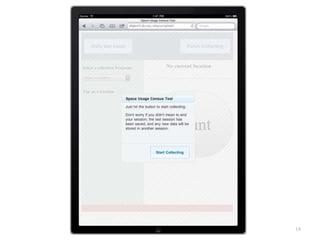
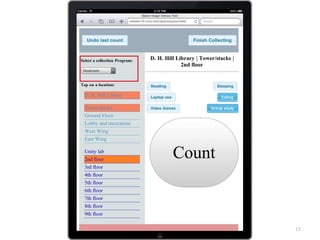
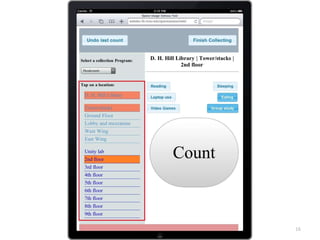
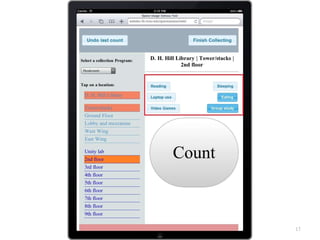
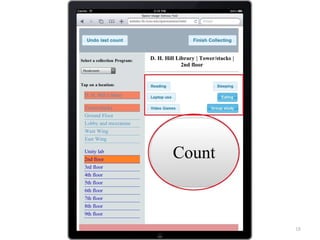
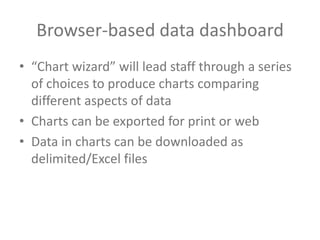
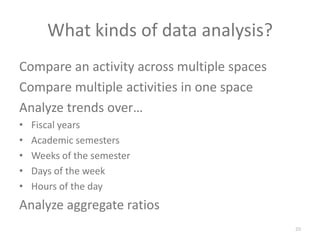
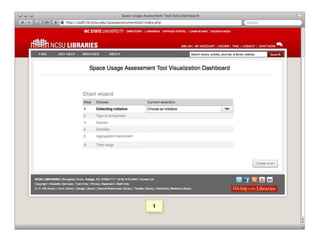
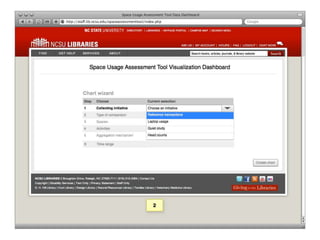
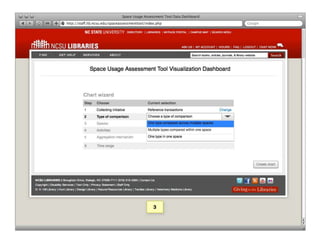
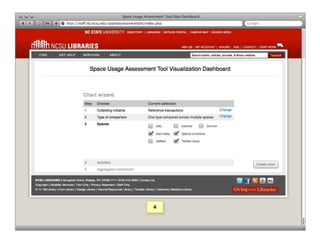
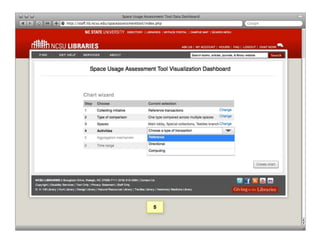
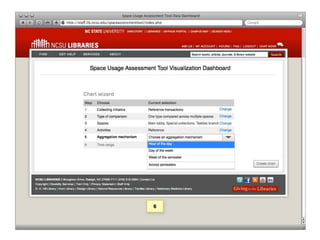
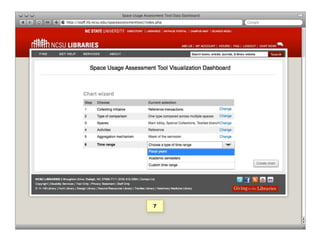
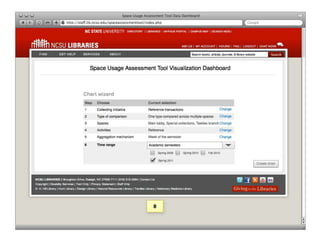
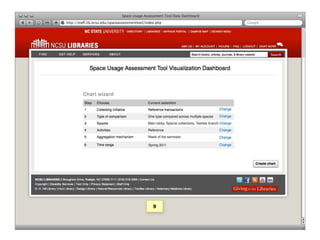
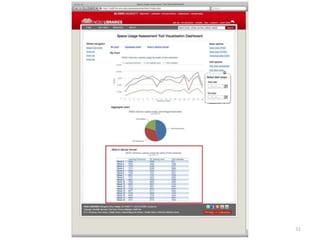
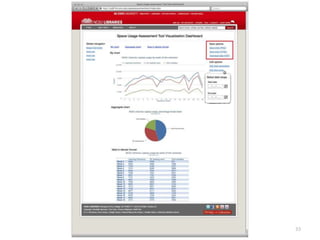
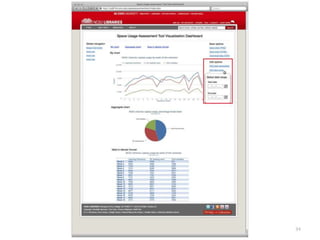
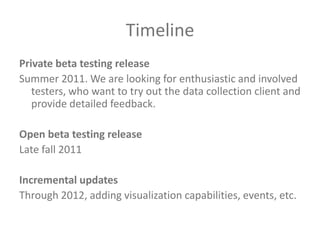
Introducing Suma:An open source, staff-facing tablet application for library assessmentJoyce ChapmanNorth Carolina State University LibrariesALA, Assessment ForumJune 24, 20111
Problem statementWe are always trying track more data about how patrons are using our spaces and services in order to better understand our users and in turn, to better serve their needs. 2
Why do we care?With data about use/activity patterns in different library spaces we canImprove staffing modelsMake informed purchasing decisions Optimize space for patron needs (quiet study, collaborative areas)Take an evidence-based approach to planning future services and spaces3
Where it gets trickyMany libraries perform manual counts of patron activities (headcounts, group study, laptop use) for assessment purposesThe process involves tedious collection mechanisms, lots of paperwork, and much room for errorThere is no coordinated effort to help departments analyze their data4
Our solutionAn open source tablet and web-based application to aid library staff in gathering, storing, exporting, analyzing, and visualizing data about patron activities across spaces/activities/time and around events5
Example use case6
Add image of the current practice
Problems of current practiceInconsistent dataDecentralized data storage Uncontrolled vocabulariesNo dedicated staff to help with data analysis=    High barriers to analysis and data reuse in the current system8
SumaA pocket data analyst for every librarian
Tablet-based data collection tool10
What is the system?11
Count via “thumb thump”12
Data collection tool demo13
14
15
16
17
18
Browser-based data dashboard“Chart wizard” will lead staff through a series of choices to produce charts comparing different aspects of dataCharts can be exported for print or webData in charts can be downloaded as delimited/Excel files
What kinds of data analysis?Compare an activity across multiple spacesCompare multiple activities in one spaceAnalyze trends over…Fiscal yearsAcademic semestersWeeks of the semesterDays of the weekHours of the dayAnalyze aggregate ratios20
30
31
32
33
34
TimelinePrivate beta testing releaseSummer 2011. We are looking for enthusiastic and involved testers, who want to try out the data collection client and provide detailed feedback.Open beta testing releaseLate fall 2011Incremental updatesThrough 2012, adding visualization capabilities, events, etc.
Suma project team	Jason Casden (project lead) Joyce ChapmanEric McEachernRusty Earl Rob RuckerHill Taylor36
Thanks!ContactJoyce Chapman – joyce_chapman@ncsu.eduMore infohttp://www.lib.ncsu.edu/dli/projects/spaceassesstoolhttps://github.com/cazzerson/Suma37

Introducing Suma: an open-source tablet application for library assessment. Assessment Forum, ALA 2011

  • 1.
    Introducing Suma:An opensource, staff-facing tablet application for library assessmentJoyce ChapmanNorth Carolina State University LibrariesALA, Assessment ForumJune 24, 20111
  • 2.
    Problem statementWe arealways trying track more data about how patrons are using our spaces and services in order to better understand our users and in turn, to better serve their needs. 2
  • 3.
    Why do wecare?With data about use/activity patterns in different library spaces we canImprove staffing modelsMake informed purchasing decisions Optimize space for patron needs (quiet study, collaborative areas)Take an evidence-based approach to planning future services and spaces3
  • 4.
    Where it getstrickyMany libraries perform manual counts of patron activities (headcounts, group study, laptop use) for assessment purposesThe process involves tedious collection mechanisms, lots of paperwork, and much room for errorThere is no coordinated effort to help departments analyze their data4
  • 5.
    Our solutionAn opensource tablet and web-based application to aid library staff in gathering, storing, exporting, analyzing, and visualizing data about patron activities across spaces/activities/time and around events5
  • 6.
  • 7.
    Add image ofthe current practice
  • 8.
    Problems of currentpracticeInconsistent dataDecentralized data storage Uncontrolled vocabulariesNo dedicated staff to help with data analysis= High barriers to analysis and data reuse in the current system8
  • 9.
    SumaA pocket dataanalyst for every librarian
  • 10.
  • 11.
    What is thesystem?11
  • 12.
  • 13.
  • 14.
  • 15.
  • 16.
  • 17.
  • 18.
  • 19.
    Browser-based data dashboard“Chartwizard” will lead staff through a series of choices to produce charts comparing different aspects of dataCharts can be exported for print or webData in charts can be downloaded as delimited/Excel files
  • 20.
    What kinds ofdata analysis?Compare an activity across multiple spacesCompare multiple activities in one spaceAnalyze trends over…Fiscal yearsAcademic semestersWeeks of the semesterDays of the weekHours of the dayAnalyze aggregate ratios20
  • 30.
  • 31.
  • 32.
  • 33.
  • 34.
  • 35.
    TimelinePrivate beta testingreleaseSummer 2011. We are looking for enthusiastic and involved testers, who want to try out the data collection client and provide detailed feedback.Open beta testing releaseLate fall 2011Incremental updatesThrough 2012, adding visualization capabilities, events, etc.
  • 36.
    Suma project team JasonCasden (project lead) Joyce ChapmanEric McEachernRusty Earl Rob RuckerHill Taylor36
  • 37.
    Thanks!ContactJoyce Chapman –joyce_chapman@ncsu.eduMore infohttp://www.lib.ncsu.edu/dli/projects/spaceassesstoolhttps://github.com/cazzerson/Suma37

Editor's Notes