
Recommended
Recommended
More Related Content
Similar to International Journal of Production Research,Vol. 45, No. 11.docx
Similar to International Journal of Production Research,Vol. 45, No. 11.docx (20)
More from normanibarber20063
More from normanibarber20063 (20)
Recently uploaded
Recently uploaded (20)
International Journal of Production Research,Vol. 45, No. 11.docx
- 1. International Journal of Production Research, Vol. 45, No. 11, 1 June 2007, 2567–2594 Collective customer collaboration impacts on supply-chain performance GREG ELOFSONy and WILLIAM N. ROBINSON*z yFisher Graduate School of International Business Monterey Institute of International Studies, 460 Pierce Street, Monterey, California 93940, USA zRobinson College of Business, Computer Information Systems Department, Georgia State University, Atlanta, GA 30302, USA (Revision received November 2006) Facilitated by a Collective Customer Collaboration (C3) system, the impact of customer knowledge and demand information on supply-chain performance is examined. The basic characteristics and theoretical benefits of C3 systems are presented and tested using a multi-agent supply-chain simulation. The simulation test results indicate that (1) supply chains employing C3 front- ends, without sharing information, show performance improvements over traditional supply
- 2. chains; (2) supply chains employing C3 front-ends, while also sharing information, show performance improvements over those that did not share information; and (3) centralized supply chains employing C3 systems, while also sharing informa- tion, show performance improvements over their decentralized counter-parts. Keywords: Collective Customer Collaboration (C3) system; Supply chain; Customer knowledge 1. Introduction The demand for co-designed products, where customers participate in sharing knowledge and information to specify products which have custom characteristics, is continually increasing (Piller et al. 2005). And, recently, some have asserted that having the interaction skills and ability to match custom configurations to the needs of customers during a process of co-design is becoming a primary source of competitive advantage (Sheth et al. 2000, Seybold et al. 2001). Further, while B2B markets have seen various forms of customization become relatively more commonplace (Homburg et al. 2000), co-design in most consumer markets is still in a nascent stage, and therefore may afford rich research opportunities for exploration. Collective Customer Collaboration (C3) is a recent step in co-
- 3. design, and entails a group of customers taking part in product design as well as committing to product purchase (Piller et al. 2005, Ogawa and Piller 2006). Industry examples of C3 approaches include those undertaken by Threadless.com, Muji, and Yamaha. Threadless has a community of customers that submit, inspect, and approve new t-shirt graphic designs; Muji uses an online customer community to help design *Corresponding author. Email: [email protected] International Journal of Production Research ISSN 0020–7543 print/ISSN 1366–588X online � 2007 Taylor & Francis http://www.tandf.co.uk/journals DOI: 10.1080/00207540601020528 consumer products such as bean-bag sofas, bookshelves, and portable lamps; and Yamaha used a team of users to test and make recommendations for musical instruments, and has teamed with online C3 providers in the process. As a variant of mass customization, C3 entails, to some extent, considerations of supply-chain redesign (Boynton and Victor 1991, Pine 1993, Pillar et al. 2004, Salvador et al. 2002, Westbrook and Williamson 1995). Also, because C3 promises
- 4. particularly high levels of customization, the redesign needed may be significant. In the context of Knowledge and Information Technology Management systems (KITM) in manufacturing, our interest in this paper is to examine the basic characteristics of C3 systems, and also to evaluate the effects of C3-generated customer knowledge and demand information on supply-chain efficiencies over a variety of designs. In line with testing the predictions made by Piller (Piller et al. 2005) and the work done by Aviv (2001), Cheung and Lee (2002), Kulp (2002) and Moinzadeh (2002), we are interested in clarifying how information sharing and coordination via a C3 system affects production costs. We believe these to be interesting issues, insofar as the theories about C3-based savings have yet to be broadly tested. And, the feasibility of using C3 in various supply-chain designs is yet to be explored – for example, those designs being dependent on factors such as anti-trust regulations and competitive security considerations (Lee and Whang 2000). To this end, we discuss the basic principles of C3, and use a C3 system exemplar as cited by Ogawa and Piller (2006) to illustrate its interaction with three, separate supply-chain configurations. We use a multi-agent simulation, benchmarked against the analytical model derived by Anand and Mendelson (1998), to evaluate the
- 5. following questions: (1) do supply chains employing C3 without sharing information show performance improvements over traditional supply chains, as lead times diminish? (2) Do supply chains employing C3, while also sharing its information, show performance improvements over their non-sharing counter-parts, as lead times diminish? (3) Do wholly owned or centralized supply chains employing C3, while also sharing its full information, show performance improvements over decentralized supply chains, as lead times diminish? This article is organized as follows: in section 2, we describe the principles and theories of C3 systems, and provide the literature and background for our three research questions. In section 3, we detail the components, assumptions, and design of our simulation model. In section 4, we describe our research methodology. In section 5, we provide the simulation results. In section 6, we discuss the results in light of the predictions found in the literature and compare them to our hypotheses. Finally, section 7 presents our conclusions. 2. C3 system characteristics and assertions Recently, Piller et al. (2005) and Ogawa and Piller (2006) have proposed and refined the idea of Collective Customer Collaboration to characterize the process of using customer knowledge in an effort to take the best features of mass customization and
- 6. postponement, and include collaborative customer knowledge to create the ‘‘most’’ custom products at prices that reflect mass-production manufacturing. In general, C3 is an outgrowth of co-design, where co-design is characterized as a process of collaborative value creation between multiple actors (Wikström 1996, Ramirez 1999, 2568 G. Elofson and W. N. Robinson Prahalad and Ramaswamy 2004, Berger et al. 2005). Through basic co-design, customers detail their product specifications and engage in product definition processes by translating their requirements into the physical domain (von Hippel 1998, Khalid and Helander 2003). Further, communities for co- design reflect expert knowledge of customer groups that interact not only with one company, but importantly, also with each other. Communities for co-design extend beyond organizational structures, spanning functional boundaries to create common knowledge and value (Gibbert et al. 2002). C3 necessarily entails an interplay between customer and manufacturer. Proponents of this approach assert that it offers access to a rich stream of information that allows the firm to cut back on fixed costs that came about due to the necessity of maintaining a high level of operational flexibility. This cost-saving potential is founded on the
- 7. capability to design and re-design the routines to utilize co-design information and to combine this infor- mation with existing knowledge to improve the efficiency of the whole value system (De Meyer et al. 2002, Rowley 2002, Thomke and von Hippel 2002). Further, this challenge includes utilizing the information from the co-design process to enhance the loyalty of customers towards the firm (Pine et al. 1995, Berger et al. 2005). Proponents of C3 argue that there are both ‘‘soft’’ and ‘‘hard’’ advantages over extant customization approaches. These include the following advantages: 1. Mass customization provides too many choices and excess variety, while C3 allows one to specify instead of choose. 2. Postponement can result in inventory waste due to product flops, while C3 begins the full manufacturing cycle only after customers show their full commitment to purchase a specific item. 3. C3 approaches promise greater support for creative activities (von Hippel and Tyre 1995, Sawhney and Prandelli 2000, Nemiro 2001, Gascó- Hernández and Torres-Coronas 2004) and increases customer integration into company activities (Schubert 2000). 4. C3 enables manufacturers to avoid having to make risky
- 8. decisions about what components to prefabricate or about the optimal timing of postponement. 5. C3 does not require interactions with individual customers nor does it require running manufacturing lots of size one. Overall, C3 holds three major advantages in the course of customer co-design: (1) the generation of customer knowledge to provide a better starting (pre-) configuration; (2) the support of collaborative co-design fostering joint creativity and problem solving; and (3) the building of trust and the reduction of the perception of risk (Berger et al. 2005). 2.1 Exemplar C3 system Ogawa and Piller (2006) cite the CMP broker (Elofson and Robinson 1998) as an exemplar C3 system, and we use this system to generate our simulation assumptions. The CMP broker uses the World Wide Web as a channel through which knowledge of individual buyers is represented in a multi-stage bargaining action. The bargaining action takes place in three stages: (1) knowledge of like-minded buyers is used to group them through a collaborative filtering algorithm; (2) product requirements from the like-minded buyers are clarified and agreed upon through an automated Supply-chain performance 2569
- 9. negotiation session; and (3) the product specification and the quantity of orders is put out to suppliers for bid. An example of how the CMP broker is used is shown in figure 1. In the figure, customers A and B are members of some n number of like- minded buyers who are seeking to buy a personal computer that primarily supports surfing on the Web. Customer B wants lots of CPU power, a large flat-screen monitor, and substantial storage capacity. Customer A wants a large flat-screen monitor, modest CPU power to save money, and modest storage capacity. Together, customers A and B – along with the other like-minded buyers – engage in a negotiation over the sought-after PC’s product specification until it is agreed that they will try to buy a PC with a large flat-screen monitor, modest CPU power, and large storage capacity. Once this agreement has taken place, the PC specification, along with the number of orders, is submitted to one or more worldwide suppliers for pricing and a deal is made. The goal of a CMP broker, therefore, is to facilitate the process of providing buyers with products that are better suited to their needs, but without the penalty of higher prices – that is, to consolidate buyer-purchasing decisions and achieve better
- 10. results through lower search costs and higher bargaining power. 2.2 C3 system architecture Figure 2 illustrates the logical component architecture of the CMP broker. Each of the rectangles represents a computerized component within the UML interaction diagram. Customer, supplier, and broker are the three main components; the broker consists of three subcomponents. The shadowed rectangles of customer and supplier indicate that multiple components (e.g. multiple customer systems) can interact with the broker. A variety of physical architectures can realize the logical architecture. Typically, the three main components each reside on separate computers. However, each Bob’s spec: inexpensive, large flat-screen monitor, modest CPU, modest storage capacity CMP Broker Assisted collective contract negotiation Assisted collective product negotiation Final group contract:
- 11. large flat-screen monitor, modest CPU, large storage capacity Negotiated group spec: large flat-screen monitor, modest CPU, large storage capacity Carol’s spec: large flat-screen monitor, powerful CPU, large storage capacity Figure 1. An illustration of an CMP broker. 2570 G. Elofson and W. N. Robinson broker subcomponent can also reside on separate computers. Moreover, the broker can be partitioned into the common layers of presentation, application, and database, each of which can be placed on separate computers, thereby defining a four-tier architecture (in which the customer or supplier occupies the fourth client- presentation tier). There are a number of implementations for each of the components – perhaps, of the most interest are the collaborative filtering systems (Resnick and Varian 1997, Herlocker et al. 2004) and the negotiations systems used to generate product
- 12. specifications (Elofson and Robinson 1998, Robinson and Volkov 1998, Su et al. 2001, Jin Baek and Segev 2003, Dang and Huhns 2005, Hyung Rim et al. 2005). A sequence of the steps that a CMP broker must take to create a custom order is presented next. The following numbered steps refer to the sequence numbers in figure 2. 1. Start: a buyer states a request for a PC. (1.1) Preference acquisition: buyer specifies PC preferences, usage informa- tion, and price preference. (Many other buyers contribute their buying preferences.) (1.2) Collaborative filtering module uses knowledge of preferences to find group(s) of like-minded buyers. 2. Based on buyer group characteristics, the negotiation module suggests existing product(s) as a straw-man from which to begin customization (e.g. Pentium 3, 1 Gigabyte Hard drive, 17" Flat screen, DVD). 3. Buyer feedback: buyer requests deal improvement mediated by the negotiation module. Customer Broker
- 13. Supplier Request processor Collaborative filter Specification generator collaborative preferences preferences 1 request product 2 collaborative spec 3 update preferences 4 updated spec 5 accept spec 6 accept bid 5.1 product spec 5.2 bid 6.1 accept bid Figure 2. Component architecture of the CMP broker (UML 2.0).
- 14. Supply-chain performance 2571 4. Contract restructuring: negotiation module restructures the deal to create new contracts for buyers to examine. . Iterative restructuring: repeat steps 3–4. 5. Proposal submission: buyer requests PC deal. (5.1) Auction module offers custom product to suppliers for bid. (5.2) Basic matching: suppliers provide bids, which are matched with preferences. 6. Deal creation: buyers and suppliers agree to deal: end. Thus, the main activities that are mediated by the CMP broker include: (1) a buyer considers a product purchase; (2) the CMP broker finds other people interested in making a similar purchase; (3) a negotiation session among buyers to agree on a specific set of product characteristics takes place; and (4) the custom product specification goes out for bid. The result of such a session is a completed specification of n number of PC orders to be filled by a given supplier. The product configuration specification is the planning input for the customized
- 15. manufacturing, assembly, and delivery steps. While these processes are cost drivers Piller et al. (2004) assert that if manufacturing and assembly are performed on-demand instead of on-stock, savings may nevertheless be possible, including the following: 1. Inventory reduction or elimination of inventory in distribution chain; reduction in safety stock. 2. Planning complexity reduction; reduction of adaptation costs (of planning decisions), fashion risk, and development costs (production flops). 3. Capacity utilization and stability: no bull-whip effect via stable processes and the reduction of the over-capacity required in make-to-stock systems to adopt to short-term changes in trends. Of particular interest in our study is the impact of the configuration information process, which can reduce supply-chain inventory (assertion 1 above). However, we assume that distinguishing information transfer as simply sharing versus not sharing information is insufficiently nuanced for evaluating supply- chain designs. For example Lee and Whang (2000) point out that supply-chain partners must take care when sharing sensitive cost data, such as production yields or parts pricing – sharing full information can lead to less bargaining power and falling
- 16. profits. Further, confidentiality must be a top priority under some competitive circumstances, and, to further complicate issues, information sharing can lead to a violation of antitrust regulations. Therefore, we wish to investigate information transfer under specified circumstances, to reflect the dilemmas that face supply-chain designers. 3. C3 interaction with supply chain For our evaluation of the interaction of the C3 system with a supply chain, we assume that the supply chain under consideration has exclusive use of the CMP broker, and thus has exclusive C3 production specification information. 2572 G. Elofson and W. N. Robinson Consistent with current C3 systems (Piller et al. 2005, Ogawa and Piller 2006), we assume that the supply chain manufactures the products, rather than sending the specification to auction (steps 5.1 and 5.2 of section 2.2). Therefore, the supply-chain configurations evaluate using a make-to-order production policy of C3 products. However, the information kind and transfer varies: demand- forecasting methods vary (traditional vs. CMP based) and information transfer varies (sharing and not sharing among nodes).
- 17. Make-to-order strategies are typically used when there are long lead times that allow orders to begin upstream in the supply chain, and customers’ needs are not excessively time sensitive. For example Lee (1996) cites a disc- drive manufacturer that receives different orders from OEMs. They assume a supplier of raw materials, a manufacturer that supplies parts, and a manufacturer that produces units in two stages within time T. The first stage of production generates the generic unit in time t, and the generic stock units are placed in inventory. To differentiate the generic products and personalize them, they are put through a second process in a time T � t. After time T, the products may be shipped to either a distribution centre or buyer. A C3’s CMP broker improves on this strategy by enabling an increase in order size as well as improved information precision in demand forecasting (Robinson and Elofson 2001). Given that our C3 system increases order size and information precision, we are interested in two supply-chain variables: (1) information sharing; and (2) centralization, in the context of centralized and decentralized control. 3.1 Information sharing Information sharing has been treated broadly in the literature, and has included
- 18. online supplier information with buyer inventory levels (Moinzadeh 2002), vendor managed inventory (VMI) information (Cheung and Lee 2002, Kulp 2002), non- specific advance demand information (Thonemann 2002), continuity of flow (Heikkila 2002), warehouse inventory control effects (Qi-Ming et al. 2002) and shared forecasts (Aviv 2001). Notwithstanding the many treatments of information sharing in the literature, some generalizations may be made from the results. First, in keeping with Milgrom and Roberts’ (1990) assertion that information may substitute for inventory in economic terms, the literature on information sharing shows positive, albeit varying, levels of savings (Chen 1998, Cachon and Fisher 2000, Lee et al. 2000, Moinzadeh 2002). Second, information sharing has positive savings for a variety of conditions: these include VMI programs (Kulp 2002), collaborative forecasting (Aviv 2001), and online order information (Moinzadeh 2002). However, reports of when information sharing is most effective vary. Lee et al. (2000) showed that benefits were greatest when demand was significantly correlated over time, while Moinzadeh (2002) reported that savings were greatest under extraordinary circumstance such as very large orders or very low inventory. Additionally, concerning the information which would be
- 19. shared, information precision has typically shown positive results for inventory savings Anand and Mendelson (1998) and Kulp (2002). Not surprisingly, these studies showed that precision in forecasts and orders resulted in inventory savings, especially under conditions of delayed differentiation. Supply-chain performance 2573 Overall, information sharing has positive results on inventory savings. Therefore, we would expect that technologies that facilitate the sharing of information, together with increasing the precision of information, would also help to increase inventory savings. Thus, our first assertion is as follows: Assertion 1: as information sharing increases across a supply chain, inventory savings increase. 3.2 Centralized control Centralized control exists when decisions on how much, and when, to produce goods are made centrally, based on material and demand status of the entire system. Decentralized control indicates situations where each individual unit in the supply chain makes these decisions based on local information, and has the decision authority to do so (Lee and Billington 1993). Even though we
- 20. might associate centralized control with a wholly owned supply chain, and decentralized control with a multiply-owned supply chain, this is not always the case. Lee and Billington (1993) point out that ‘‘. . . many companies have intentionally decentralised control of their business units or functions’’ (p. 835). These control considerations have received some significant attention in the literature. Anand and Mendelson (1997), early on, studied various levels of control and concluded that the issue was highly nuanced and contingent on a multiplicity of factors (decision rights, information location, supply-chain design) deserving greater study. Chen (1999) found that decentralized supply chains have optimal replenish- ment strategies when the upstream suppliers are given customer demand information beyond downstream orders. Kouvelis and Gutierrez (1997) and Lee and Whang (1999) found that centralized control showed greater profitability, especially when there is significant fluctuation in demand. The overall thrust of the literature suggests that centralized control, with its full disclosure and high coordination, is generally advantageous for overall supply-chain performance. Also, we have seen no evidence in the literature that indicates that greater information sharing confounds the other characteristics of centralized control (that is, having more precise information does not
- 21. interfere with coordination or material flows). Consequently, we suggest the following: Assertion 2: centralized control shows greater overall supply- chain performance than decentralized control, and the performance differences will increase as delivery windows decrease. 3.3 Information precision and batch size Within the bounds of supply-chain management, a C3 system changes the characteristics of information precision. We assume that, because a C3 system helps define product configurations that are agreed upon by a group of individuals, individual make-to-order requests may instead become batched, make-to-order requests. We assume that information precision in demand forecasting is increased insofar as large-scale orders are made through buyer consolidation and early 2574 G. Elofson and W. N. Robinson purchase commitment, and so forecasting for non-stock items is obviated with the presence of a C3 system. Cachon (1999) showed that retail orders increasing in batch size resulted in lower inventory costs for suppliers. Therefore, because C3 aggregates
- 22. orders we expect that the opportunity for lower inventory costs exist. Further Kulp (2002) and Anand and Mendelson (1998) showed increased savings with information precision in demand forecasts. Cvsa and Gilbert (2002) illustrated that with sufficient demand information certainty, advanced purchasing further increases the possibility for strategic market leadership. Consequently, we make the following assertions regarding the C3 system used in our simulations: Assertion 3: a C3 system’s batching capability will likely lower inventory-holding costs. Assertion 4: a C3 system’s increased information precision will likely lower inventory-holding costs. These four assertions lead us to the following hypotheses: Hypothesis 1: a supplier using C3 systems will have decreased inventory-holding costs compared to a supplier with no C3 system. We expect this because the supplier with a C3 system will have greater information precision and increased size of batched orders, and assertions 3 and 4 suggest that inventory-holding costs should diminish accordingly. Hypothesis 2: a set of two, autonomous suppliers in a supply chain, both sharing demand information from a C3 system, will have decreased
- 23. inventory-holding costs when compared to a supply chain with only the downstream supplier using a C3 system. We expect this outcome because the two suppliers have the added advantage of sharing information and gain the advantages of doing so as suggested in assertion 1. Hypothesis 3: a set of two, centrally controlled, suppliers in a supply chain, both sharing demand information from a C3 system, will have decreased inventory- holding costs when compared to a supply chain using decentralized control. We expect this outcome because of assertion 2 ‘‘Centralized control shows greater overall supply-chain performance than decentralized control and the performance differences will increase as delivery windows decrease.’’ 4. Research methodology To evaluate the effects of a C3 system on a supply chain, we employ a simulation methodology. The use of simulations in research has broadened over time to include Supply-chain performance 2575 a widening range of applications, ranging as far as to evaluate descriptions of
- 24. bounded rational but adaptive economic systems (Cyert and March 1963, Crecine 1969), normative implications characterized by intentional rational economic behaviour (Nelson 1982), as well as issues as complex as organizational learning (Levinthal and March 1988, Lant and Mezias 1990). Within the topic of this paper, simulations have also been used to evaluate supply-chain characteristics (Fulkerson and Staffend 1997, Bhaskaran 1998, Kaihara 2001, Raghunathan 2001, Missbauer 2002, Persson and Hagger 2002, Zhao et al. 2002). The limitations of simulations include the fact that they are dependent upon researchers’ theoretical assumptions and the initializing values of the independent variables. Some of these concerns may be obviated by changing the assumptions of the model or by altering the initial variables or both, and performing a sensitivity analysis over the manifold versions of the model. The problems of simulations generally include, as with any abstraction, their omission of detail, limiting somewhat the complexity of individuals and decisions and processes. Additional problems include attempting to verify the models under consideration. To capture the salient characteristics of the supply chain in our study, we began by recognizing that there are five elements of a simulation (Whicker and Seligman 1991).
- 25. 1. Researcher specified assumptions about the model being tested. 2. Parameters (fixed values and control variables). 3. Inputs, or independent variables. 4. Algorithms, or process decision rules that convert input values to outputs. 5. Outputs, or dependent variables. We explain these elements in the sections that follow, and detail the simulation implementation. 4.1 Modeling assumptions Our supply-chain simulation model is derived from the modeling elements defined by Strader et al. (1998, 1999). Previously, we modeled a product postponement supply chain (Robinson and Elofson 2000, 2001), a key step in the C3 model, and validated that simulation model against the analytic model of Anand and Mendelson (1998). Herein, we report our analysis of the supply-chain model, which now includes the use of the C3 system. The supply-chain model is abstract. In it, each node can represent a workstation within the context of job scheduling in a production facility. Alternatively, each node can represent a site within multinational cooperating companies. Thus, times and costs are relative within the abstract model. Figure 3 illustrates the structure of the supply chain. Four kinds
- 26. of nodes are shown: (1) supplier; (2) manufacturer; (3) distributor; and (4) customer. Together, manufacturing nodes M2.1 and M2.2 define one aggregate manufacturing facility – their intra-communication times for orders and parts are less than the times for communicating with the external nodes, M1 and D. Moreover, manufacturing nodes M2.1 andM2.2 cooperate to produce timely personalized products through their complementary polices of build-to-forecast (BTF) and make-to- order (MTO), respectively. Manufacturing node M1 uses a BTF policy. 2576 G. Elofson and W. N. Robinson In figure 4, a broker employing a C3 system (B) is inserted between the distributor and the manufacturing nodes for those supply chains that use the C3 system. The placement of the C3 system node (B) models either of the real-world implementations cases in which: (1) the distributor uses the C3 system or (2) the most downstream manufacturer uses the C3 system. 4.2 Fixed simulation parameters We defined two supply models that differ only in their use of the C3 system. Compare figure 3 with figure 4. Both models have parameters that were fixed identically during all simulations. They included the following
- 27. parameters: . Model parameters: in addition to the basic structure of the supply chain, both models also define how orders and parts move between and within nodes of the supply chain. Numeric values define the order and part forwarding times, production times, inventory costs, and start-up inventory quantities. In the simulations, the start-up inventory quantity is 20 for each product type. Materials & materials information flow Demand information flow Z is produced from X and Y: ⇒ S ⇒ ⇒ ⇒ M1 0,1 3 4 5 0,2 1,2 ⇒ ⇒ ⇒
- 28. M2,1 3,4 6 7 8 3,5 4,5 ⇒ ⇒ ⇒ M2,2 6,7 9 10 11 6,8 7,8 ⇒ ⇒ ⇒ D C 9 9 10 11 9 10 11
- 29. 10 11 X,Y Z Aggregate node S Figure 3. Supply chain without C3 system. Materials & materials information flow Demand Information Flow Z is produced from X and Y: ⇒X,Y Z Aggregate node S M1 0,1 3 0,2 4 1,2 5 ⇒ ⇒ ⇒ ⇒ ⇒ ⇒ ⇒ ⇒
- 30. M2,1 3,4 6 3,5 7 4,5 8 ⇒ ⇒ ⇒ ⇒ ⇒ ⇒ ⇒ ⇒ M2,2 6,7 9 6,8 10 7,8 11 ⇒ ⇒ ⇒ ⇒ ⇒ ⇒ ⇒ ⇒ B 9 9 10 10 11 11⇒ ⇒ ⇒
- 31. D C 9 9 10 10 11 11 ⇒ ⇒ ⇒ ⇒ ⇒ ⇒ 9 10 11 Figure 4. Supply chain with C3 system, as supported by the broker B. Supply-chain performance 2577 Each product production time is 0.01 hours. Inventory costs are computed as the holding time multiplied by a fixed cost: (PartexitTime � PartarrivalTime) � cost. For all nodes, the cost is $1.00 per part. . Order and part parameters: all orders originate at customers, pass through the distribution node and then onto the manufacturing nodes. The C3 system model includes a C3 system between the distribution and manufacturing nodes. All parts originate at a supplier and are forwarded to the
- 32. manufacturing nodes. . Part parameters: products are manufactured from parts, as shown in the figures. The finished product 9, for example, is manufactured from parts 6 and 7, which in turn are manufactured from parts 3, 4, and 5, which are manufactured from parts 0, 1, and 2. Thus, a single finished product requires 8 parts, 6 manufacturing processes, 3 manufacturing nodes, as well as the supplier and distributor nodes. Thus, small changes in demand can cascade into substantial inventory changes. Manufacturing nodes use a production plan horizon of 8 hours, which models three production schedules in 24 hours. . Demand variability: the market demand for a quantity of a product at time point t is represented as normal distribution over a range [low, high]. At the time each order enters the simulation, the simulator randomly selects a quantity from the distribution. The ranges vary with the demand pools, as described in the next section (x4.3). . Demand forecasting: nodes M1 and M2.1 use a simple exponential forecasting function to predict demand quantity for their products. The formula is as follows:
- 33. Forecasted Demand (t2) ¼ �� Actual Demand (t1) þ (1 � �) � Forecasted Demand (t1). Actual Demand (t1) is the actual demand from previous period. Forecasted Demand is the forecasted demand from previous period. �2 [0,1]; it weights the actual vs. forecasted demand. The forecast horizon is 2 days, and the � parameter is 0.5. . Simulation time: all simulations run for 45 days with a time step of 1.0 hour. 4.3 Independent simulation variables Information sharing, C3 system, and order lead times are independent simulation variables. 4.3.1 Information sharing. In the simulation, information sharing is modeled as the communication of order demand and inventory levels between nodes. Three levels of information sharing are considered: 1. None: no information is shared between nodes. 2. Some: demand information, comprised of product type, quantity and due date, is shared among nodes. Demand information flows upstream, from the customers toward the suppliers. 2578 G. Elofson and W. N. Robinson
- 34. 3. Most: demand information and supply information, comprised of inventory levels, is shared between nodes. Supply information flows downstream, from the suppliers toward the customers. 4.3.2 C3 software. In the simulation, the effects of the C3 system are modeled by two information improvements: (1) increased precision in the demand information; and (2) increased demand homogeneity, specifically, orders are aggregated into pools having common characteristics. The improvements are modeled as follows: . Information precision: generally, one can assume that the demand informa- tion (DI) received by a supply-chain node is accurate. That is, DIreceived ¼ DIactual. However, demand information can be inaccurate. Let � be the precision of the demand information (DI). Then, we model DIreceived as DIreceived ¼ DIactual þ (DIactual � �) Thus, if � is 0, then the demand information is accurate; that is, DIreceived ¼ DIactual. However, if � is 1, then the demand received is twice the actual demand. . Demand pooling: demand pooling aggregates multiple demand orders occurring in a period into a single ‘‘batched order,’’ or pool. Consider the order arrival rate, which is the demand quantity for a specified period: arrival rate ¼ DQ/(t2 t2 � t1). The average arrival rate for some sequence of periods
- 35. i..n, Pi ¼ tiþ1 � ti is DQi/Pi. Demand pooling aggregates the demand over a sequence of periods into a single demand order: demand pool ¼ � DQi. Of course, larger demand pools imply longer demand periods because pools are created by aggregating earlier orders with later orders. In the simulation, two levels of the C3 system are considered: 1. No use of the C3 system. . Without the C3 system, � ¼ [0.0, 0.1], !�"�"� is drawn from the normal distribution over the range. Thus, the non-C3 system model has up to 10 percent demand imprecision. Without the C3 system, the demand pools are one-half that of the C3 system model. The DQ is drawn the normal distribution over the range [5, 15], where the period, Pi, is 24 hours. 2. Use of the C3 system. . With the C3 system, � ffi, which specifies perfect demand precision. . With the C3 system, the DQ is drawn the normal distribution over the range [5,15], where the period, Pi, is 48 hours. The combined modeling elements define the C3 system supply chain with better demand information and greater demand pooling than the non-
- 36. C3 system supply chain. 4.3.3 Order lead times. Nine order lead times are analysed. Lead times ranged from 0 to 32 hours at 4-hour increments (e.g. 0, 4, 8, 16, etc.). The longest lead time, of 32 hours is four times the production planning period. Variability is introduced into Supply-chain performance 2579 lead times by adding a random value �, where � is selected from the normal distribution over the range [0.0, 2.0] hours. 4.4 Simulation functions A simulation begins with the arrival of orders. Each node of the supply chain fulfils orders that arrive from its upstream nodes by producing products from parts that arrive from its downstream nodes. Two production policies are used: BTF and MTO. These basic simulation functions are described next. . Order arrival: orders arrive for each product after each arrival interval elapses. Each order has an associated quantity described by a normal distribution. A supply-chain node that receives an order can send orders to its own suppliers for any necessary parts. Thus, a customer order can create a
- 37. cascade of orders through the supply-chain network. In the simulation, a node fulfils orders according to its production policy under the constraints of the fixed simulation parameters (see the section entitled ‘‘Fixed simulation parameters’’). . Make to order production: in a MTO production policy, a node produces products to fulfill specific orders. Expedited orders are allowed. Thus, late arriving orders with short lead times, may be inserted in front of existing orders in the production plan. . Build to forecast production: in a BTF production policy, a node produces products as a means to fulfill an expected quantity of future orders, as determined by a forecast (Mccutcheon et al. 1994). As orders arrive at a node, the node can continually update its expectation of future orders. (The section entitled ‘‘Fixed simulation parameters’’ defines the exponential forecasting function.) . Information sharing: supply-chain nodes can share information. For example, an upstream node can share its demand forecast with a downstream node. This allows the downstream node to update its demand forecast to be consistent with the upstream node. Figures 3 and 4 illustrate such
- 38. information sharing. . Part arrival: part arrival is analogous to order arrival. Parts arrive at supply nodes after each arrival interval elapses. Each part shipment has an associated quantity described by a normal distribution. 4.5 Dependent simulation variables Each simulation run tracks a number of dependent variables, including: cycle time, fulfillment rate, inventory cost, and capital utilization. Inventory cost is the focus on the following experiments and discussion. However, cycle time is also referenced. Their simulation functions are defined here. . Inventory cost: inventory costs are computed for each node. It is the holding time multiplied by a fixed cost: (PartexitTime � PartarrivalTime) � cost. The analysis in the following sections on Experiments and Discussion refer to the total inventory costs for all nodes of the supply chain excluding the supplier, distributor, and customer. 2580 G. Elofson and W. N. Robinson . Cycle time: cycle times are computed for the distributor node of each supply chain. It is the order fulfillment period: (PartexitTime � OrderarrivalTime).
- 39. These dependent variables are used to assess the effects of the experiments. 4.6 Simulation implementation Our simulations are built using simulations tools. The supply- chain design uses some components defined by the Strader et al. simulation framework (SSM) (Strader et al. 1998, 1999). A simulation framework is a carefully designed set of reusable components that can be specialized to produce custom simulations. The Strader et al. SSM defines configurable supply-chain components for order management, inventory management, production planning, capacity planning, materials planning, shop floor control, and manufacturing systems. SSM is built upon Swarm, a general- purpose agent-based simulation framework. Swarm is a multi-agent software platform for the simulation of complex adaptive systems. In the Swarm system the basic unit of simulation is the swarm, a collection of agents executing a schedule of actions. Swarm supports hierarchical modeling approaches whereby agents can be composed of swarms of other agents in nested structures (Minar et al. 1996). Our simulation implementations benefit from the pre-defined supply-chain components of SSM, and the general simulation processing and programming
- 40. environment of Swarm. The top of figure 5 illustrates the SSM simulation network defined in Strader et al. (1998), where each entity node is defined as interacting agents, as shown at the bottom of the figure. SSM configuration parameters include the supply-chain network design and the inputs, outputs, and algorithms of the agents. Configuration is specified as parameters in SSM, as well as data and programs in the underlying Swarm framework. In Strader et al. (1999), Strader et al. describe the interactions among the agents. [. . .] an entity ScnESwarm A receives an order from its customer ScnESwarm C. The order flows to the order management agent (OrdM). According to the customer lead times, the inventory availability information (from InvM), the production plan (from PrdP), and the manufacturing capacity (CapP), the order management agent assigns a due date to the order. If the products are in stock, the order is filled by shipping the products from inventory. If the products are in receiving, the due date is set according to the delivery date of the products. For an entity with manufacturing capability, the order is forwarded to the production-planning agent (PrdP) where the schedule for
- 41. making the products is planned. The capacity-planning agent (CapP) and the material- planning agent (MatP) are partner agents in generating achievable build plans. The material planning obtains build plans from the production-planning agent to allocate materials for manufacturing. It also contributes information about material availability to production planning for scheduling. The capacity planning agent (CapP) plans capacity by taking the build plan from PrdP and sends capacity Supply-chain performance 2581 usage information to PrdP for scheduling the build plan. The SCN management agent (ScnM) takes the order information to choose suppliers in allocating material sources As can be inferred from the above descriptions, the SSM simulation framework provides a rich, detailed, accurate representation of a supply- chain network. Our use of the SSM follows the paradigm of software product line engineering, which addresses the systematic reuse of core assets for building related products
- 42. (Clements and Northrop 2002, Pohl et al. 2005). A product line is a set of similar products that are derived from common components and yet possess varied features (a) (b) Figure 5. An example supply chain (top), where each node is defined as multiple interacting agents (bottom). Figures adapted from Strader et al. (1998). 2582 G. Elofson and W. N. Robinson to meet specific customer requirements. Each individual product within a product line is called a product variant. Our simulations are product variants derived from the SSM framework. As a consequence of using SSM, we gain the benefit of individually validated components that can be adapted and integrated to create new supply-chain designs. Our simulation designs vary from the SSM defined in Strader et al. (1998), as depicted at the top of figure 5. For example, our designs specify 6- and 7-tier networks, as figures 3 and 4 show, in contrast to the 5-tier model defined in Strader et al. (1998). Other variations include different kinds of
- 43. components (e.g. multiple manufacturing nodes, a newly defined broker node), the simultaneous use of multiple policies (MTO, BTF), as well all of the simulation parameters (see the section entitled ‘‘Fixed simulation parameters’’). 4.7 Benchmarking the models Law and Kelton suggest six techniques for increasing the validity and credibility of a simulation model (Law and Kelton 2000). These include (1) conversations with subject-matter experts; (2) observations of this system; (3) comparison with existing theory; (4) comparison with similar simulation studies; (5) experience and intuition of the modelers; and (6) animation. We have applied all of these techniques to our simulations. Techniques 3 and 4 are perhaps the most important because of the precision and strength of their argumentation. The introductory and concluding sections draw comparison with existing theory. We compared our simulations with prior studies, including analytic studies (Anand and Mendelson 1998), our own prior simulations (Robinson and Elofson 2000, 2001), and results reported in Strader et al. (1998, 1999). Our simulated inventory costs are consistent with Anand and Mendelson’s analytically derived costs (Anand and Mendelson 1998), and our manufacturing policies are consistent with Strader et al. (1998, 1999): that is, we use the same policies but do not
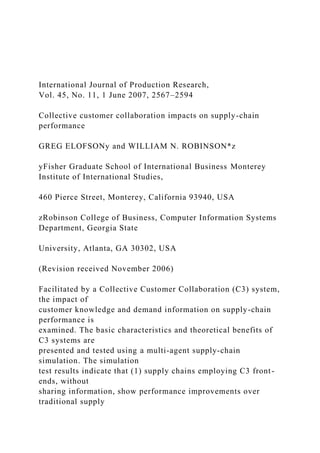
- 44. simulate the same events. 5. Experiments Here, we report the results of 63 simulations. To provide an understanding of how these simulations were generated, table 1 is presented. It can be used to compare the results relating the C3 system, information sharing, and lead time. Table 1. An empty result form for six simulations with a lead time of 12 hours. Lead time ¼ 12 hours C3 system Non-C3 system No sharing Some sharing Most sharing Supply-chain performance 2583 Table 1 illustrates an empty experiment report table for comparing the C3 system and the non-C3 system for three levels of information sharing, with a lead time of 12 hours. (The dependent variable values are not shown.) This table illustrates just one of a number of experiments run. We report on 63 simulation runs (2 C3 system � 3 sharing � 9 lead times). Figure 6 shows the results of the experiments. Lead times are
- 45. plotted along the x-axis, and the total supply-chain inventory costs are plotted along the y-axis. Each plotted point represents an experiment drawn from the combinations of C3 system � Sharing � Lead times. The lowest three lines plot three sharing levels over the nine lead times for a supply chain using the C3 system, while the upper three lines show the same for a non-C3 system supply chain. Figure 6 indicates that use of a C3 system reduces inventories substantially, and sharing reduces inventories, especially when the C3 system is unavailable. Lead times have little effect on inventories, except where lead time is 0 þ [0.0, 2.0]. A two-tailed paired t-test comparison between the C3 system and non-C3 system for no sharing, some sharing, and most sharing indicates p values of 7.026 � 10 �7 , 1.70 � 10 �8 , and 1.97 � 10 �8 , thus supporting the hypotheses that the C3 system makes a difference in the three levels of sharing across the lead times.
- 46. 6. Discussion Earlier, we posed three hypotheses to test. Here, we discuss how the simulation results illuminate the hypotheses. $- $100,000 $200,000 $300,000 $400,000 $500,000 $600,000 $700,000 0 4 8 12 16 20 24 28 32 Lead time (hr) In v e n to ri e
- 47. s C3, sharing most C3, sharing some C3, no sharing no C3, sharing most no C3, sharing some no C3, no sharing Figure 6. Inventory costs for the combinations of C3 system, information sharing, and lead times. 2584 G. Elofson and W. N. Robinson Table 2 summarizes the hypotheses analysis, which are computed from the simulation results summarized in the appendix. Each hypothesis is confirmed. 6.1 H1: using C3 system will decrease inventory holding costs Hypothesis H1 states that: H1: a supplier using a C3 system will have decreased inventory holding costs compared to a supplier with no C3 system. Table 3 reveals that the downstream C3 system-assisted node in the supply chain (C3 system M2) had lower inventory holding costs over the corresponding unassisted node (No C3 system M2). Over the full range of lead times, savings were incurred in keeping with assertion 3: a C3 system batching capability will likely lower inventory holding costs, and assertion 4: a C3 system’s increased information precision will likely
- 48. lower inventory holding costs. Thus, the addition of a C3 system to the downstream node in our supply chain resulted in savings for that node. Based on the work of Anand and Mendelson (1998), Kulp (2002) and Moinzadeh (2002), this is because the C3 system-assisted node has greater information precision in its orders as well as batched orders. Table 3 shows the comparison of the two approaches. Here, we note that the average inventory savings across all lead times (with no sharing) for M2 was $239,462. The percent savings over these averages was 79.1%. For the entire supply chain, we averaged the total inventory costs for both nodes M1 and M2, comparing the non-C3 supply chain with the C3 supply chain. Here, the overall supply chain derived savings of $602,046 using a C3 system, for an 89.3% savings. Moreover, these results indicate that the supply chain, on the whole, experienced savings in keeping with that reported in earlier work. Table 2. Summary of the hypotheses and simulation results. Hypothesis Simulation results H1: a supplier using C3 system will have decreased inventory-holding costs compared to a supplier with no C3 system
- 49. Confirmed: average savings of 89.3% H2: a set of two, autonomous suppliers in a supply chain, both sharing demand information from a C3 system, will have decreased inventory-holding costs when compared to a supply chain with only the downstream supplier using a C3 system Confirmed: average savings of 56.7% H3: a set of two, centrally controlled, suppliers in a supply chain, both sharing demand information from a C3 system, will have decreased inventory-holding costs when compared to a supply chain using decentralized control Confirmed: average savings of 15.3% Supply-chain performance 2585 T a b le 3 . A v er
- 60. 2586 G. Elofson and W. N. Robinson 6.2 H2: sharing C3 system data will decrease inventory holding costs Hypothesis H2 states that: H2: a set of two, autonomous suppliers in a supply chain, both sharing demand information from a C3 system, will have decreased inventory holding costs when compared to a supply chain with only the downstream supplier using a C3 system. Figure 6 illustrates that a supply chain with a C3 system and sharing demand information (second from bottom line in figure 6) does reduce overall inventory holding costs when compared to supply chain with just C3 and no demand sharing (third from bottom line in figure 6). For the full set of lead times, savings were incurred in keeping with assertion 1: as information sharing increases across a supply chain, inventory savings increase, as well as assertions 3 and 4. Considering the research of Chen (1998), Cachon and Fisher (2000), Lee et al. (2000) and Moinzadeh (2002), we expected savings up to 34.9% even without sharing C3 system information. In our simulation, providing upstream suppliers with C3 system data results in the demand information’s precision being
- 61. improved and not surprisingly, the savings improving as well. Table 4 summarizes the findings for this simulation. The supply chain using the C3 system with some shared information had an average inventory cost reduction of $41,033. The percent savings of the C3 system version over the non-C3 system was 56.7%. Also, when we consider the inventory savings of the downstream node when sharing versus not-sharing, we see that it is in the M2 node’s interest to share demand information with its M1 supplier (saving $35,860 over non- sharing supplier). 6.3 H3: sharing C3 system data and inventory data will decrease inventory holding costs more than sharing C3 system data alone Hypothesis H3 states that: H3: a set of two, centrally controlled, suppliers in a supply chain, both sharing demand information from a C3 system, will have decreased inventory holding costs when compared to a supply chain using decentralized control. Table 4. C3 system emphasizing some information sharing. C3 system sharing M1 M2 Total none $9,002 $63,312 $72,314
- 62. some $3,828 $27,453 $31,281 most $3,767 $22,736 $26,502 Difference none-some $5,174 $35,860 $41,033 some-most $61 $4,717 $4,778 none-most $5,235 $40,577 $45,812 Percentage none-some 57.5% 56.6% 56.7% some-most 1.6% 17.2% 15.3% none-most 58.2% 64.1% 63.4% Supply-chain performance 2587 Figure 6 illustrates that a supply chain with a C3 system and full sharing – demand information and inventory information – (bottom line in figure 6) does reduce overall inventory holding costs when compared to supply chain with C3 and demand sharing (second from bottom line in figure 6). For the full set of lead times, savings were incurred in keeping with assertion 2: centralized control shows greater overall supply-chain performance than decentralized control, and the performance differences will increase as delivery windows decrease. However, while the results of the simulation find in favour of the hypothesis, we
- 63. did not observe greater performance differences as the delivery window decreased. This may be because our simulation did not allow for the possibility of failing to fill an order because of delivery times being less than final stage MTO process (often a prelude to switching to a build-to-stock policy (Watson and Polito)). Table 5 summarizes the findings for this simulation. The supply chain using the C3 system with only some shared information had an average inventory cost of $41,033, while the supply chain sharing full information had an average inventory cost of $45,812. The percent savings of the full information sharing version over the C3 system with some information sharing was 15.3%. These results suggest that centralized control, when exercising the prerogative of sharing full information, benefits more from doing so than not. 7. Conclusions The limitations of this study are consistent with and characteristic of those found in
- 64. simulation studies in general: the researchers’ theoretical assumptions as well as the initializing values of the independent variables influence the outcomes of the experiments. To obviate this as much as possible, the simulations were benchmarked against existing analytical models and used previously validated simulation models. Notwithstanding these efforts, as with any abstraction, there is an omission of detail that would be encountered in an in situ empirical study. Table 5. C3 system emphasizing most information sharing. C3 system sharing M1 M2 Total none $9,002 $63,312 $72,314 some $3,828 $27,453 $31,281 most $3,767 $22,736 $26,502 Difference none-some $5,174 $35,860 $41,033 some-most $61 $4,717 $4,778 none-most $5,235 $40,577 $45,812 Percentage none-some 57.5% 56.6% 56.7% some-most 1.6% 17.2% 15.3% none-most 58.2% 64.1% 63.4%
- 65. 2588 G. Elofson and W. N. Robinson Overall, the simulations supported hypotheses 1, 2, and 3. The assertions regarding information precision, batch orders, information sharing, and centralized control offer, we believe, plausible rationales for these outcomes, especially given the body of research that formed the foundation of these assertions. Further, these outcomes are consistent with the theoretical predictions posited by Berger et al. (2005). Thus, a manufacturer employing a C3 system might reasonably expect to find inventory savings with its use. That same manufacturer might, with conditions permitting, also find even greater savings if it shares the C3 system data with its upstream supplier, and more so if it shares its inventory information with its upstream supplier. With this information, managers may be able to make sourcing decisions that best capitalize on their alternative, choosing
- 66. those partners that are, ceteris parabis, most suitable for sharing customer order and inventory information (given conditions such as regulations, etc., as mentioned earlier (Lee and Whang 2000)). The implications here are that, while the initial costs of a C3 system may be greater than traditional market research, the downstream savings may offset these costs. Further, desirable side effects might include: (1) increased customer switching costs, because of the knowledge and time the customers devote to the development of their product; and (2) improved production planning because of early customer commitment to purchase. Beyond our hypotheses, it should be noted that the C3 system- facilitated supply chains in our study always showed inventory savings over their non-C3 system comparables. Also, the data suggests that sharing demand information had a generally greater positive affect on inventory savings than sharing inventory
- 67. information, although both were positive even when taken together. A C3 system approach is not suitable for all products. A greater understanding of the parameters that govern the choice of using C3 should provide a rich opportunity for research. The many perspectives that may illuminate these questions range from relationship marketing, to human factors, to studies of trust, to group systems, as well as additional production questions. For example, are there design processes that have intermediate results which would allow for postponement strategies to be better employed? Also, can an automated interaction be created that gives customers feedback on the costs of their design while they are being investigated, creating cost scenarios with a what-if analysis as they work? Future research might also consider the costs of introducing and maintaining a C3 system. Then, a comparison of the C3 system costs against the savings obtained by the C3 system would further specify the
- 68. circumstances under which a C3 system will be advantageous. In conclusion, we have presented an IT system that uses customer knowledge and information to collaboratively create product designs, and discussed how this knowledge is managed forward in the production planning process. We have tested how the implementation of this IT system affects inventory saving via information sharing, large production runs, and more to help manufacturers think about supplier selection and partnership formation in supply chains. Finally, we illustrated how this knowledge sharing can be useful to the firm. Supply-chain performance 2589 A p p e n d ix A n a
- 88. 7 2 .6 % 7 5 .2 % 7 1 .5 % 7 3 .7 % 2590 G. Elofson and W. N. Robinson References Anand, K.S. and Mendelson, H., Information and organization for horizontal multi-market control. Manage. Sci., 1997, 43, 1609–1627. Anand, K.S. and Mendelson, H., Postponement and information in a supply chain. Discussion Papers (1222). Northwestern University, Center for Mathematical Studies in Economics and Management Science, 1998.
- 89. Aviv, Y., The effect of collaborative forecasting on supply chain performance. Manage. Sci., 2001, 47, 1326–1343. Berger, C., Möslein, K., Piller, F. and Reichwald, R., Co- designing modes of cooperation at the customer interface: learning from exploratory research. Eur. Manage. Rev., 2005, 2, 70. Bhaskaran, S., Simulation analysis of manufacturing supply chain. Decision. Sci., 1998, 29, 633–657. Boynton, A.C. and Victor, B., Beyond Flexibility: building and managing the dynamically stable organization. Calif. Manage. Rev., 1991, 3, 53–66. Cachon, G., Managing supply chain demand variability with scheduled ordering policies. Manage. Sci., 1999, 45, 843–856. Cachon, G.P. and Fisher, M., Supply chain management and the value of shared information. Manage. Sci., 2000, 46, 1032–1048. Chen, E., Echelon reorder points, installation reorder points, and the value of centralized demand information. Manage. Sci., 1998, 44, 221–234. Chen, F.G., Decentralized supply chains subject to information delays. Manage. Sci., 1999, 45, 1076–1090. Cheung, K.L. and Lee, H.L., The inventory benefit of shipment
- 90. coordination and stock rebalancing in a supply chain. Manage. Sci., 2002, 48, 300–306. Clements, P. and Northrop, L., Software Product Lines: Practices and Patterns, 2002 (Addison-Wesley: Boston, MA). Crecine, J.P., A Computer Simulation Model of Municipal Budgeting, 1969 (Rand McNally: Chicago, IL). Cvsa, V. and Gilbert, S.M., Strategic commitment versus postponement in a two-tier supply chain. Eur. J. Oper. Res., 2002, 141, 526. Cyert, R.M. and March, J.G., A Behavioral Theory of the Firm, 1963 (Prentice Hall: Englewood Cliff, NJ). Dang, J. and Huhns, M.N., Coalition Deal Negotiation for Services. , In Proceedings of the First International Workshop on Rational, Robust, and Secure Negotiations in Multi-Agent Systems (RRS’05), edited by Ito, T., Hattori, H., Matsuo, T. and Zhang, M., 2005, edited by Ito, T., Hattori, H., Matsuo, T. and Zhang, M., (IEEE Computer Society Press). De Meyer, A., Dutta, S. and Srivastava, S., The Bright Stuff: How Innovative People and Technology Can Make the Old Economy New, 2002 (Prentice- Hall: London). Elofson, G.S. and Robinson, W.N., Creating a custom mass- production channel on the
- 91. Internet. Commun. ACM, 1998, 41, 56–62. Fulkerson, B. and Staffend, G., Decentralized control in the customer focused enterprise. Ann. Oper. Res., 1997, 77, 325–333. Gascó-Hernández, M. and Torres-Coronas, T., Virtual teams and their search for creativity. In Virtual and Collaborative Teams, edited by S.H. Godar and S.P. Ferris, 2004 (Idea Group: Hershey, PA). Gibbert, M., Leibold, M. and Probst, G., Five styles of customer knowledge management, and how smart companies use them to create value. Eur. Manage. J., 2002, 20, 459–469. Heikkila, J., From supply to demand chain management: efficiency and customer satisfaction. J. Oper. Manage., 2002, 20, 747. Herlocker, J.L., Konstan, J.A., Terveen, L.G. and Riedl, J.T., Evaluating collaborative filtering recommender systems. ACM Trans. Inf. Syst., 2004, 22, 5–53. Supply-chain performance 2591 Homburg, C., Workman, J.P.J. and Jensen, O., Fundamental changes in marketing organization: the movement toward a customer-focused organizational structure. Acad. Mark. Sci. J., 2000, 28, 459.
- 92. Hyung Rim, C., Hyun Soo, K., Soon Goo, H., Young Jae, P., Young Sung, P. and Moo Hong, K., Implementation of Framework for Developing Multi- Agent Based Automated Negotiation Systems. In Proceedings of the 7th international conference on Electronic commerce, 2005, ACM Press, Xi’an, China, 2005. Jin Baek, K. and Segev, A., A framework for dynamic eBusiness negotiation processes. IEEE International Conference on E-Commerce, IEEE, 2003. Kaihara, T., Supply chain management with market economics. Int. J. Prod. Econ., 2001, 73, 5–14. Khalid, H.M. and Helander, M.G., Web-based do-it-yourself product design. In The Customer Centric Enterprise: Advances in Mass Customization and Personalization, edited by M. Tseng and F. Piller, 2003 (Springer: New York, Berlin). Kouvelis, P. and Gutierrez, G.J., The newsvendor problem in a global market: optimal centralized and decentralized control policies for a two-market stochastic inventory system. Manage. Sci., 1997, 43, 571–585. Kulp, S., The effect of information precision and information reliability on manufacturer- retailer relationships. Account. Rev., 2002, 77, 653–677. Lant, T.K. and Mezias, S.J., Managing discontinuous change: a simulation study of
- 93. organizational learning and entrepreneurship. Strategic Manage. J., 1990, 11, 147–179. Law, A.M. and Kelton, W.D., Simulation Modeling and Analysis, 2000 (McGraw Hill: New York). Lee, H. and Billington, C., Material management in decentralized supply chains. Manage. Sci., 1993, 42, 835–847. Lee, H., So, K. and Cs, T., The value of information sharing in a two-level supply chain. Manage. Sci., 2000, 46, 626–643. Lee, H. and Whang, S., Decentralized multi-echelon supply chains: incentives and information. Manage. Sci., 1999, 45, 633–640. Lee, H.L., Effective inventory and service management through product and process redesign. Oper. Res., 1996, 44, 151–159. Lee, H.L. and Whang, S., Information sharing in a supply chain. Int. J. Manuf. Tech. Manage., 2000, 1, 79. Levinthal, D.A. and March, J.G., A model of adaptive organizational search. In Decisions and Organizations, edited by J.G. March, 1988 (Basil Blackwell: New York). Mccutcheon, D.M., Amitabh, S. and Meredith, J.R., The customization-responsiveness squeeze. Sloan. Manage. Rev., 1994, Winter, 89–99.
- 94. Milgrom, P. and Roberts, J., The economics of modern manufacturing technology, strategy, and organization. Am. Econ. Rev., 1990, 80, 511–528. Minar, N., Burkhart, R., Langton, C. and Askenazi., M., The swarm simulation system: a toolkit for building multi-agent simulations, Santa Fe Institute, 1996. Missbauer, H., Aggregate order release planning for time varying demand. Int. J. Prod. Res., 2002, 40, 699–718. Moinzadeh, K., A multi-echelon inventory system with information exchange. Manage. Sci., 2002, 48, 414–426. Nelson, R.R. and Winter, S.G., An Evolutionary Theory of Economic Change, 1982 (Belknap Press: Boston, MA). Nemiro, J.E., Connection in creative virtual teams. J. Behav. App. Manage., 2001, 3, 92–112. Ogawa, S. and Piller, F., Reducing the risks of new product development. Sloan. Manage. Rev., 2006, 47, 65–72. Persson, F. and Hagger, J., Performance simulations of supply chain designs. Int. J. Prod. Res., 2002, 77, 231–245. Pillar, F.T., Moeslein, K. and Stotko, C.M., Does mass- customization pay? An economic approach to evaluate customer integration. Prod. Plan. Cont., 2004, 15, 435–444.
- 95. Piller, F., Schubert, P., Koch, M. and Möslein, K., Overcoming mass confusion: collaborative customer co-design in online communities. J. Comput. Med. Commun., 2005, 10, article 8. 2592 G. Elofson and W. N. Robinson Piller, F.T., Moeslein, K. and Stotko, C.M., Does mass- customization pay? An economic approach to evaluate customer integration. Prod. Plan. Control., 2004, 15, 435–444. Pine II, B.J. II, Peppers, D. and Rogers, M., Do you want to keep your customers forever? Harvard Bus. Rev., 1995, 73, 103–114. Pine, J.B., Mass customization: The new frontier in business competition, 1993 (Harvard Business School Press: Cambride Mass). Pohl, K., Böckle, G. and Linden, F.J.V.D., Software Product Line Engineering: Foundations, Principles and Techniques, 2005 (Springer: Berlin). Prahalad, C.K. and Ramaswamy, V., The Future of Competition: Co-Creating Unique Value with Customers, 2004 (Harvard Business School Press: Boston, MA). Qi-Ming, H., Jewkes, E.M. and Buzacott, J., The value of information used in inventory control of a make-to-order inventory-production system. IIE
- 96. Trans., 2002, 34, 999. Raghunathan, S., Information sharing in a supply chain: a note on its value when demand is nonstationary. Manage. Sci., 2001, 47, 605–610. Ramirez, R., Value co-production: intellectual origins and implications for practice and research. Strategic. Manage. J., 1999, 20, 49. Resnick, P. and Varian, H.R., Special issue on recommender systems. Commun. ACM, 1997, 40. Robinson, W.N. and Elofson, G., Electronic Broker Impacts on the Value of Postponement, in Hawaii. Proceedings of the 33rd Annual Hawaii International Conference on System Sciences, IEEE, 2000. Robinson, W.N. and Elofson, G., Electronic broker impacts on the value of postponement in a global supply chain. J. Global Inform. Manage., 2001, 9, 29– 43. Robinson, W.N. and Volkov, S., Supporting the negotiation life- cycle. ACM, Commun. ACM, 1998, 41, 95–102. Rowley, J., Eight questions for customer knowledge management in e-business. J. Know. Manage., 2002, 6, 500–511. Salvador, F., Rungtusanatham, M. and Forza, C., Supply chain configurations for mass customization. Prod. Plan. Cont., 2002, 15, 381–397.
- 97. Sawhney, M. and Prandelli, E., Communities of creation: managing distributed innovation in turbulent markets. Calif. Manage. Rev., 2000, 42, 24. Schubert, P., The participatory electronic product catalog: supporting customer collaboration in e-commerce applications. Electron. Mark. J., 2000, 10, 229– 236. Seybold, P.B., Marshak, R. and Lewis, J., The Customer Revolution: How to Thrive When Customers Are in Control, 2001 (Crown Business: New York). Sheth, J.N., Sisodia, R.S. and Sharma, A., The antecedents and consequences of customer- centric marketing. Acad. Mark. Sci. J., 2000, 28, 55. Strader, T.J., Lin, F.-R. and Shaw, M.J., Simulation of order fulfilment in divergent assembly supply chains. J. Artif. Soc. Soc. Simul., 1998, 1. Strader, T.J., Lin, F.-R. and Shaw, M.J., The impact of information sharing on order fulfilment in divergent differentiation supply chain. J. Global Inform. Manag., 1999, 7, 16–25. Su, S.Y.W., Huang, C., Hammer, J., Huang, Y., Li, H., Wang, L., Liu, Y., Pluempitiwiriyawej, C., Lee, M. and Lam, H., An Internet-based negotiation server for e-commerce. VLDB J., 2001, 10, 72–90. Thomke, S. and von Hippel, E., Customers as innovators: a new way to create value. Harvard Bus. Rev., 2002, 80, 74–81.
- 98. Thonemann, U.W., Improving supply-chain performance by sharing advance demand information. Eur. J. Oper. Res., 2002, 142, 81–107. von Hippel, E., Economics of product development by users: the impact of ‘‘sticky’’ local information. Manage. Sci., 1998, 44, 629. von Hippel, E. and Tyre, M.J., How learning is done: problem identification in novel process equipment. Res. Pol., 1995, 24, 1. Watson, K. and and Polito, T., Comparison of DRP and TOC financial performance within a multi-product, multi-echelon physical distribution environment. Int. J. Prod. Res., 1995, 41, 741–765. Westbrook, R. and Williamson, P.J., Mass customization: Japan’s new frontier. Eur. Manage. J., 1995, 11, 38–45. Supply-chain performance 2593 Whicker, M.L. and Seligman, L., Computer Simulation Application: An Introduction, 1991 (Sage Press: Newberry Park, CA). Wikström, S., Value creation by company-consumer interaction. J. Mark. Manage., 1996, 12, 359–374. Zhao, X., Jx, X. and Leung, J., The impact of forecasting model
- 99. selection on the value of information sharing in a supply chain. Eur. J. Oper. Res., 2002, 142, 321–344. 2594 G. Elofson and W. N. Robinson J Intell Manuf (2012) 23:1083–1101 DOI 10.1007/s10845-010-0430-3 Impact of information sharing in hierarchical decision-making framework in manufacturing supply chains Nurcin Celik · Sai Srinivas Nageshwaraniyer · Young-Jun Son Received: 14 November 2009 / Accepted: 25 June 2010 / Published online: 22 July 2010 © Springer Science+Business Media, LLC 2010 Abstract This paper presents a comprehensive framework for the analysis of the impact of information sharing in hier- archical decision-making in manufacturing supply chains. In this framework, the process plan selection and real-time resource allocation problems are formulated as hierarchical optimization problems, where problems at each level in the hierarchy are solved by separate multi-objective genetic algo- rithms. The considered multi-objective genetic algorithms generate near optimal solutions for NP-hard problems with less computational complexity. In this work, a four-level hier- archical decision structure is considered, where the decision levels are defined as enterprise level, shop level, cell level,
- 100. and equipment level. Using this framework, the sources of information affecting the achievement of best possible deci- sions are then identified at each of these levels, and the extent of their effects from sharing them are analyzed in terms of the axis, degree and the content of information. The generality and validity of the proposed approach have been successfully tested for diverse manufacturing systems generated from a designed experiment. Keywords Multi-objective optimization · Supply chain · Information sharing · Shop floor control · Hierarchical decision-making Introduction In today’s global and competitive market circumstances, hav- ing an efficient supply chain has become more significant N. Celik · S. S. Nageshwaraniyer · Y.-J. Son (B) Systems and Industrial Engineering, The University of Arizona, Tucson, AZ 85721, USA e-mail: [email protected] than ever. Many industries in various sectors have launched initiatives to enhance the efficacy of their supply chain man- agement, and massive amounts of savings were achieved as a result of such pioneering works. For example, Kurt Salmon Associates Inc. (1993) has estimated that potential savings can add up to around $30 billion per year for the gro- cery industry. For the healthcare industry, Computer Science Corp. (1996) estimated that savings would be about $11 bil- lion per year (48% of the process costs) when the informa- tion is helped flow in the right direction at right time in the supply chain. Later, according to Premier Alliance (2004), “The Supply Chain Collaborative Breakthrough Series” initiative, which is established by members of Premier Inc. (an alliance of 1,500 hospitals and health systems), saved
- 101. more than $46 million over a 3 year period by enabling the sharing of the data among various echeclons of the sup- ply chains. Procter & Gamble (manufacturer) and Wal-mart (retailer) have disclosed their new supply chain integration initiative with an aggressive goal of sharing information via their channel partnership. The partnership started with a sim- ple desire to improve business relationships, and was gradu- ally enhanced by sharing information and knowledge about their respective markets. This sharing in turn enabled more effective execution of such concepts as category manage- ment, continuous replenishment, and process coordination, which collectively helped make the supply chain more effi- cient (Grean and Shaw 2002; Siems 2005). The mutual bene- fits that Procter & Gamble and Wal-mart obtained out of this initiative reached more than billion dollars. While many other instances of such initiatives as the ones mentioned above exist in the industry and related research works are available in the literature on informa- tion sharing in the supply chain (Legner and Schemm 2008; Chen et al. 2007), their focuses are mostly on the shar- ing of demand information between various echelons in an 123 1084 J Intell Manuf (2012) 23:1083–1101 aggregated manner (especially between retailers and their upstream suppliers). Furthermore, most of these studies lack the ability to quantify the magnitudes of benefits although the said benefits have been the center point for their discussions. In order to understand the actual benefits of the information sharing within a supply chain, the effect of this sharing should be analyzed in conjunction with a particular control system
- 102. (e.g. hierarchical structure, heterarchical structure, or hybrid structure) governing the supply chain. In this paper, we pres- ent a coherent and comprehensive framework for analyzing the impact of information sharing in and across various deci- sion levels (e.g. enterprise level, shop level, cell level, and equipment level) of the hierarchical, supply chain control sys- tems. In particular, we consider a two-echelon supply chain, where the hierarchical process plan selection from a set of alternatives and real-time resource allocation are considered. In this work, the primitive process plan for each level of deci- sion is assumed to be available when a part production order is submitted. These primitive process plans contain a com- plete set of possible production alternatives including the ones affected by the shop, cell, machine, and tool selections. When the manufacturing system starts to operate, succinct decisions have to be made on these primitive process plans to determine which processes will be performed in which sequence. First, the final serialized process plan is derived from the primitive process plan considering the system sta- tus. The making of these decisions is called the “linearization of process plans”. Then, resource-allocated process plans are generated by assigning the most appropriate resources (i.e., shops, cells, machines and tools) to these linearized process plans and sent out to the manufacturing system to be executed. Our particular objective in this study is three-fold. The first objective is to refine a four-level hierarchical decision- making framework to be used for the linearization of process plans and real-time resource allocation in a supply chain sys- tem, where the four levels are enterprise level, shop level, cell level, and equipment level. The sources of information affecting each decision level in the hierarchy are then iden- tified in each of these levels. This four-level hierarchical framework is constructed as a mechanism to enable opti- mal or near optimal decision-making within the considered
- 103. supply chain. This optimal decision-making is enabled via the multi-objective genetic algorithm, which is embedded into our four-level hierarchical decision-making framework mentioned above. The second objective is to develop a novel approach to investigate various roles of information sharing in manu- facturing supply chains in a quantitative manner using a test-bed developed in this work in conjunction with intelli- gent decision-making algorithms. This investigation aims to determine the magnitude of the impact of sharing of informa- tion on linearization of process plans and real-time resource allocation, where the overall goal is to increase efficiency by decreasing the total cost of production and lead-time to enhance its re-configurability. This is a unique study, which allows us to simultaneously manage near optimal decision- making via the considered four-level hierarchical decision framework, operations based on the generated (linearized) process plans and resource allocations, and automatic feed- back that is used to check systems performance based on these decisions. Given updated system status and require- ments, the linearization and resource allocation of the process plans will be regenerated if the values are beyond the allowed threshold range, while specifically balancing the benefits of such updates against the cost of schedule disruption. While illustrated from the perspective of a single facility, the pro- posed approach will permit modeling of large supply chain instances with external suppliers and multistage fabrication- assembly systems. To this end, the critical aspects of the information to be shared when developing models to help decision-making in supply chain systems are analyzed in detail. These critical aspects are classified in three main categories, including (1) the axis of shared information, (2) the degree of shared infor-
- 104. mation, and (3) the content of shared information. The axis of shared information can be either vertical, where the informa- tion is shared among various hierarchical levels (i.e., cells) within a single echelon (i.e., manufacturing facility) or hori- zontal, where the information is shared across multiple ech- elons of the supply chain (see Fig. 1). The content of shared information refers to the actual information that is shared between various members of supply chain and customers, and can be defined both for vertical or horizontal axises. The degree of information shared can be divided into three aggre- gated levels for both axises: no information sharing, partial information sharing, and full information sharing. In the case of information sharing via the horizontal axis, no informa- tion sharing defines the situation where the supplier only has information on the orders received from the manufacturer and must utilize historical data to augment the order information when preparing demand forecasts. With partial information Fig. 1 Information sharing among supply chain members 123 J Intell Manuf (2012) 23:1083–1101 1085 sharing, the demand distribution faced by the retailer and the retailer’s inventory policy are known. Finally, with full information sharing, the supplier also receives instantaneous information on the retailer’s demand. In the case of infor- mation sharing via the vertical axis, no information sharing defines the situation where only shop-level aggregated infor- mation is known and the operations planning framework has no detailed information regarding various cells of a shop floor or specific machines within these cells. In this case, strategies can only be determined at the strategic level in a
- 105. highly aggregated manner. With partial information sharing, the cell level information is known and shared within the same shop floor. Hence, the planning can be performed at the tactical level. Lastly, with full information sharing, all the information generated from the smallest element of the shop floor, which is considered as machine in this study, is known and shared among other decision levels. Therefore, accurate predictions as well as the decision tasks can be generated for the operational level within this echelon of the supply chain. The accuracy of the information that is shared in differ- ent dimensions mentioned above (i.e., capacity of machines employed in the manufacturing process, shop floor layouts, and maximum safety stock of the average on hand inven- tory) is essential in generating feasible decisions in supply chain systems. Distortion of this information could lead to congestion and problems such as excessive work-in-process inventory, back order costs, and increase in cycle time. The consequences arising from faults at the shop floor level may have detrimental effects on the performance of entire sup- ply chain organization. Therefore, the impact of distortion of information during the hierarchical decision-making has also been studied, and solutions to mitigate the losses arising from lack of or inaccuracy in information sharing have been discussed in this research. The third objective is to develop an accurate representa- tion of a manufacturing supply chain involving a production facility and a retailer facility as a simulated test-bed, where realistic manufacturing scenarios can be mimicked to investi- gate alternative “what-if” scenarios. These what-if scenarios entail different shop, cell, and equipment configurations. This test-bed is built in a great detail to allow for tracking even very small structural changes (e.g. tool conditions, remain- ing processing time at a machine) within the system and how
- 106. sharing of different information would affect the system per- formance in a greater scale. The remainder of this paper is organized as follows. Section “Background and Literature Survey” summarizes a background and literature survey related to this study. Section “Proposed Approach for the Impact Analysis of Informa- tion Sharing” gives an overview of the proposed approach for the impact analysis of information sharing. Section “Considered Manufacturing Supply Chain” presents the details of the manufacturing supply chain system considered in this work. In Section “Mathematical Formulation of the Problem”, we first describe a generic mathematical formula- tion of the linearization of process plans and resource allo- cation problem for each level of the production system and then explore ways of employing various parameters incor- porating shop level, cell level and equipment level informa- tion into this mathematical formulation. Section “Details of the Multi-Objective Genetic Algorithm” explains the pro- posed four level hierarchical decision-making framework and its near optimal decision capability using multi-objective genetic algorithm. Section “Experiment and Results” sum- marizes the designed experiments together with the results obtained from our case study. Lastly, in Section “Conclusion and Future Work”, the conclusions are drawn and the future aspects of this study are discussed. Background and literature survey Information sharing in supply chain systems When information is shared in inter-organizational networks, it can result in a more efficient flow of goods and services, reduced inventory level, and lower costs, which benefits the overall network (Venkateswaran and Son 2004). Information
- 107. sharing has also been found to reduce the bullwhip effect (order variability) and to add value to the chain (Chen et al., 2000; Lee et al. 1997). For example, Wal-Mart shares point-of-sale information with their suppliers and transmits orders electronically to the relevant supplier when inventory for an item falls to a predetermined minimum level of stock (Lancioni et al., 2000). This inter-organizational information sharing reduces carrying costs of inventory, facilitates quick response for inventory replenishment, and allows suppliers to better plan their production schedules, and reduces lead times (Stevenson, 1994; Baganha and Cohen 1998; Sherali et al. 2008). While benefits of inter-organizational information shar- ing has been widely studied (Chen et al. 1998; Lee et al. 2000), it is difficult for firms to reap these benefits unless they have a better grasp of the antecedents of inter-organi- zational information sharing that influence its effectiveness. This is an area in which firms need guidance so that they can effectively channel resources to their knowledge and infor- mation sharing activities. The ability of managers to coordi- nate the complex network of business relationships that exist between parties involved in the supply network is critical to the success of a firm (Lambert and Cooper, 2000). The network patterns, which can have one or more stages, create varying levels of complexity, and hence differing envi- ronments for information sharing. Further, location of the firm(s) within a network creates different information needs 123 1086 J Intell Manuf (2012) 23:1083–1101
- 108. and consequences due to the distortion in the flow of informa- tion. Managing the flow of information effectively requires close attention to the coordination mechanism established among the member firms in a network. The degree of coor- dination is likely to affect the nature and amount of informa- tion that is shared across the network. Similarly, the degree to which the partner firms perceive a match in their goals may impact the nature and amount of information they are willing to share with each other (Samaddar et al., 2006). Lee et al. (1997) explain the importance of mitigation of detrimental impact of distortion of information in the form of inbound orders, from downstream members to upstream members, in a supply chain. They consider a series of compa- nies in a supply chain, and each of the companies orders from its immediate upstream member. They claim that the distor- tion is amplified in the upstream direction of the supply chain as a demonstrative of the “bull whip” effect. They analyzed demand signal processing, rationing game, order batching, and price variations as four sources of the “bull whip” effect. In particular, there is an amplification and larger variance in the distortion of information from downstream to upstream members. Sterman (1989) attributes the increase in amplifi- cation and variance of information distortion to several “mis- perceptions of feedback”. As mentioned earlier, a great percentage of the literature examines the impact of information sharing in the supply chain in a highly aggregated manner without considering the possibility that the organizations may benefit much from the information sharing in a detailed level. However, shar- ing of information horizontally among the partners of sup- ply chain (i.e., demand, work-in-process levels, replenish- ment time and amount) and then sharing the elements of this information vertically within a production facility (using hierarchical decision-making process proposed in this work)
- 109. may help organizations work in their highest efficiency. Sim- ilarly, sharing of data originated from the production floor (i.e., cell, and equipment related data) with various members of the facility may enhance the productivity and efficiency level leading to minimized lead times, work-in-process, cost and therefore, maximized profit. In this work, we intend to develop a coherent and comprehensive framework for ana- lyzing the impact of information sharing among various deci- sion levels of manufacturing supply chains. Hierarchical decision-making In a hierarchical decision-making system, the commands typ- ically flow from top to down, and feedback information flow from bottom to up, and the relationships among the modules are limited to master-slave relationships between parent and child nodes in a tree shaped hierarchy (Bongaerts et al. 2000). One common decision area considered in the literature within this natural hierarchy is process planning. Process planning is the task of planning the various processes or operations to be made on raw materials to transform it into the desired part. The output of this task is a plan that contains the routes, pro- cesses, process parameters, machines, tools and set-ups to be used for manufacturing parts (Ma et al. 2000; Nau and Chang 1983). While computer aided hierarchical process planning has advanced significantly in its duty of creating the prim- itive process plans with alternatives, human intervention is still needed as decision mechanisms to finalize process plans by serializing the process plans after considering alternate sequences of the operation to be performed, and then allo- cate the resources based on this final process plan. These decisions are quite important as they are essential for pro- duction and determine the efficiency of production (Joshi et al. 1986). Other approaches (Dilts et al. 1991) have used the hierarchical decision-making architectures to operational
- 110. decisions via off-line schedulers at different levels of the hier- archy. In these approaches, when a disturbance occurs, it is fed back to the appropriate level in the hierarchy (e.g., the cell scheduler), and only after the schedule has been adapted, the new schedule triggers a new flow of commands that forms the reaction to the disturbance. The resulting response time is low leading to a low robustness (Bongaerts et al. 2000). In this study, we propose a multi-objective genetic algo- rithmic approach to be used as a decision aid for hierarchical linearization of process plans and real-time (on-line) resource allocation inside a production facility of a two-echelon sup- ply chain and help analyze the effect of information shar- ing in manufacturing systems. Real-time resource allocation decisions at each level determine which resources will be utilized for the production. For instance, our considered pro- duction facility comprises two shop floors, each divided into cell areas that are comprised of machines and tools. Here, our resource allocation decisions take into consideration the resource availabilities (e.g., shops, cells, machines and tools) as well as the part routing through these resources. Follow- ing the assignment of jobs to a specific cell at an aggregated level, the machines are allocated to specific operations within these jobs based on the processing cost and times of these operations in a more detailed level. This hierarchical nature of allocating resources at a lower level after allocating resources at a higher level applies to all levels of decision-making. Meta-heuristics Process plans that are selected without considering the resource availability (which is imminent in the operation plan of the whole production unit) tend to violate feasibility con- straints and lead to losses. Efforts to find the optimal or near optimal solution for this problem have been spent mainly on two different approaches. In the first approach, the linear-
- 111. ization of process plans (selection) and resource allocation problems are combined and formulated as a single problem 123 J Intell Manuf (2012) 23:1083–1101 1087 (Moon et al. 2002; Yan et al. 2003). The second approach is comprised of two steps, where the first step (Aldakhilallah and Ramesh 1999; Sormaz and Khoshnevis 2003) involves the generation of numerous process plans that achieve the predetermined level of performance criteria in the process- planning problem. Then, in the second step, optimization of the scheduling problem is performed with respect to each of the alternate process plans generated above, where each imposes different feasibility constraints. The search space for the combined linearization of pro- cess plans (selection) and resource allocation problems is exhaustive, which makes it difficult for deterministic opti- mization methods like integer programming or mixed inte- ger programming to arrive at an optimal solution. The said search space grows even bigger and makes the problem even harsher to resolve when the problem is formulated in detail for large-scale complex systems such as the considered sup- ply chain system in this research. In order to address these challenges, another type of approaches have emerged through the use of meta-heuristics. Meta-heuristics including genetic algorithms (GA) (Moon and Seo 2005), simulation anneal- ing (SA) (Cai et al. 2009), particle swarm optimizations (PSO) (Guo et al. 2009), and Tabu search (Brandimarte and Calderni, 1995) have been employed to obtain solutions to problems which belong to the class of integrated process planning and scheduling (IPPS). GA, evolutionary algorithm
- 112. (Li et al. 2009), and symbiotic algorithm (Kim et al. 2003) have all been quite successful in obtaining near optimal solu- tions to variants of IPPS problems. The concept of reaching the optimal solution by a way of evolutionary synthesis of the pool of candidate solutions is common to GA, symbiotic, and evolutionary algorithms. In this study, we have designed a multi-objective genetic algorithm in order to take advan- tage of the method of reaching a near optimal solution via evolution in reasonable short time. Proposed approach for the impact analysis of information sharing Figure 2 depicts a hierarchical decision-making framework considered in this research, in which we intend to quantita- tively analyze the impact of information sharing in manufac- turing supply chains. The framework consists of enterprise, shop, cell and equipment levels. There exists a controller (including monitoring, decision-making and execution mod- ules) at each level, where its decision-maker could be based on a separate multi-objective genetic algorithm depending of the complexity of its decisions. Each controller is associ- ated with one resource at the same level, and interacts with the controllers at their immediate lower levels. These inter- actions include (1) the information shared about the status of resources at a lower level by controllers at that level, (2) the decisions to lower level controllers from higher level controllers, and (3) the feedback information on the perfor- mance of resources at a lower level. After process plan lin- earization and real-time resource allocations are received at the system monitor, they are processed by the decision-mak- ers, and the resulting decisions to the lower level controllers are communicated via the executor. We assume that there is no direct interaction between any two controllers, other than those at successive levels, for the ease of analysis of