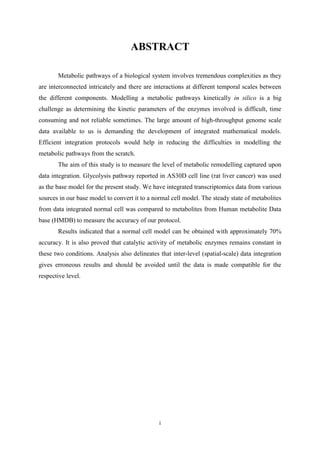
Tushar Singh Soam submitted a project report on systematically evaluating methods for integrating transcriptome data into kinetic models of metabolic pathways. The report describes:
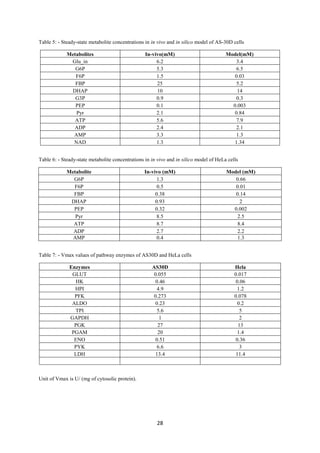
1) Using a cancer glycolysis model as a base model to integrate transcriptomics data and evaluate the methodology. Comparing in vivo and in silico steady states showed the model predicted metabolite concentrations with over 80% accuracy.
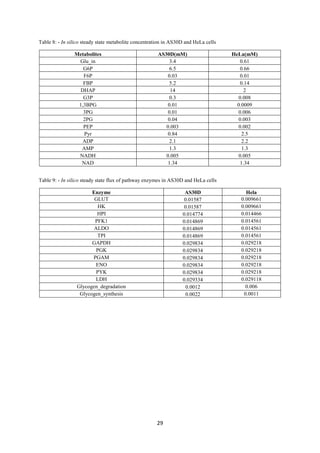
2) Integrating gene expression data from various sources transformed the cancer model into one representing a normal cell, and comparing metabolite levels to a human database achieved 70% accuracy.
3) Analysis found inter-level data integration can provide erroneous results and should be avoided until data are compatible at the respective level. The project evaluated approaches


![1
Introduction
Cancer cells grow and divide at an unregulated pace and thus to meet the increased
nutritional demands, cells alter their metabolism to a very large degree as is defined by
“Warburg effect” according to this phenomena cancer cells will meet their increased demand
of energy by accentuated rates of glycolysis even when there is enough oxygen present to
respire [1]. Since, there are significant changes between normal and a cancer cell’s
glycolysis, it can be used as a system to evaluate the method of data integration. Also, there is
lot of data reported in literature regarding the pathway dynamics of glycolysis in cancer
condition.
Hence, we are using glycolysis as a model system to evaluate method of
transcriptome data integration into mathematical model. In this work, the glycolysis cancer
model will be used as the base model and further transcriptome data would be integrated with
it to evaluate methodology. The significant changes found in the two conditions can also be
utilised to propose biomarkers which can be used as therapeutic targets, however this aspect
is our principal goal for the present study.
Metabolic Reprogramming: -
Cancerous cell, in general, shows an increment in the glycolytic flux irrespective of the cell
type. This accelerated glycolysis rate is due to the over-expression of pathway enzymes,
which again is induced by some oncogenes and other hypoxia inducible factors (affects
cellular response to systemic oxygen levels) [1]. Production of different isoforms and
overexpression of certain pathway enzymes leads to the change in control distribution of
tumor glycolysis from that of normal cell glycolysis. However, change in catalytic activity
can also happen in this case, but there are no significant mutations found for glycolytic
enzymes in literature [2]. According to [3] and [4], HK and PFK are the major controlling
steps in normal cell while in tumor cells control gets shifted to HK and HPI with a lot of
control around HK (may be a different isoform). It is reported that to reduce glycolytic flux
by 50% in a tumor cell we have to reduce the activity of HK by 76%. Flux control
coefficients of pathway enzymes gives us an idea about those enzymes which differ in tumor
and normal cells and thus can be accounted as therapeutic targets for tumor disease.](https://image.slidesharecdn.com/f3f0369b-c4ca-46e9-b5d3-988607a10813-160615062302/85/Intern-Report-7-320.jpg)
![2
Kinetic modelling of a metabolic pathway takes into account all the available
information (e.g. enzyme parameters, metabolic concentrations and fluxes) to mimic the
behaviour of the intracellular environment which can be used to predict the metabolic
concentrations and flux at different steady states [1]. If this approach is extended to the
cancer cell, it will be very useful in identifying the therapeutic targets in a tumor cell.
Since, information regarding kinetics of most of enzymes from cancer cells are not
available, it is prerequisite to develop a method which can linearly integrate data available
for normal cells and omics data for cancer cells to reconstruct cancer-specific kinetic
model. This integrated kinetic model can be further explored to understand metabolic
reprogramming as well as for drug target identification.
Kinetic Modelling of Metabolic Pathways: -
The elucidation, understanding, and eventually prediction of the behaviour of metabolic
systems represent a big challenge [5]. Cellular metabolic pathways constitutes a complex
dynamical system and gives rise to a wide variety of dynamical phenomena, including
multiple steady states and temporal oscillations.
Models are made out from composition of concepts to have a more clear
understanding and simulate the subject the model represents. Reactions occurring among a
defined set of reactants defines a kinetic reaction network. To model the time evolution of
metabolite’s concentration and flux of individual steps, we use reaction rate equations present
among the individual species of the pathway. For modelling the kinetics of a metabolic
pathway, we need to have precise knowledge of functional form of all involved enzymatic
reactions and their associated parameters. For the relevant kinetic data of all the enzymes
present in the pathway we rely mostly on the data reported in the literature previously and use
Michaelis-Menten kinetics for all the enzymes, which is considered a good approximation
for most enzymes’ reaction rates. Once the model is established it can serve as a virtual
laboratory that allows building up of characteristics description of the system and give
insights into the design principles of the same [6], [7]. MCA is the systems level approach to
analyse metabolism quantitatively. The central concept in MCA is of control coefficients
which are a quantitative measurement of the extent to which the activity of a single enzyme
determines the pathway flux [8].](https://image.slidesharecdn.com/f3f0369b-c4ca-46e9-b5d3-988607a10813-160615062302/85/Intern-Report-8-320.jpg)
![3
Databases and Software
1. ArrayExpress: - It is a database of functional genomics data, generated from
microarray and high-throughput sequencing experiments. We have used it for the
determination of differentially expressed genes in a tumor and normal cell [9].
2. GeneCards: - GeneCards is a searchable, integrated database of human genes that
provides comprehensive, updated, and user-friendly information on all known and
predicted human genes. We used it for knowing the EC number and Entrez gene
number for different isoforms of enzymes involved in glycolysis pathway [10].
3. GEO: - GEO is another high-throughput public functional genomics data repository
[11].
4. BioModels: - It is a repository of computational models of biological processes.
Models collected from literature are manually curated and enriched with cross-
references from external data sources. All models are available freely for use,
modification and distribution, to all users [12].
5. BRENDA: - It is an enzyme information system representing one of the most
comprehensive enzyme repositories. We have used it to determine which isoform of an
enzyme is involved in the pathway by comparing the Km values from the literature
[13].
6. Gepasi: - Gepasi is a software package for modelling biochemical systems. It
simulates the kinetics of systems of biochemical reactions and provides a number of
tools to fit models to data, optimize any function of the model, perform metabolic
control analysis and linear stability analysis. We have used it to convert the .gps to
.xml format because the cell designer supports only .xml format [14].
7. CellDesigner: - CellDesigner is a structured diagram editor for drawing gene-
regulatory and biochemical networks. We have used it to modify our basic model
[Alvaro et al.] by updating the enzyme parameters determined from omics data
integration, simulate and view the dynamics of modified model through an intuitive
graphical interface [15].
8. Liverome: - It is a curated database of liver cancer-related gene signatures. The gene
signatures were obtained mostly from published microarray and proteomic studies, and
thoroughly curated by experts. We have used this database to confirm the accuracy of
meta-analysis data obtained from other databases [16].](https://image.slidesharecdn.com/f3f0369b-c4ca-46e9-b5d3-988607a10813-160615062302/85/Intern-Report-9-320.jpg)
![4
Cancer Glycolysis Model
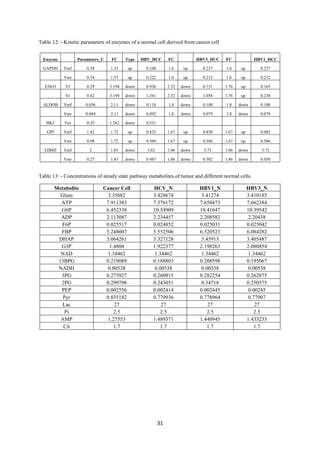
We have used Alvaro et al. [3] cancer model as our basic model and following is the
representation of the pathway considered in the model,
Fig 1: Schematic diagram of glycolysis model in cancer cell. Blue colour represents main metabolites of the
pathway; Brown colour represents the metabolite interacting with glycolysis pathway; Red colour denotes
inhibitors and green colour represent activators of pathway. Enzyme are shown in light brown colour.
Assumptions: -
1. All reactions are considered reversible.
2. Specific activity of enzymes is taken as the measure of maximum velocity of reaction.
3. Those metabolites for which the either source or sink is not present inside the
boundary of pathway are taken as constant ( e.g. Lactate, Citrate, Ery4p, glycogen, Pi,
Xy5p, F26BP)
Model was constructed by using Gepasi v3.3 software by Alvaro et al.](https://image.slidesharecdn.com/f3f0369b-c4ca-46e9-b5d3-988607a10813-160615062302/85/Intern-Report-10-320.jpg)
![9
Section 2
Gene Expression Data Integration
A. Gene Expression Data integration from ArrayExpress
Objective: -
Gene-expression data from ArrayExpress was integrated into cancer cell (AS30D) glycolysis
model from Alvaro et al. [3] to generate a normal cell model and further this integrated model
was explored for normal glycolysis.
Method: -
We know that,
Vmax = Kcat*Et
Where, Kcat = turnover number of the enzyme
Et = Concentration of enzyme catalytic sites
For a cancer cell,
(Vmax)c = Kcat*(Et)c
Similarly, for a normal cell,
(Vmax)n= Kcat*(Et)n
Where, subscript ‘n’ demotes normal cell and ‘c’ denotes cancer cell.
So,
Vc/Vn= (Et)c/(Et)n
Where, Vc denotes (Vmax)c and same for normal cell parameter.
(Et)c/(Et)n can be defined as fold change, denoted by FC.
Hence,
Vc/Vn = FC
Where, we are assuming that turnover number of the enzymes is constant.
Kinetic parameter (Vmax) of an enzyme in the normal cell can be calculated by integrating
fold change of normal versus cancer cell.](https://image.slidesharecdn.com/f3f0369b-c4ca-46e9-b5d3-988607a10813-160615062302/85/Intern-Report-15-320.jpg)
![10
We have used gene expression data available in ArrayExpress database to determine the
differential gene expression among the two types of cell and integrated the significantly
expressed genes into the cancer cell model to reconstruct a normal cell model.
We have used gene expression profiles from a HCC tissues and adjacent normal liver tissues
from three patients. Array platform used is “A-AFFY-44-Affymetrix GeneChip Human
Genome U133 Plus 2.0 [HG-U133_Plus_2]” submitted by GSE ID-33006. Normalization of
the gene expression data from ArrayExpress is done by MAS5 algorithm.
Differentially expressed genes were determined by employing a t-test on the normalized
expression levels of genes in normal lever tissues and HCC tissues.
T-test was used to determine if two sets of data are significantly different from each other,
and is most commonly applied when the test statistic would follow a normal distribution. We
have used p-value as the characteristics of differentiation between two sets and the statistical
significance is kept at 0.05.
Differential gene-expression analysis was performed using t-test acknowledging the
statistical significance of the p-value (Appendix-Table 10).
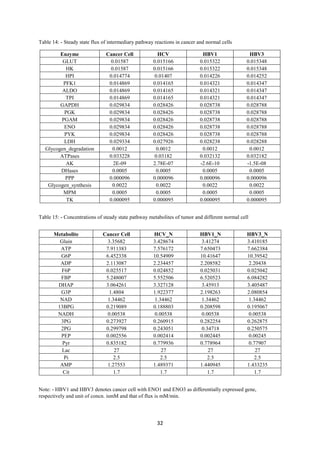
Table 1- List of differentially expressed genes is as follows
Gene p-value
Normalized
gene expression
in Cancer cell
Normalized
gene expression
in Normal cell FC
HK1 0.046359 529.313 726.292 0.728788
ALDOB 0.015168 239.796 484.046 0.495399
LDHA 0.038207 23903.6 38331.3 0.623605
AK3 0.007923 6301.375 12394.36 0.508407
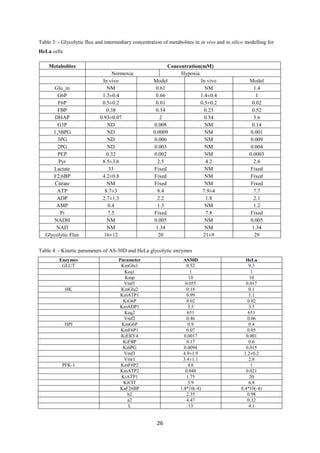
Table 2- Conversion of kinetic parameters from a cancer to a normal cell
Enzyme Parameter Cancer Cell FC Normal Cell
HK Vm 0.35 0.728788 0.480249
ALDO Vmf 0.056 0.495399 0.11304
Vmr 0.044 0.495399 0.088817
LDH Vmf 2 0.623605 3.207157
Vmr 0.27 0.623605 0.432966](https://image.slidesharecdn.com/f3f0369b-c4ca-46e9-b5d3-988607a10813-160615062302/85/Intern-Report-16-320.jpg)
![12
Result: -
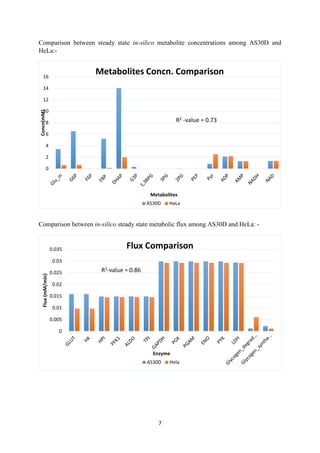
As it can be observed from the comparison (Refer Table -11 Appendix), correlation between
steady state concentration of metabolites in in silico gene expression data integrated normal
cell and HMDB reported data is very low and also metabolites are not regulated in cancer
condition in the manner they are supposed to be (Table-5) which suggests that this integration
of gene expression does not fully characterize the metabolic remodelling.
Since, data used for integration was from clinical sample, however model was built on
cell line data and problem in extrapolating the model from one system-level to another
system-level is a well-known problem in modelling [17], this can be one of the possible
reason for this.
In step, we further integrated gene expression data from meta-analysis to cross-check
the above results.
B. Integration of Meta-analysis Gene-expression Data
Objective and methods employed in this data integration protocol is same as the previous one
except the fact that here differentially expressed genes and their fold change were determined
by meta-analysis and later on their regulation is confirmed by liverome database (Table-6).
Table 3- For HBV (Hepatoma B virus) HCC: -
Enzyme FC (abs) Regulation
GAPDH 1.5994142 up
ALDOA 1.7271312 up
ENO1 1.7579875 up
ENO3 2.5182812 down
ALDOB 1.7974195 down
GPI 1.673636 up
TKT 2.1196654 up
LDHD 1.8587292 down
Table 4- For HCV (Hepatoma C virus) HCC: -
Gene Symbol FC (abs) Regulation
GAPDH 1.527778 up
ENO3 3.1940975 down
ALDOB 2.1119492 down
HK3 1.5619298 down
GPI 1.7150853 up
TKT 2.705986 up
LDHD 1.807008 down](https://image.slidesharecdn.com/f3f0369b-c4ca-46e9-b5d3-988607a10813-160615062302/85/Intern-Report-18-320.jpg)
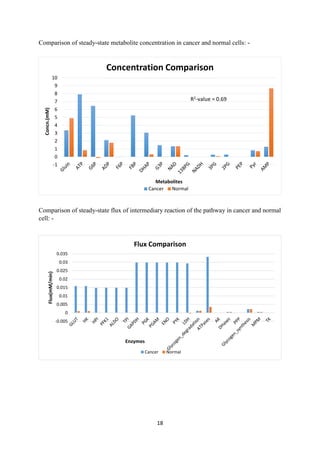
![14
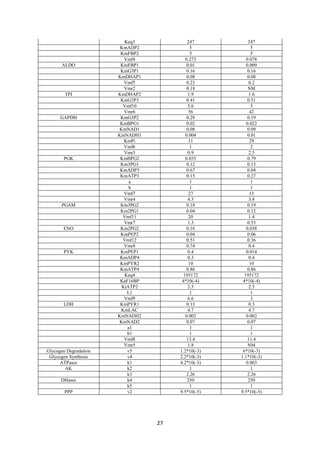
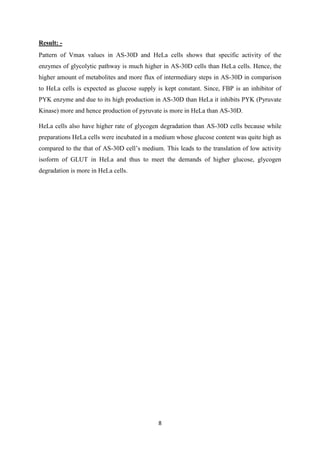
Comparison of steady-state flux of intermediary reaction in pathway: -
Result: -
Analysis showed that metabolism is not significantly different in both cancer and normal cell
at flux as well as metabolite level and also the regulation of metabolites is not as per the
results (Table-5) which is derived from the literature. However, previous works [1] has
shown major alterations in glycolysis in cancer cells which shows that this integration of
gene-expression data is producing erroneous results and was not able to capture metabolic
remodelling.
This confirms the previous result, that integrating tissue-level gene-expression data
into model does not mimic the normal condition.
In next step, we have integrated gene-expression data at the cell line level.
-0.005
0
0.005
0.01
0.015
0.02
0.025
0.03
0.035
Flux(mM/min)
Enzymes
Flux Comparison
Cancer Cell HCV HBV1 HBV3](https://image.slidesharecdn.com/f3f0369b-c4ca-46e9-b5d3-988607a10813-160615062302/85/Intern-Report-20-320.jpg)
![15
C. Integration of HepG2/Hepatocytes Gene Expression Data
Objective and methods employed in this data integration protocol is again same as section
1A. Differentially expressed genes in HepG2 cell line (relative to hepatocytes) and their
expression level (hence the fold changes) are calculated from [18].
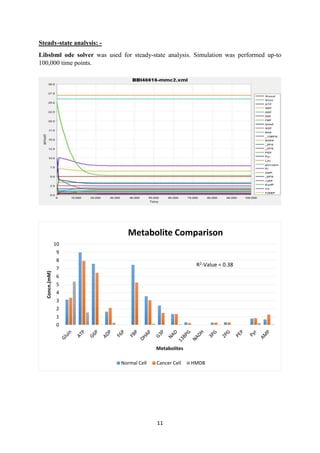
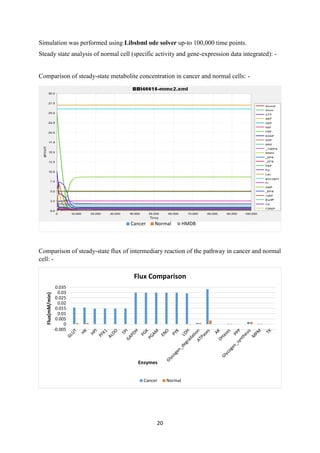
Simulation was performed by using Libsbml solver to 1,000,000 time points
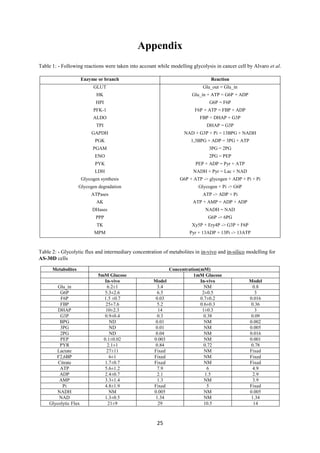
Comparison of steady-state metabolite concentration in cancer and normal cells: -
0
1
2
3
4
5
6
7
8
9
Concn.(mM
Metabolites
Concentration Comparison
Cancer Normal HMDB
R2-value = 0.68](https://image.slidesharecdn.com/f3f0369b-c4ca-46e9-b5d3-988607a10813-160615062302/85/Intern-Report-21-320.jpg)
![16
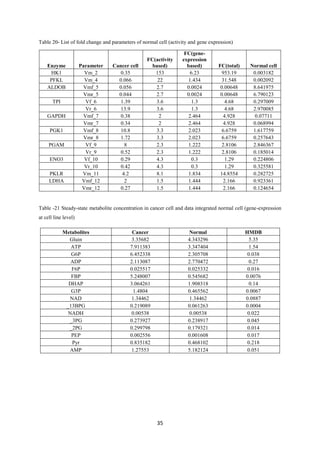
Comparison of steady-state flux of intermediary reaction of the pathway in cancer and normal
cell: -
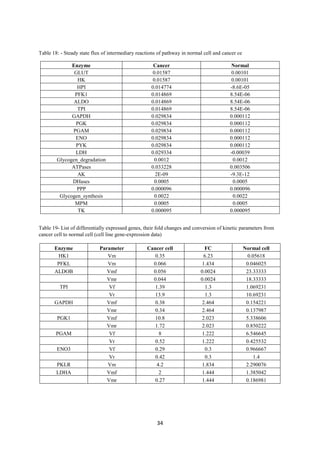
Result: -
Analysis showed that correlation between data integrated normal cell and data reported in
HMDB at metabolite level is 0.68. Metabolites were regulating (Table-5) in the appropriate
manner, qualitatively. Flux variation pattern between cancer cell and normal also confirms
that this time we were able to capture metabolic remodelling to some extent in our data
integrated model.
Thus, referring all the results of this section, it can be inferred that integrating the
gene-expression data at cell line level can improve the ability of integrated normal model to
mimic the in vivo behaviour.
In next step, we further explored whether gene expression is solely responsible for
metabolic remodelling or not. For this, we integrated specific activity variation obtained from
Alvaro et al. [4].
0
0.005
0.01
0.015
0.02
0.025
0.03
0.035
Flux(mM/min)
Enzymes
Flux Comparison
Cancer Cell Normal cell](https://image.slidesharecdn.com/f3f0369b-c4ca-46e9-b5d3-988607a10813-160615062302/85/Intern-Report-22-320.jpg)
![17
Section 3
A. Activity Based Data Integration
Objective: -
We have a cancer cell model of glycolysis from Alvaro et al. [3], we have extracted the
activity variation of enzymes in two conditions from Alvaro et al. [4] and then integrate this
data into cancer model to remodel it into a normal cell model and then verify whether this
model is mimicking the in vivo behaviour or not.
Method: -
Fold change of specific activity of the enzymes involved in the pathway was directly
integrated into the model.
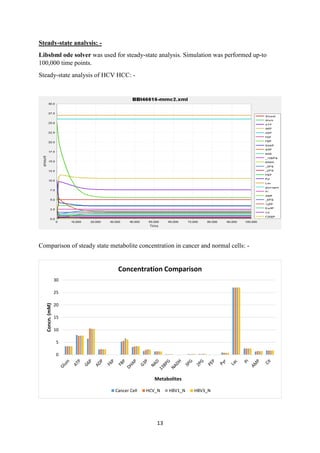
Steady-state Analysis: -
Simulation was performed by using Libsbml ode solver to 100,000 time points.
Steady state analysis of normal cell (activity data integrated): -](https://image.slidesharecdn.com/f3f0369b-c4ca-46e9-b5d3-988607a10813-160615062302/85/Intern-Report-23-320.jpg)
![19
Result:-
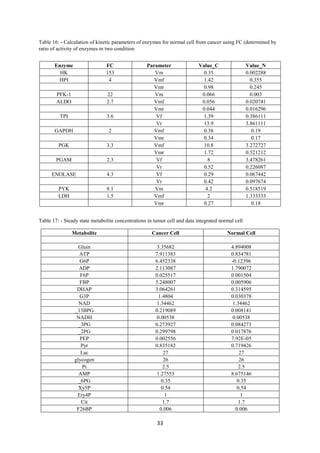
Table 5- Data extracted from literature regarding the metabolites concentration variation in a
tumor and normal cell
Metabolite Remark(C/N)
FBP 5.212(up)
G6P 2.42(up)
G3P 0.36(down)
Glucose down regulated
G3P Up regulated
Glucose down regulated
G3P up regulated
Analysis of regulation of metabolite concentration in the activity based model to that of data
extracted from literature [19], [20] showed that data integrated model follows the trend as per
the literature, though qualitatively. Flux variation in two conditions also supports the above
inference as the flux of individual steps in tumor cell has accelerated, which is in line with
the fact that glycolysis gets accelerated in cancer cells. Correlation value delineates that
normal cell model is mimicking the in vivo behaviour to quite a good level but not
completely.
Since, correlation values obtained from previous model (2c) and this model are very
similar, it reflects that variation in specific activity is due to change in gene-expression. To
see the other possible effect of variation of specific activity on pathway, we further
constructed integrated model having both variation of gene-expression and activity.
B. Integration of Both Activity and Gene-expression Data
Objective is same as the previous section but in this protocol the fold change is calculated by
assuming that both catalytic activity and gene-expression changes thus, fold change here is
the basically the multiplication of gene-expression and activity based fold changes
individually. Then, analysis of the accuracy of the integrated model by comparing the
correlation value to the previous results and the regulation of metabolites from liverome
database was done.
Steady-state analysis: -](https://image.slidesharecdn.com/f3f0369b-c4ca-46e9-b5d3-988607a10813-160615062302/85/Intern-Report-25-320.jpg)
![21
Results: -
Though we have integrated both specific activity and gene expression in combination but still
there is a mere improvement in the correlation value. We have also verified from the
literature [2] that catalytic activity of metabolic enzymes is generally a constant as the
mutation frequency is very low in these enzymes. Thus, this analysis confirmed that variation
of specific activity and gene expression data is same.](https://image.slidesharecdn.com/f3f0369b-c4ca-46e9-b5d3-988607a10813-160615062302/85/Intern-Report-27-320.jpg)
![23
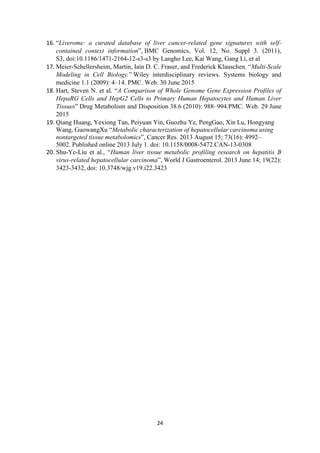
References: -
1. “Understanding the Warburg Effect: The Metabolic Requirements of Cell
Proliferation”, MatthewG. Vander Heiden, Lewis C. Cantley, and Craig B. Thompson
Science 22 May 2009: 324 (5930), 1029-1033. [DOI:10.1126/science.1160809]
2. Thompson, Craig B. “Metabolic Enzymes as Oncogenes or Tumor Suppressors.” The
New England journal of medicine 360.8 (2009): 813–815.PMC. Web. 30 June 2015
3. Alvaro Marín-Hernández, Juan Carlos Gallardo-Pérez, Sara Rodríguez-Enríquez,
RuselyEncalada, Rafael Moreno-Sánchez, Emma Saavedra, “Modeling cancer
glycolysis”, Biochimica et BiophysicaActa (BBA) - Bioenergetics, Volume 1807,
Issue 6, June 2011, Pages 755-767, ISSN 0005-2728
4. Alvaro Marín-Hernández, Sara Rodríguez-Enríquez, Paola A. Vital-González, Fanny
L. Flores-Rodríguez, Marina Macías-Silva, Marcela Sosa-Garrocho, Rafael Moreno-
Sánche, “Determining and understanding the control of glycolysis in fast-growth
tumor cells. Flux control by an over-expressed but strongly product-inhibited
hexokinase” FEBS J. 2006 May; 273(9): 1975–1988. doi: 10.1111/j.1742-
4658.2006.05214.x
5. Stavrum, Anne-Kristin et al. “Model of Tryptophan Metabolism, Readily Scalable
Using Tissue-Specific Gene Expression Data.” The Journal of Biological
Chemistry 288.48 (2013): 34555–34566. PMC. Web. 29 June 2015
6. Johann M. Rohwer et al., “Kinetic modelling of plant metabolic pathways”, J. Exp.
Bot. first published online March 14, 2012 doi:10.1093/jxb/ers080
7. Resat, H., Petzold, L., & Pettigrew, M. F. (2009). “Kinetic Modeling of Biological
Systems”, Methods in Molecular Biology (Clifton, N.J.), 541, 311–335.
doi:10.1007/978-1-59745-243-4_14
8. Jack Snoep, “Teaching Metabolic control analysis abd kinetic modelling”, The
Biochemist Society, February 1999
9. Kolesnikov N. et al., 2015. “ArrayExpress update-simplifying data
submissions.”,Nucleic Acids Res, doi:10.1093/nar/gku1057. Pubmed ID 25361974
10. http://www.genecards.org/
11. Barrett T, Wilhite SE, Ledoux P, Evangelista C, Kim IF, Tomashevsky M, Marshall
KA, Phillippy KH, Sherman PM, Holko M, Yefanov A, Lee H, Zhang N, Robertson
CL, Serova N, Davis S, Soboleva A. “NCBI GEO: archive for functional genomics
data sets--update” Nucleic Acids Res. 2013 Jan;41(Database issue):D991-5.
12. Nick Juty et al., “BioModels: Content, Features, Functionality and Use”, CPT:
Pharmacometrics & Systems Pharmacology 2015
13. Barthelmes, Jens et al. “BRENDA, AMENDA and FRENDA: The Enzyme Information
System in 2007.” Nucleic Acids Research 35.Database issue (2007): D511–
D514. PMC. Web. 29 June 2015
14. “GEPASI: a software package for modelling the dynamics, steady states and control of
biochemical and other systems”, P. Mendes, Comput Appl Biosci. 1993 October; 9(5):
563–571
15. “CellDesigner: a process diagram editor for gene-regulatory and biochemical
networks” BIOSILICO, Vol. 1, No. 5. (05 November 2003), pp. 159-
162, doi:10.1016/s1478-5382(03)02370-9 by A. Funahashi, M. Morohashi, H. Kitano,
N. Tanimura](https://image.slidesharecdn.com/f3f0369b-c4ca-46e9-b5d3-988607a10813-160615062302/85/Intern-Report-29-320.jpg)