Infographics design
Line ;connect the information, create a direction
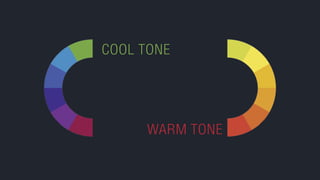
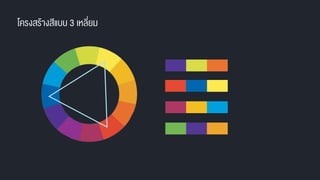
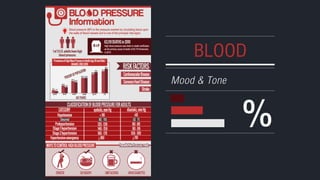
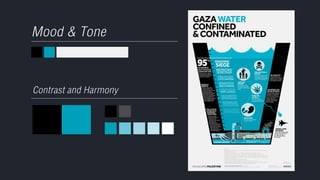
Color ; define an important information
Symbol ; convey a meaning of its information
4.
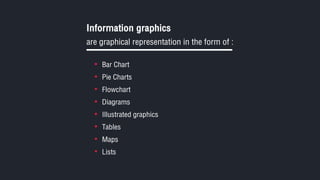
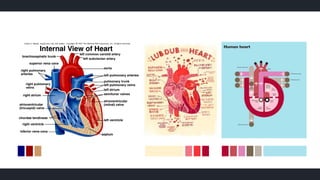
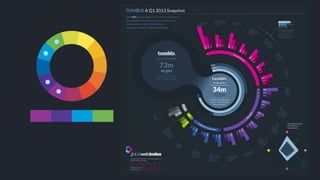
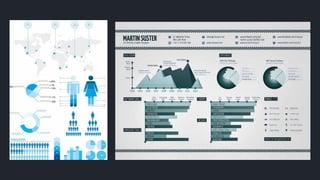
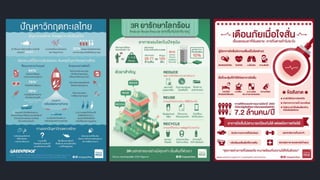
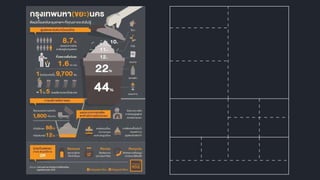
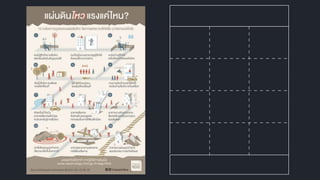
Information graphics
are graphicalrepresentation in the form of :
Bar Chart
Pie Charts
Flowchart
Diagrams
Illustrated graphics
Tables
Maps
Lists