

Recommended
More Related Content
What's hot
What's hot (18)
Viewers also liked
Viewers also liked (12)
Similar to Mass vs Period
Similar to Mass vs Period (20)
Recently uploaded
Recently uploaded (20)
Mass vs Period
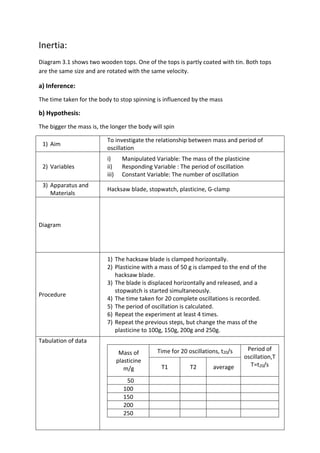
- 1. Inertia: Diagram 3.1 shows two wooden tops. One of the tops is partly coated with tin. Both tops are the same size and are rotated with the same velocity. a) Inference: The time taken for the body to stop spinning is influenced by the mass b) Hypothesis: The bigger the mass is, the longer the body will spin 1) Aim To investigate the relationship between mass and period of oscillation 2) Variables i) Manipulated Variable: The mass of the plasticine ii) Responding Variable : The period of oscillation iii) Constant Variable: The number of oscillation 3) Apparatus and Materials Hacksaw blade, stopwatch, plasticine, G-clamp Diagram Procedure 1) The hacksaw blade is clamped horizontally. 2) Plasticine with a mass of 50 g is clamped to the end of the hacksaw blade. 3) The blade is displaced horizontally and released, and a stopwatch is started simultaneously. 4) The time taken for 20 complete oscillations is recorded. 5) The period of oscillation is calculated. 6) Repeat the experiment at least 4 times. 7) Repeat the previous steps, but change the mass of the plasticine to 100g, 150g, 200g and 250g. Tabulation of data Mass of plasticine m/g Time for 20 oscillations, t20/s Period of oscillation,T T=t20/sT1 T2 average 50 100 150 200 250
- 3. The Effect Of Force Diagram shows a man pushing a broken-down car with passengers in it. The car moves with a small acceleration and another man pushing the same car with the same force with no passenger in it. The car moves with a bigger acceleration. a) Inference Acceleration of the car depends on the mass b) Hypothesis The bigger the mass, the lower the acceleration. Aim To investigate the relationship between the mass and the acceleration of the trolley Variables i) Manipulated Variable: Mass ii) Responding Variable: Acceleration iii) Constant Variable: Force Apparatus and Materials Ticker tape, ruler, string chord, pulley, power supply, trolley, ticker timer, connecting wire, friction compensated inclined plane, slotted weight, wooden blocks and metre rule Diagram Procedure 1) The apparatus is set up as shown in the diagram. 2) A wooden block of 0.2 kg is added on the trolley 3) Power supply is switched on and the trolley is being pulled by the weight. 4) Based on the ticker tape obtained, the acceleration of the trolley is calculated by using the formula. 5) The experiment is repeated by using wooden blocks of 0.4kg, 0.6kg, 0.8kg and 1.0kg. Tabulation of data Mass,m (kg) Acceleration, a (m s-2) 0.2 0.4 0.6 0.8 1.0
- 5. Elasticity Diagram 3.1 shows a worker carrying a gas tank. Diagram 3.2 shows the same worker carrying two gas tank. Observe the length of the spring in the suspension system of the motorcycle in both situations. Based the observation: Inference The compression of a spring changes when the force applied changes. Hypothesis The extension of a spring increases when the applied force increases. Aim To investigate the relationship between the force applied, F, and the extension, x, of a spring. Variables i) Manipulated Variable: The force applied, F ii) Responding Variable: The extension of the spring, x iii) Constant Variable: The type of spring Apparatus and Materials Spring, slotted weights, retort stand with clamp, metre rule, pin and plasticine Diagram Procedure 1) The apparatus is set up as shown. 2) With no slotted weights attached to the spring, the initial position of the pin is recorded as X0. 3) A slotted weight of m=40g is attached to the end of the spring. 4) The new position of the extension of spring, x’ of the pin is recorded. 5) The extension of the spring is calculated as x = x’ - x0 6) Steps 3 and 4 are repeated using m= 60g, 80g, 100g and 120g. Force, F (Mass)/g Length of the spring, x’/cm Extension x = x’ – x0/cm 40 60 80 100 120
- 6. Analysis of Data Force, F Extension, x