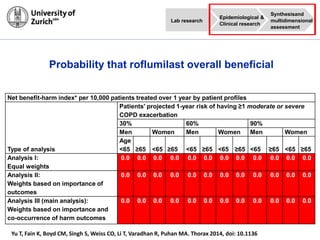
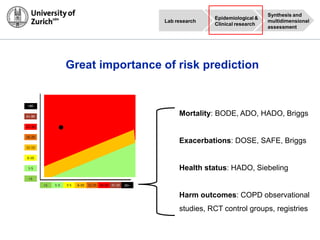
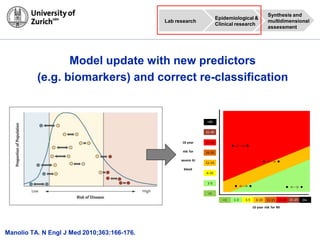
Milo Puhan, MD, PhD
Professor of Epidemiology & Public Health
University of Zurich, Switzerland
Johns Hopkins University, USA
Individual Risk Stratification
BRN – AJRCCM Workshop
Personalized Respiratory Medicine
Barcelona, June 13, 2014
Will this drug be beneficial for a specific individual?
-20% COPD exacerbations
Insomnia + 300%
Anxiety + 200%
Depression + 180%
Diarrhea + 300%
Nausea + 300%
Weight loss + 400%
Headache + 200%
Dizziness + 300%
Excess of
How to apply these results to individual patients?
-20% COPD exacerbations
Acute pancreatitis + 500% ?
Insomnia + 300%
Anxiety + 200%
Depression + 180%
Suicide + 500% ?
Diarrhea + 300%
Nausea + 300%
Weight loss + 400%
Headache + 200%
Dizziness + 300%
Excess of
Patient 1
Lung function ↓
≤ 1 exacerbation/y
Chronic GI problems
Mild depression
Patient 2
Lung function ↓↓
≥2 exacerbations/y
No GI problems
Mild depression
Don‘t use drug Worth a try?
Individuals have unique combinations of characteristics
Patient 1 ↓ ↓ ↓ ↑ Exacerb.↓ Exacerb.↓ ↑ ↑
Patient 2 ↓↓ ↑ ↓ ↓ Exacerb.↓ Exacerb. ↑ ↓ ↑
Patient 3 ↓↓ ↑ ↑ ↓ Exacerb.↑ Exacerb. ↑ ↑ ↑
Patient …
Individuals have unique combinations of characteristics
Patient 1 ↓ ↓ ↓ ↑ Exacerb
↓
Exacerb
↓
↑ ↑
Patient 2 ↓↓ ↑ ↓ ↓ Exacerb
↓
Exacerb
↓
↓ ↑
Patient 3 ↓↓ ↑ ↑ ↓ Exacerb
↑
Exacerb
↑
↑ ↑
Patient
…
Current practice of estimating benefits vs. harms
Evidence on
treatment effects
Patient values &
preferences
Determinants of outcome risks &
treatment effects
Exacerbations
Favors
treatment
Favors
control
0.5 0.7 1 1.5 2
Favors
treatment
Favors
control
Nausea
0.001 0.1 1 10 1000
Favors
treatment
Favors
control
Diarrhea
0.1 0.2 0.5 1 2 5 10
RCT control
group event
rates (e.g. 20%
in 1 year)
NNT: 25
NNH: 5
 May be worth a try
 Much uncertainty
since oversimplified:
Single outcome risks
Few outcomes
Implicit preferences
Evidence on
treatment effects
Patient values &
preferences
<1
1-5
6-10
11-15
16-20
21-30
61-80
>80
<1 1-3 3-5 6-10 11-15 16-20 21-25 26+
Determinants of outcome risks &
treatment effects
Combine 3 key ingredients and use modern technology
How can we get there?
Personalized through risk
stratification and preferences
Based on your individual characteristics and what
is important for you
<1
1-5
6-10
11-15
16-20
21-30
61-80
>80
<1 1-3 3-5 6-10 11-15 16-20 21-25 26+
The chance that you will
benefit from drug X is
very low
(nine out of ten patients
like you will experience
more harm than benefit)
Your risk for a hospital admission
because of COPD
Your risk for
experiencing
severe side
effects
Evidence on
treatment effects
Patient values &
preferences
<1
1-5
6-10
11-15
16-20
21-30
61-80
>80
<1 1-3 3-5 6-10 11-15 16-20 21-25 26+
Determinantsof outcome risks &
treatment effects
Lab research
Synthesis and
multidimensional
assessment
Epidemiological &
Clinical research
Well-defined translational paths
Exacerbations
Favors
treatment
Favors
control
0.5 0.7 1 1.5 2
<1
1-5
6-10
11-15
16-20
21-30
61-80
>80
<1 1-3 3-5 6-10 11-15 16-20 21-25 26+
Multidimensional
assessments
- A quickly
emerging field
RCTs
Registries
Observational studies
Surveys (preferences)
Observational studies
(prognosis)
Various methods
Outcome risks
Estimates of effect
Absolute effects
Benefit harm
analysis
Importance of
Outcomes
Lab research
Synthesis and
multidimensional
assessment
Epidemiological &
Clinical research
Guo et al. Value Health 2010, 13(5):657–666.
Puhan et al. BMC Med Res Meth 2012, 12:173
Boyd, et al. AHRQ 2012 .12(13)-EHC150-EF
FDA PDUFA V Plan (FY 2013-2017)
Approaches for benefit harm assessment
Lab research
Synthesis and
multidimensional
assessment
Epidemiological &
Clinical research
Decision making
context?
Simulation to consider statistical uncertainty of
effects and incidence rates
<1
1-5
6-10
11-15
16-20
21-30
61-80
>80
<1 1-3 3-5 6-10 11-15 16-20 21-25 26+
Lab research
Synthesis and
multidimensional
assessment
Epidemiological &
Clinical research
Based on your individual characteristics and what
is important for you
<1
1-5
6-10
11-15
16-20
21-30
61-80
>80
<1 1-3 3-5 6-10 11-15 16-20 21-25 26+
The chance that you will
benefit from drug X is
very low
(nine out of ten patients
like you will experience
more harm than benefit)
Your risk for a hospital admission
because of COPD
Your risk for
experiencing
severe side
effects
Age 45-54 Age 55-64 Age 65-74 Age 75-84
10-year risk of ischemic stroke: 0%-5% 10-year risk of ischemic stroke: 0%-5% 10-year risk of ischemic stroke: 0%-5% 10-year risk of ischemic stroke: 0%-5%
10-year risk of severe GI bleeds40%-50% 10-year risk of severe GI bleeds40%-50% 10-year risk of severe GI bleeds40%-50% 10-year risk of severe GI bleeds40%-50%
30%-40% 30%-40% 30%-40% 30%-40%
20%-30% 20%-30% 20%-30% 20%-30%
15%-20% 15%-20% 15%-20% 15%-20%
10%-15% 10%-15% 10%-15% 10%-15%
5%-10% 5%-10% 5%-10% 5%-10%
1%-5% 1%-5% 1%-5% 1%-5%
0%-1% 0%-1% 0%-1% 0%-1%
0%-1% 1%-3% 3%-5% 5%-10% 10%-15% 15%-20% 20%-25% 25%-30% 0%-1% 1%-3% 3%-5% 5%-10% 10%-15% 15%-20% 20%-25% 25%-30% 0%-1% 1%-3% 3%-5% 5%-10% 10%-15% 15%-20% 20%-25% 25%-30% 0%-1% 1%-3% 3%-5% 5%-10% 10%-15% 15%-20% 20%-25% 25%-30%
10-year risk of MI 10-year risk of MI 10-year risk of MI 10-year risk of MI
10-year risk of ischemic stroke: 5%-10% 10-year risk of ischemic stroke: 5%-10% 10-year risk of ischemic stroke: 5%-10% 10-year risk of ischemic stroke: 5%-10%
10-year risk of severe GI bleeds40%-50% 10-year risk of severe GI bleeds40%-50% 10-year risk of severe GI bleeds40%-50% 10-year risk of severe GI bleeds40%-50%
30%-40% 30%-40% 30%-40% 30%-40%
20%-30% 20%-30% 20%-30% 20%-30%
15%-20% 15%-20% 15%-20% 15%-20%
10%-15% 10%-15% 10%-15% 10%-15%
5%-10% 5%-10% 5%-10% 5%-10%
1%-5% 1%-5% 1%-5% 1%-5%
0%-1% 0%-1% 0%-1% 0%-1%
0%-1% 1%-3% 3%-5% 5%-10% 10%-15% 15%-20% 20%-25% 25%-30% 0%-1% 1%-3% 3%-5% 5%-10% 10%-15% 15%-20% 20%-25% 25%-30% 0%-1% 1%-3% 3%-5% 5%-10% 10%-15% 15%-20% 20%-25% 25%-30% 0%-1% 1%-3% 3%-5% 5%-10% 10%-15% 15%-20% 20%-25% 25%-30%
10-year risk of MI 10-year risk of MI 10-year risk of MI 10-year risk of MI
10-year risk of ischemic stroke: 10%-15% 10-year risk of ischemic stroke: 10%-15% 10-year risk of ischemic stroke: 10%-15% 10-year risk of ischemic stroke: 10%-15%
10-year risk of severe GI bleeds40%-50% 10-year risk of severe GI bleeds40%-50% 10-year risk of severe GI bleeds40%-50% 10-year risk of severe GI bleeds40%-50%
30%-40% 30%-40% 30%-40% 30%-40%
20%-30% 20%-30% 20%-30% 20%-30%
15%-20% 15%-20% 15%-20% 15%-20%
10%-15% 10%-15% 10%-15% 10%-15%
5%-10% 5%-10% 5%-10% 5%-10%
1%-5% 1%-5% 1%-5% 1%-5%
0%-1% 0%-1% 0%-1% 0%-1%
0%-1% 1%-3% 3%-5% 5%-10% 10%-15% 15%-20% 20%-25% 25%-30% 0%-1% 1%-3% 3%-5% 5%-10% 10%-15% 15%-20% 20%-25% 25%-30% 0%-1% 1%-3% 3%-5% 5%-10% 10%-15% 15%-20% 20%-25% 25%-30% 0%-1% 1%-3% 3%-5% 5%-10% 10%-15% 15%-20% 20%-25% 25%-30%
10-year risk of MI 10-year risk of MI 10-year risk of MI 10-year risk of MI
10-year risk of ischemic stroke: 15%-20% 10-year risk of ischemic stroke: 15%-20% 10-year risk of ischemic stroke: 15%-20% 10-year risk of ischemic stroke: 15%-20%
10-year risk of severe GI bleeds40%-50% 10-year risk of severe GI bleeds40%-50% 10-year risk of severe GI bleeds40%-50% 10-year risk of severe GI bleeds40%-50%
30%-40% 30%-40% 30%-40% 30%-40%
20%-30% 20%-30% 20%-30% 20%-30%
15%-20% 15%-20% 15%-20% 15%-20%
10%-15% 10%-15% 10%-15% 10%-15%
5%-10% 5%-10% 5%-10% 5%-10%
1%-5% 1%-5% 1%-5% 1%-5%
0%-1% 0%-1% 0%-1% 0%-1%
0%-1% 1%-3% 3%-5% 5%-10% 10%-15% 15%-20% 20%-25% 25%-30% 0%-1% 1%-3% 3%-5% 5%-10% 10%-15% 15%-20% 20%-25% 25%-30% 0%-1% 1%-3% 3%-5% 5%-10% 10%-15% 15%-20% 20%-25% 25%-30% 0%-1% 1%-3% 3%-5% 5%-10% 10%-15% 15%-20% 20%-25% 25%-30%
10-year risk of MI 10-year risk of MI 10-year risk of MI 10-year risk of MI
10-year risk of ischemic stroke: 20%-25% 10-year risk of ischemic stroke: 20%-25% 10-year risk of ischemic stroke: 20%-25% 10-year risk of ischemic stroke: 20%-25%
10-year risk of severe GI bleeds40%-50% 10-year risk of severe GI bleeds40%-50% 10-year risk of severe GI bleeds40%-50% 10-year risk of severe GI bleeds40%-50%
30%-40% 30%-40% 30%-40% 30%-40%
20%-30% 20%-30% 20%-30% 20%-30%
15%-20% 15%-20% 15%-20% 15%-20%
10%-15% 10%-15% 10%-15% 10%-15%
5%-10% 5%-10% 5%-10% 5%-10%
1%-5% 1%-5% 1%-5% 1%-5%
0%-1% 0%-1% 0%-1% 0%-1%
0%-1% 1%-3% 3%-5% 5%-10% 10%-15% 15%-20% 20%-25% 25%-30% 0%-1% 1%-3% 3%-5% 5%-10% 10%-15% 15%-20% 20%-25% 25%-30% 0%-1% 1%-3% 3%-5% 5%-10% 10%-15% 15%-20% 20%-25% 25%-30% 0%-1% 1%-3% 3%-5% 5%-10% 10%-15% 15%-20% 20%-25% 25%-30%
10-year risk of MI 10-year risk of MI 10-year risk of MI 10-year risk of MI
10-year risk of ischemic stroke: 25%-30% 10-year risk of ischemic stroke: 25%-30% 10-year risk of ischemic stroke: 25%-30% 10-year risk of ischemic stroke: 25%-30%
10-year risk of severe GI bleeds40%-50% 10-year risk of severe GI bleeds40%-50% 10-year risk of severe GI bleeds40%-50% 10-year risk of severe GI bleeds40%-50%
30%-40% 30%-40% 30%-40% 30%-40%
20%-30% 20%-30% 20%-30% 20%-30%
15%-20% 15%-20% 15%-20% 15%-20%
10%-15% 10%-15% 10%-15% 10%-15%
5%-10% 5%-10% 5%-10% 5%-10%
1%-5% 1%-5% 1%-5% 1%-5%
0%-1% 0%-1% 0%-1% 0%-1%
0%-1% 1%-3% 3%-5% 5%-10% 10%-15% 15%-20% 20%-25% 25%-30% 0%-1% 1%-3% 3%-5% 5%-10% 10%-15% 15%-20% 20%-25% 25%-30% 0%-1% 1%-3% 3%-5% 5%-10% 10%-15% 15%-20% 20%-25% 25%-30% 0%-1% 1%-3% 3%-5% 5%-10% 10%-15% 15%-20% 20%-25% 25%-30%
10-year risk of MI 10-year risk of MI 10-year risk of MI 10-year risk of MI
Lab research
Synthesis and
multidimensional
assessment
Epidemiological &
Clinical research
Moderate or severe
exacerbation
Acute pancreatitis
Insomnia
Anxiety
Depression
Suicide (completed)
Diarrhea
Nausea
Weight loss
Headache
Dizziness
Benefits and harms of roflumilast
Yu T, Fain K, Boyd CM, Singh S, Weiss CO, Li T, Varadhan R, Puhan MA. Thorax 2014, doi: 10.1136
FDApivotal and
safety pool
COPD observational studies
Placebo groups of RCTs
Survey (preferences)
Observationalstudies
(clustering events)
Outcome risks
Estimates of effect
Absolute effects
Benefit harm
analysis
Importance of
Outcomes
Lab research
Synthesisand
multidimensional
assessment
Epidemiological &
Clinical research
Net benefit-harm index* per 10,000 patients treated over 1 year by patient profiles
Type of analysis
Patients' projected 1-year risk of having ≥1 moderate or severe
COPD exacerbation
30% 60% 90%
Men Women Men Women Men Women
Age
<65 ≥65 <65 ≥65 <65 ≥65 <65 ≥65 <65 ≥65 <65 ≥65
Analysis I:
Equal weights
0.0 0.0 0.0 0.0 0.0 0.0 0.0 0.0 0.0 0.0 0.0 0.0
Analysis II:
Weights based on importance of
outcomes
0.0 0.0 0.0 0.0 0.0 0.0 0.0 0.0 0.0 0.0 0.0 0.0
Analysis III (main analysis):
Weights based on importance and
co-occurrence of harm outcomes
0.0 0.0 0.0 0.0 0.0 0.0 0.0 0.0 0.0 0.0 0.0 0.0
Probability that roflumilast overall beneficial
Yu T, Fain K, Boyd CM, Singh S, Weiss CO, Li T, Varadhan R, Puhan MA. Thorax 2014, doi: 10.1136
Lab research
Synthesisand
multidimensional
assessment
Epidemiological &
Clinical research
Probability that
roflumilast is
beneficial
Prevention of severe exacerbations (requiring admission)
Lab research
Synthesis and
multidimensional
assessment
Epidemiological &
Clinical research
Yu T, et al. Thorax 2013, doi: 10.1136
Lab research
Synthesis and
multidimensional
assessment
Epidemiological &
Clinical research
Well-defined translational paths
Exacerbations
Favors
treatment
Favors
control
0.5 0.7 1 1.5 2
<1
1-5
6-10
11-15
16-20
21-30
61-80
>80
<1 1-3 3-5 6-10 11-15 16-20 21-25 26+
Great importance of risk prediction
Lab research
Synthesis and
multidimensional
assessment
Epidemiological &
Clinical research
<1
1-5
6-10
11-15
16-20
21-30
61-80
>80
<1 1-3 3-5 6-10 11-15 16-20 21-25 26+
Mortality: BODE, ADO, HADO, Briggs
Exacerbations: DOSE, SAFE, Briggs
Health status: HADO, Siebeling
Harm outcomes: COPD observational
studies, RCT control groups, registries
Prediction models of the future?
Rigorous evaluation is critical
Mean predicted risk: 10.5%
Mean observed risk: 8.2%
HL: p<0.0001
0
10
20
30
40
Observed risk
of acute renal
failure in %
0 10 20 30 40
Predicted risk of acute
renal failure in %
0.00
0.25
0.50
0.75
1.00
Sensitivity
0.00 0.25 0.50 0.75 1.00
1 - Specificity
Area under curve
0.76 (95% CI 0.71-0.81)
<1
1-5
6-10
11-15
16-20
21-30
31-40
>40
10 year
risk for
severe GI
bleed
10 year risk for MI
<1 1-3 3-5 6-10 11-15 16-20 21-25 26+
Current COPD
models
Current COPD
models
+ biomarkers
Current COPD
models
+ genetics
Only genetics
Lab research
Synthesis and
multidimensional
assessment
Epidemiological &
Clinical research
Model update with new predictors
(e.g. biomarkers) and correct re-classification
<1
1-5
6-10
11-15
16-20
21-30
31-40
>40
10 year
risk for
severe GI
bleed
10 year risk for MI
<1 1-3 3-5 6-10 11-15 16-20 21-25 26+
Manolio TA. N Engl J Med 2010;363:166-176.
Lab research
Synthesis and
multidimensional
assessment
Epidemiological &
Clinical research
Thomsen et al. JAMA. 2013;309(22):2353-2361
Lab research
Synthesis and
multidimensional
assessment
Epidemiological &
Clinical research
High CRP,
fibrinogen and/or
leukocyte count
0: 0.9%
1: 1.8%
2: 3.2%
3: 8.1%
Only biomarkers Added value of biomarkers
From uni- to multivariate associations
Lab research
Synthesis and
multidimensional
assessment
Epidemiological &
Clinical research
From associations of 3 biomarkers to risk prediction
From risk prediction to benefit harm prediction
Probability that
roflumilast is
beneficial
Lab research
Synthesis and
multidimensional
assessment
Epidemiological &
Clinical research
Testing
EBM 2.0: Focus on the individual
Exploring what is
important
Decision making
Based on your individual characteristics and what
is important for you
<1
1-5
6-10
11-15
16-20
21-30
61-80
>80
<1 1-3 3-5 6-10 11-15 16-20 21-25 26+
The chance that you will
benefit from drug X is
very low
(nine out of ten patients
like you will experience
more harm than benefit)
Your risk for a hospital admission
because of COPD
Your risk for
experiencing
severe side
effects
Lab research
Synthesis and
multidimensional
assessment
Epidemiological &
Clinical research
 Maximizes benefit – minimizes
harms for individuals
 Links individual characteristics
(from molecular to composite
level) to treatment oucomes
Individual Risk Stratification
Personalized through risk
stratification and preferences
Based on your individual characteristics and what
is important for you
<1
1-5
6-10
11-15
16-20
21-30
61-80
>80
<1 1-3 3-5 6-10 11-15 16-20 21-25 26+
The chance that you will
benefit from drug X is
very low
(nine out of ten patients
like you will experience
more harm than benefit)
Your risk for a hospital admission
because of COPD
Your risk for
experiencing
severe side
effects
Evidence on
treatment effects
Patient values &
preferences
<1
1-5
6-10
11-15
16-20
21-30
61-80
>80
<1 1-3 3-5 6-10 11-15 16-20 21-25 26+
Determinantsof outcome risks &
treatment effects
Well-defined translational approach to make evidence-
based personalized respiratory medicine happen
Lab research
Synthesis and
multidimensional
assessment
Epidemiological &
Clinical research

Individual Risk Stratification

  • 1.
    Milo Puhan, MD,PhD Professor of Epidemiology & Public Health University of Zurich, Switzerland Johns Hopkins University, USA Individual Risk Stratification BRN – AJRCCM Workshop Personalized Respiratory Medicine Barcelona, June 13, 2014
  • 2.
    Will this drugbe beneficial for a specific individual? -20% COPD exacerbations Insomnia + 300% Anxiety + 200% Depression + 180% Diarrhea + 300% Nausea + 300% Weight loss + 400% Headache + 200% Dizziness + 300% Excess of
  • 3.
    How to applythese results to individual patients? -20% COPD exacerbations Acute pancreatitis + 500% ? Insomnia + 300% Anxiety + 200% Depression + 180% Suicide + 500% ? Diarrhea + 300% Nausea + 300% Weight loss + 400% Headache + 200% Dizziness + 300% Excess of Patient 1 Lung function ↓ ≤ 1 exacerbation/y Chronic GI problems Mild depression Patient 2 Lung function ↓↓ ≥2 exacerbations/y No GI problems Mild depression Don‘t use drug Worth a try?
  • 4.
    Individuals have uniquecombinations of characteristics Patient 1 ↓ ↓ ↓ ↑ Exacerb.↓ Exacerb.↓ ↑ ↑ Patient 2 ↓↓ ↑ ↓ ↓ Exacerb.↓ Exacerb. ↑ ↓ ↑ Patient 3 ↓↓ ↑ ↑ ↓ Exacerb.↑ Exacerb. ↑ ↑ ↑ Patient …
  • 5.
    Individuals have uniquecombinations of characteristics Patient 1 ↓ ↓ ↓ ↑ Exacerb ↓ Exacerb ↓ ↑ ↑ Patient 2 ↓↓ ↑ ↓ ↓ Exacerb ↓ Exacerb ↓ ↓ ↑ Patient 3 ↓↓ ↑ ↑ ↓ Exacerb ↑ Exacerb ↑ ↑ ↑ Patient …
  • 6.
    Current practice ofestimating benefits vs. harms Evidence on treatment effects Patient values & preferences Determinants of outcome risks & treatment effects Exacerbations Favors treatment Favors control 0.5 0.7 1 1.5 2 Favors treatment Favors control Nausea 0.001 0.1 1 10 1000 Favors treatment Favors control Diarrhea 0.1 0.2 0.5 1 2 5 10 RCT control group event rates (e.g. 20% in 1 year) NNT: 25 NNH: 5  May be worth a try  Much uncertainty since oversimplified: Single outcome risks Few outcomes Implicit preferences
  • 7.
    Evidence on treatment effects Patientvalues & preferences <1 1-5 6-10 11-15 16-20 21-30 61-80 >80 <1 1-3 3-5 6-10 11-15 16-20 21-25 26+ Determinants of outcome risks & treatment effects Combine 3 key ingredients and use modern technology
  • 8.
    How can weget there? Personalized through risk stratification and preferences Based on your individual characteristics and what is important for you <1 1-5 6-10 11-15 16-20 21-30 61-80 >80 <1 1-3 3-5 6-10 11-15 16-20 21-25 26+ The chance that you will benefit from drug X is very low (nine out of ten patients like you will experience more harm than benefit) Your risk for a hospital admission because of COPD Your risk for experiencing severe side effects Evidence on treatment effects Patient values & preferences <1 1-5 6-10 11-15 16-20 21-30 61-80 >80 <1 1-3 3-5 6-10 11-15 16-20 21-25 26+ Determinantsof outcome risks & treatment effects
  • 9.
    Lab research Synthesis and multidimensional assessment Epidemiological& Clinical research Well-defined translational paths Exacerbations Favors treatment Favors control 0.5 0.7 1 1.5 2 <1 1-5 6-10 11-15 16-20 21-30 61-80 >80 <1 1-3 3-5 6-10 11-15 16-20 21-25 26+
  • 10.
    Multidimensional assessments - A quickly emergingfield RCTs Registries Observational studies Surveys (preferences) Observational studies (prognosis) Various methods Outcome risks Estimates of effect Absolute effects Benefit harm analysis Importance of Outcomes Lab research Synthesis and multidimensional assessment Epidemiological & Clinical research Guo et al. Value Health 2010, 13(5):657–666. Puhan et al. BMC Med Res Meth 2012, 12:173 Boyd, et al. AHRQ 2012 .12(13)-EHC150-EF FDA PDUFA V Plan (FY 2013-2017)
  • 11.
    Approaches for benefitharm assessment Lab research Synthesis and multidimensional assessment Epidemiological & Clinical research Decision making context?
  • 12.
    Simulation to considerstatistical uncertainty of effects and incidence rates <1 1-5 6-10 11-15 16-20 21-30 61-80 >80 <1 1-3 3-5 6-10 11-15 16-20 21-25 26+ Lab research Synthesis and multidimensional assessment Epidemiological & Clinical research
  • 13.
    Based on yourindividual characteristics and what is important for you <1 1-5 6-10 11-15 16-20 21-30 61-80 >80 <1 1-3 3-5 6-10 11-15 16-20 21-25 26+ The chance that you will benefit from drug X is very low (nine out of ten patients like you will experience more harm than benefit) Your risk for a hospital admission because of COPD Your risk for experiencing severe side effects
  • 14.
    Age 45-54 Age55-64 Age 65-74 Age 75-84 10-year risk of ischemic stroke: 0%-5% 10-year risk of ischemic stroke: 0%-5% 10-year risk of ischemic stroke: 0%-5% 10-year risk of ischemic stroke: 0%-5% 10-year risk of severe GI bleeds40%-50% 10-year risk of severe GI bleeds40%-50% 10-year risk of severe GI bleeds40%-50% 10-year risk of severe GI bleeds40%-50% 30%-40% 30%-40% 30%-40% 30%-40% 20%-30% 20%-30% 20%-30% 20%-30% 15%-20% 15%-20% 15%-20% 15%-20% 10%-15% 10%-15% 10%-15% 10%-15% 5%-10% 5%-10% 5%-10% 5%-10% 1%-5% 1%-5% 1%-5% 1%-5% 0%-1% 0%-1% 0%-1% 0%-1% 0%-1% 1%-3% 3%-5% 5%-10% 10%-15% 15%-20% 20%-25% 25%-30% 0%-1% 1%-3% 3%-5% 5%-10% 10%-15% 15%-20% 20%-25% 25%-30% 0%-1% 1%-3% 3%-5% 5%-10% 10%-15% 15%-20% 20%-25% 25%-30% 0%-1% 1%-3% 3%-5% 5%-10% 10%-15% 15%-20% 20%-25% 25%-30% 10-year risk of MI 10-year risk of MI 10-year risk of MI 10-year risk of MI 10-year risk of ischemic stroke: 5%-10% 10-year risk of ischemic stroke: 5%-10% 10-year risk of ischemic stroke: 5%-10% 10-year risk of ischemic stroke: 5%-10% 10-year risk of severe GI bleeds40%-50% 10-year risk of severe GI bleeds40%-50% 10-year risk of severe GI bleeds40%-50% 10-year risk of severe GI bleeds40%-50% 30%-40% 30%-40% 30%-40% 30%-40% 20%-30% 20%-30% 20%-30% 20%-30% 15%-20% 15%-20% 15%-20% 15%-20% 10%-15% 10%-15% 10%-15% 10%-15% 5%-10% 5%-10% 5%-10% 5%-10% 1%-5% 1%-5% 1%-5% 1%-5% 0%-1% 0%-1% 0%-1% 0%-1% 0%-1% 1%-3% 3%-5% 5%-10% 10%-15% 15%-20% 20%-25% 25%-30% 0%-1% 1%-3% 3%-5% 5%-10% 10%-15% 15%-20% 20%-25% 25%-30% 0%-1% 1%-3% 3%-5% 5%-10% 10%-15% 15%-20% 20%-25% 25%-30% 0%-1% 1%-3% 3%-5% 5%-10% 10%-15% 15%-20% 20%-25% 25%-30% 10-year risk of MI 10-year risk of MI 10-year risk of MI 10-year risk of MI 10-year risk of ischemic stroke: 10%-15% 10-year risk of ischemic stroke: 10%-15% 10-year risk of ischemic stroke: 10%-15% 10-year risk of ischemic stroke: 10%-15% 10-year risk of severe GI bleeds40%-50% 10-year risk of severe GI bleeds40%-50% 10-year risk of severe GI bleeds40%-50% 10-year risk of severe GI bleeds40%-50% 30%-40% 30%-40% 30%-40% 30%-40% 20%-30% 20%-30% 20%-30% 20%-30% 15%-20% 15%-20% 15%-20% 15%-20% 10%-15% 10%-15% 10%-15% 10%-15% 5%-10% 5%-10% 5%-10% 5%-10% 1%-5% 1%-5% 1%-5% 1%-5% 0%-1% 0%-1% 0%-1% 0%-1% 0%-1% 1%-3% 3%-5% 5%-10% 10%-15% 15%-20% 20%-25% 25%-30% 0%-1% 1%-3% 3%-5% 5%-10% 10%-15% 15%-20% 20%-25% 25%-30% 0%-1% 1%-3% 3%-5% 5%-10% 10%-15% 15%-20% 20%-25% 25%-30% 0%-1% 1%-3% 3%-5% 5%-10% 10%-15% 15%-20% 20%-25% 25%-30% 10-year risk of MI 10-year risk of MI 10-year risk of MI 10-year risk of MI 10-year risk of ischemic stroke: 15%-20% 10-year risk of ischemic stroke: 15%-20% 10-year risk of ischemic stroke: 15%-20% 10-year risk of ischemic stroke: 15%-20% 10-year risk of severe GI bleeds40%-50% 10-year risk of severe GI bleeds40%-50% 10-year risk of severe GI bleeds40%-50% 10-year risk of severe GI bleeds40%-50% 30%-40% 30%-40% 30%-40% 30%-40% 20%-30% 20%-30% 20%-30% 20%-30% 15%-20% 15%-20% 15%-20% 15%-20% 10%-15% 10%-15% 10%-15% 10%-15% 5%-10% 5%-10% 5%-10% 5%-10% 1%-5% 1%-5% 1%-5% 1%-5% 0%-1% 0%-1% 0%-1% 0%-1% 0%-1% 1%-3% 3%-5% 5%-10% 10%-15% 15%-20% 20%-25% 25%-30% 0%-1% 1%-3% 3%-5% 5%-10% 10%-15% 15%-20% 20%-25% 25%-30% 0%-1% 1%-3% 3%-5% 5%-10% 10%-15% 15%-20% 20%-25% 25%-30% 0%-1% 1%-3% 3%-5% 5%-10% 10%-15% 15%-20% 20%-25% 25%-30% 10-year risk of MI 10-year risk of MI 10-year risk of MI 10-year risk of MI 10-year risk of ischemic stroke: 20%-25% 10-year risk of ischemic stroke: 20%-25% 10-year risk of ischemic stroke: 20%-25% 10-year risk of ischemic stroke: 20%-25% 10-year risk of severe GI bleeds40%-50% 10-year risk of severe GI bleeds40%-50% 10-year risk of severe GI bleeds40%-50% 10-year risk of severe GI bleeds40%-50% 30%-40% 30%-40% 30%-40% 30%-40% 20%-30% 20%-30% 20%-30% 20%-30% 15%-20% 15%-20% 15%-20% 15%-20% 10%-15% 10%-15% 10%-15% 10%-15% 5%-10% 5%-10% 5%-10% 5%-10% 1%-5% 1%-5% 1%-5% 1%-5% 0%-1% 0%-1% 0%-1% 0%-1% 0%-1% 1%-3% 3%-5% 5%-10% 10%-15% 15%-20% 20%-25% 25%-30% 0%-1% 1%-3% 3%-5% 5%-10% 10%-15% 15%-20% 20%-25% 25%-30% 0%-1% 1%-3% 3%-5% 5%-10% 10%-15% 15%-20% 20%-25% 25%-30% 0%-1% 1%-3% 3%-5% 5%-10% 10%-15% 15%-20% 20%-25% 25%-30% 10-year risk of MI 10-year risk of MI 10-year risk of MI 10-year risk of MI 10-year risk of ischemic stroke: 25%-30% 10-year risk of ischemic stroke: 25%-30% 10-year risk of ischemic stroke: 25%-30% 10-year risk of ischemic stroke: 25%-30% 10-year risk of severe GI bleeds40%-50% 10-year risk of severe GI bleeds40%-50% 10-year risk of severe GI bleeds40%-50% 10-year risk of severe GI bleeds40%-50% 30%-40% 30%-40% 30%-40% 30%-40% 20%-30% 20%-30% 20%-30% 20%-30% 15%-20% 15%-20% 15%-20% 15%-20% 10%-15% 10%-15% 10%-15% 10%-15% 5%-10% 5%-10% 5%-10% 5%-10% 1%-5% 1%-5% 1%-5% 1%-5% 0%-1% 0%-1% 0%-1% 0%-1% 0%-1% 1%-3% 3%-5% 5%-10% 10%-15% 15%-20% 20%-25% 25%-30% 0%-1% 1%-3% 3%-5% 5%-10% 10%-15% 15%-20% 20%-25% 25%-30% 0%-1% 1%-3% 3%-5% 5%-10% 10%-15% 15%-20% 20%-25% 25%-30% 0%-1% 1%-3% 3%-5% 5%-10% 10%-15% 15%-20% 20%-25% 25%-30% 10-year risk of MI 10-year risk of MI 10-year risk of MI 10-year risk of MI Lab research Synthesis and multidimensional assessment Epidemiological & Clinical research
  • 15.
    Moderate or severe exacerbation Acutepancreatitis Insomnia Anxiety Depression Suicide (completed) Diarrhea Nausea Weight loss Headache Dizziness Benefits and harms of roflumilast Yu T, Fain K, Boyd CM, Singh S, Weiss CO, Li T, Varadhan R, Puhan MA. Thorax 2014, doi: 10.1136 FDApivotal and safety pool COPD observational studies Placebo groups of RCTs Survey (preferences) Observationalstudies (clustering events) Outcome risks Estimates of effect Absolute effects Benefit harm analysis Importance of Outcomes Lab research Synthesisand multidimensional assessment Epidemiological & Clinical research
  • 16.
    Net benefit-harm index*per 10,000 patients treated over 1 year by patient profiles Type of analysis Patients' projected 1-year risk of having ≥1 moderate or severe COPD exacerbation 30% 60% 90% Men Women Men Women Men Women Age <65 ≥65 <65 ≥65 <65 ≥65 <65 ≥65 <65 ≥65 <65 ≥65 Analysis I: Equal weights 0.0 0.0 0.0 0.0 0.0 0.0 0.0 0.0 0.0 0.0 0.0 0.0 Analysis II: Weights based on importance of outcomes 0.0 0.0 0.0 0.0 0.0 0.0 0.0 0.0 0.0 0.0 0.0 0.0 Analysis III (main analysis): Weights based on importance and co-occurrence of harm outcomes 0.0 0.0 0.0 0.0 0.0 0.0 0.0 0.0 0.0 0.0 0.0 0.0 Probability that roflumilast overall beneficial Yu T, Fain K, Boyd CM, Singh S, Weiss CO, Li T, Varadhan R, Puhan MA. Thorax 2014, doi: 10.1136 Lab research Synthesisand multidimensional assessment Epidemiological & Clinical research
  • 17.
    Probability that roflumilast is beneficial Preventionof severe exacerbations (requiring admission) Lab research Synthesis and multidimensional assessment Epidemiological & Clinical research Yu T, et al. Thorax 2013, doi: 10.1136
  • 18.
    Lab research Synthesis and multidimensional assessment Epidemiological& Clinical research Well-defined translational paths Exacerbations Favors treatment Favors control 0.5 0.7 1 1.5 2 <1 1-5 6-10 11-15 16-20 21-30 61-80 >80 <1 1-3 3-5 6-10 11-15 16-20 21-25 26+
  • 19.
    Great importance ofrisk prediction Lab research Synthesis and multidimensional assessment Epidemiological & Clinical research <1 1-5 6-10 11-15 16-20 21-30 61-80 >80 <1 1-3 3-5 6-10 11-15 16-20 21-25 26+ Mortality: BODE, ADO, HADO, Briggs Exacerbations: DOSE, SAFE, Briggs Health status: HADO, Siebeling Harm outcomes: COPD observational studies, RCT control groups, registries
  • 20.
    Prediction models ofthe future? Rigorous evaluation is critical Mean predicted risk: 10.5% Mean observed risk: 8.2% HL: p<0.0001 0 10 20 30 40 Observed risk of acute renal failure in % 0 10 20 30 40 Predicted risk of acute renal failure in % 0.00 0.25 0.50 0.75 1.00 Sensitivity 0.00 0.25 0.50 0.75 1.00 1 - Specificity Area under curve 0.76 (95% CI 0.71-0.81) <1 1-5 6-10 11-15 16-20 21-30 31-40 >40 10 year risk for severe GI bleed 10 year risk for MI <1 1-3 3-5 6-10 11-15 16-20 21-25 26+ Current COPD models Current COPD models + biomarkers Current COPD models + genetics Only genetics Lab research Synthesis and multidimensional assessment Epidemiological & Clinical research
  • 21.
    Model update withnew predictors (e.g. biomarkers) and correct re-classification <1 1-5 6-10 11-15 16-20 21-30 31-40 >40 10 year risk for severe GI bleed 10 year risk for MI <1 1-3 3-5 6-10 11-15 16-20 21-25 26+ Manolio TA. N Engl J Med 2010;363:166-176. Lab research Synthesis and multidimensional assessment Epidemiological & Clinical research
  • 22.
    Thomsen et al.JAMA. 2013;309(22):2353-2361 Lab research Synthesis and multidimensional assessment Epidemiological & Clinical research High CRP, fibrinogen and/or leukocyte count 0: 0.9% 1: 1.8% 2: 3.2% 3: 8.1% Only biomarkers Added value of biomarkers From uni- to multivariate associations
  • 23.
    Lab research Synthesis and multidimensional assessment Epidemiological& Clinical research From associations of 3 biomarkers to risk prediction
  • 24.
    From risk predictionto benefit harm prediction Probability that roflumilast is beneficial Lab research Synthesis and multidimensional assessment Epidemiological & Clinical research
  • 25.
    Testing EBM 2.0: Focuson the individual Exploring what is important Decision making Based on your individual characteristics and what is important for you <1 1-5 6-10 11-15 16-20 21-30 61-80 >80 <1 1-3 3-5 6-10 11-15 16-20 21-25 26+ The chance that you will benefit from drug X is very low (nine out of ten patients like you will experience more harm than benefit) Your risk for a hospital admission because of COPD Your risk for experiencing severe side effects Lab research Synthesis and multidimensional assessment Epidemiological & Clinical research
  • 26.
     Maximizes benefit– minimizes harms for individuals  Links individual characteristics (from molecular to composite level) to treatment oucomes Individual Risk Stratification Personalized through risk stratification and preferences Based on your individual characteristics and what is important for you <1 1-5 6-10 11-15 16-20 21-30 61-80 >80 <1 1-3 3-5 6-10 11-15 16-20 21-25 26+ The chance that you will benefit from drug X is very low (nine out of ten patients like you will experience more harm than benefit) Your risk for a hospital admission because of COPD Your risk for experiencing severe side effects Evidence on treatment effects Patient values & preferences <1 1-5 6-10 11-15 16-20 21-30 61-80 >80 <1 1-3 3-5 6-10 11-15 16-20 21-25 26+ Determinantsof outcome risks & treatment effects Well-defined translational approach to make evidence- based personalized respiratory medicine happen Lab research Synthesis and multidimensional assessment Epidemiological & Clinical research

Editor's Notes

  • #23 1. associations, 2. when added to other predictors; 3.