Download to read offline

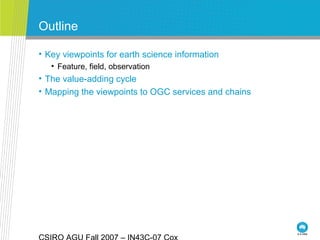
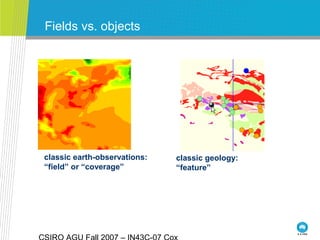
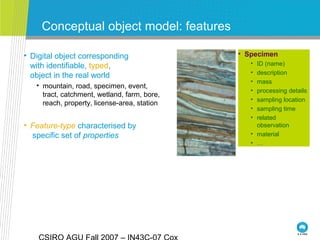
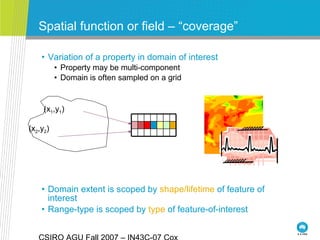
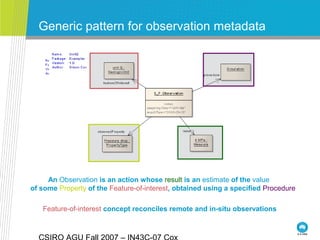
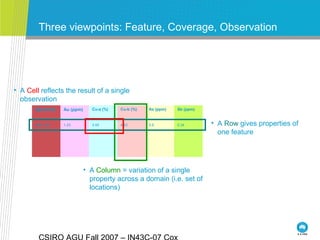
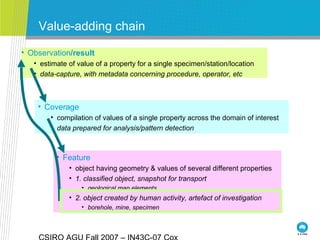
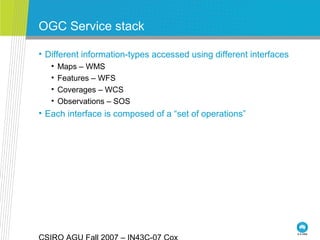
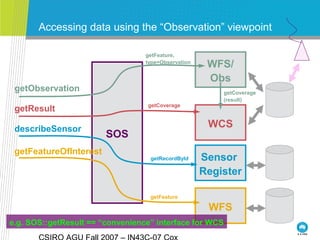
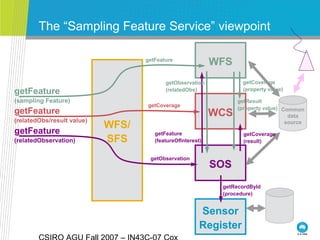
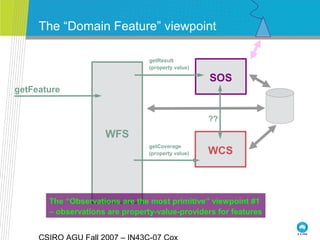
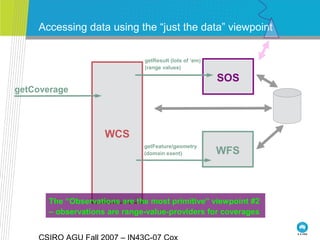

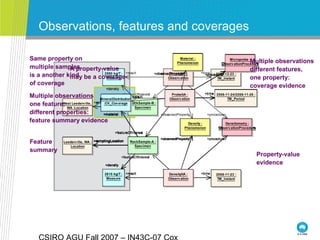
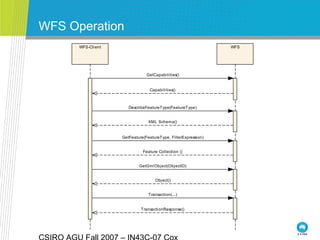
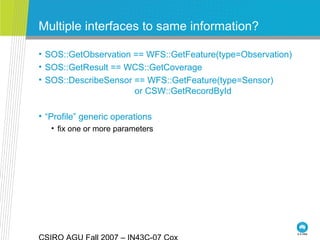

This document discusses three key viewpoints for earth science information: features, fields/coverages, and observations. It describes how these viewpoints can be mapped to OGC services and service chains. Features represent identifiable objects, fields/coverages represent the variation of a property across a domain, and observations provide estimates of feature property values. The viewpoints can be accessed through services like WFS, WCS, and SOS, and composed in different ways depending on the data and application needs.


![Polymer [ बहुलक ] Chemistry Notes PDF - Irfanullah Mehar - JJ Sir Chemistry.pdf](https://cdn.slidesharecdn.com/ss_thumbnails/polymerchemistrynotespdf-irfanullahmehar-jjsirchemistry-260210172118-3f9b37f7-thumbnail.jpg?width=640&height=640&fit=bounds)


