Download as PDF, PPTX
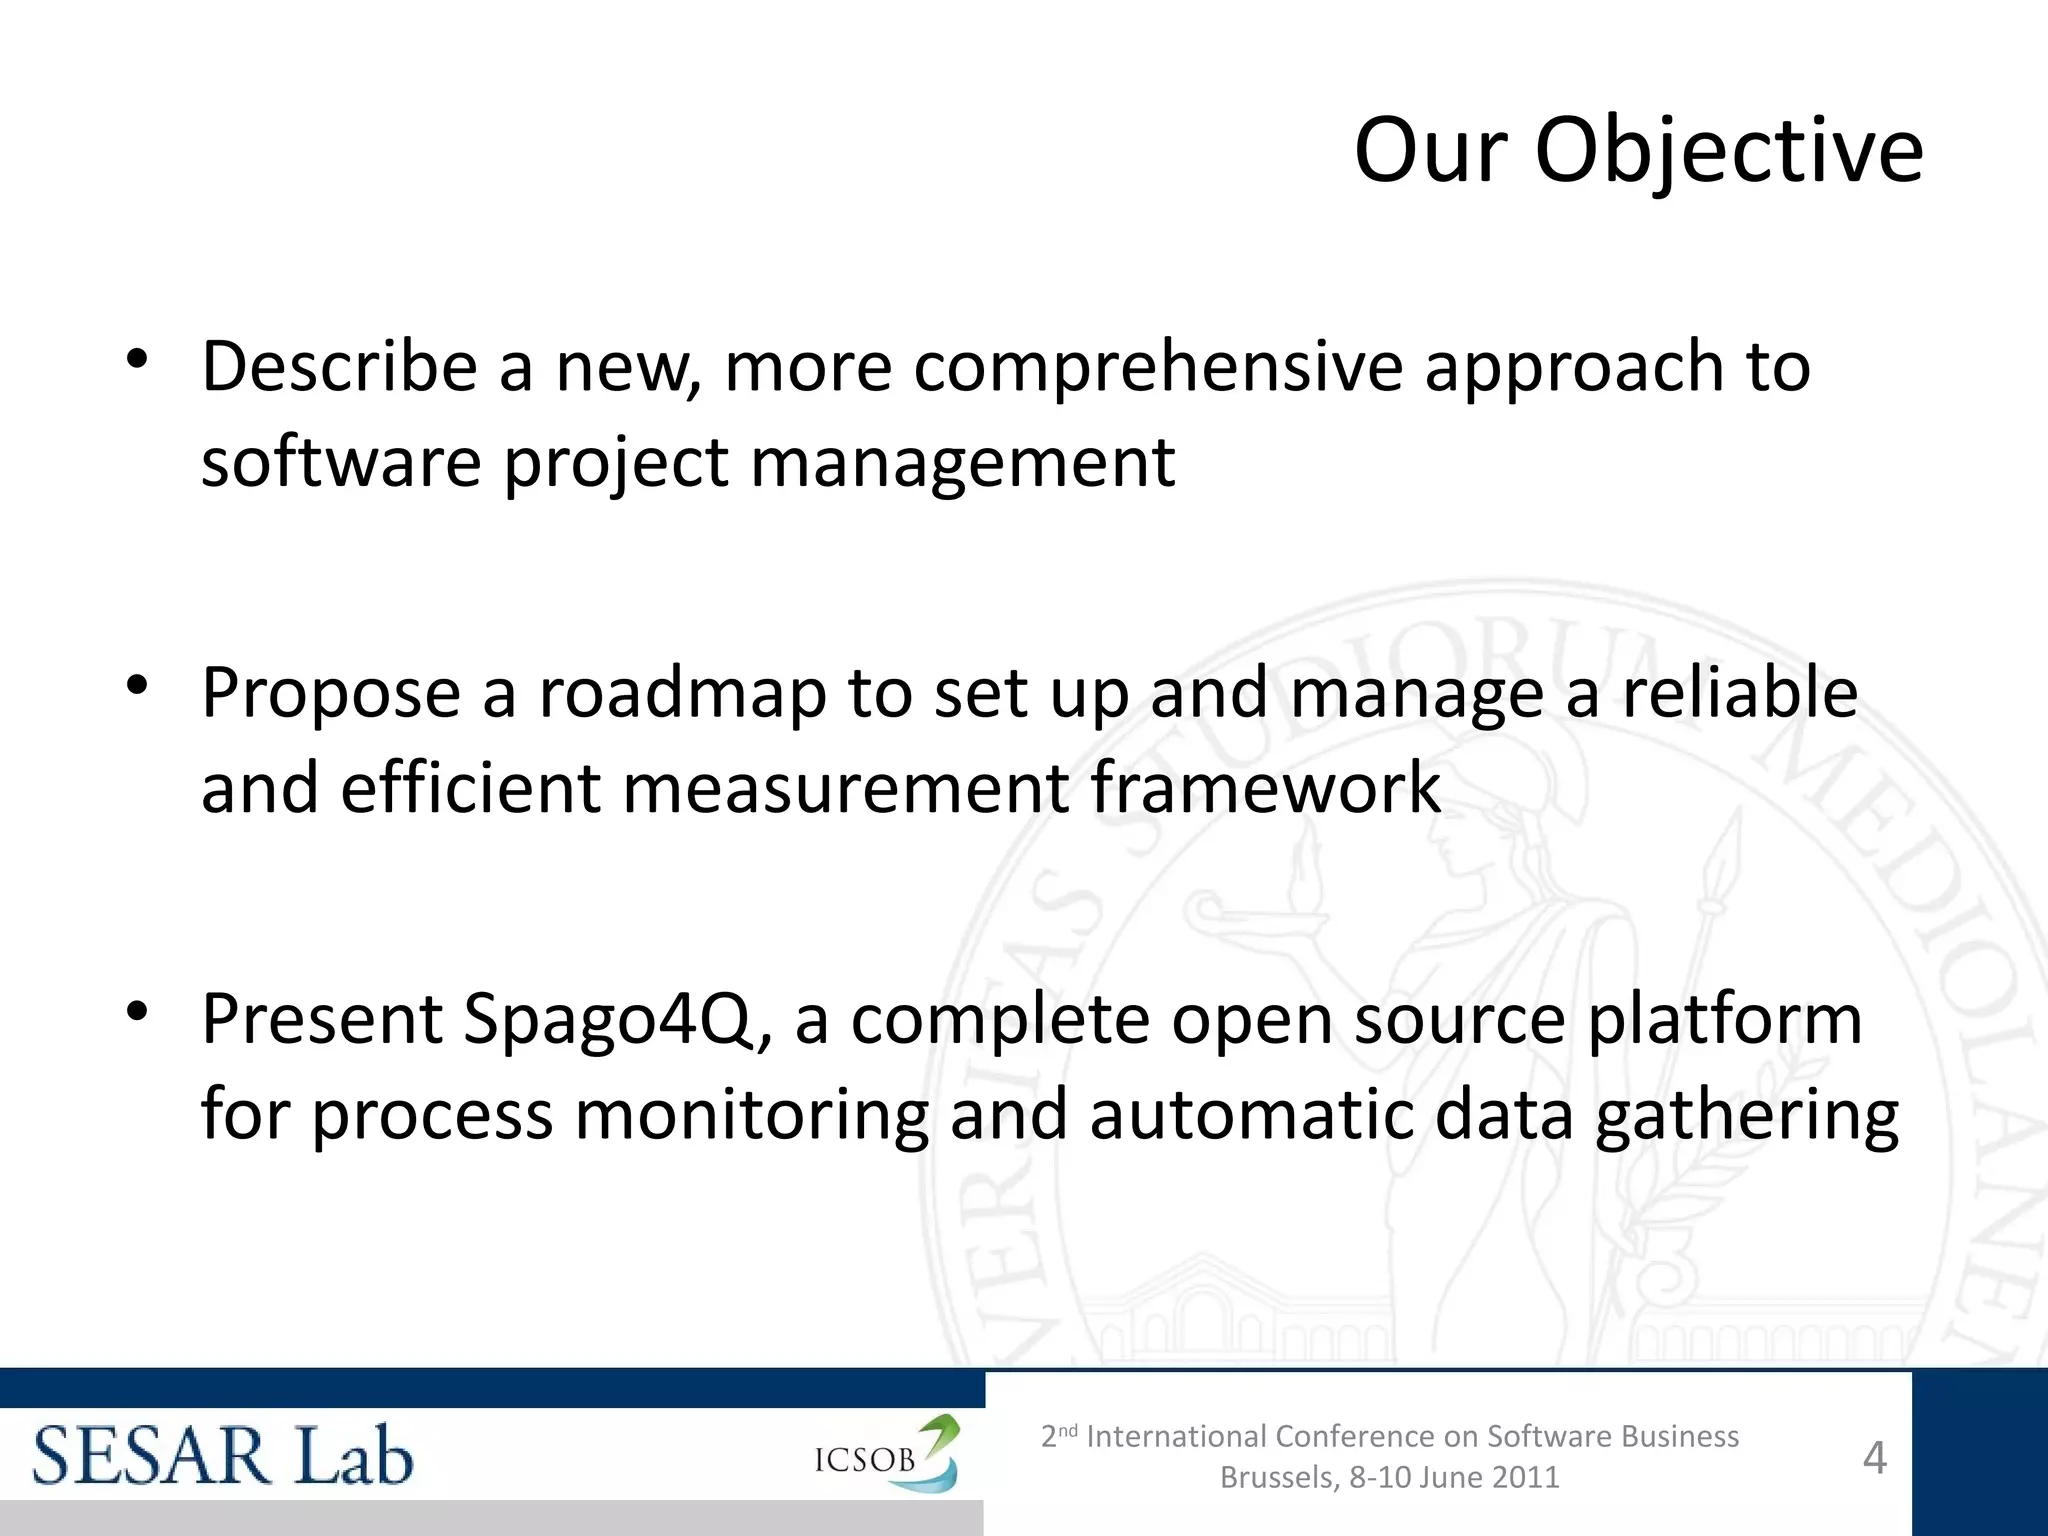
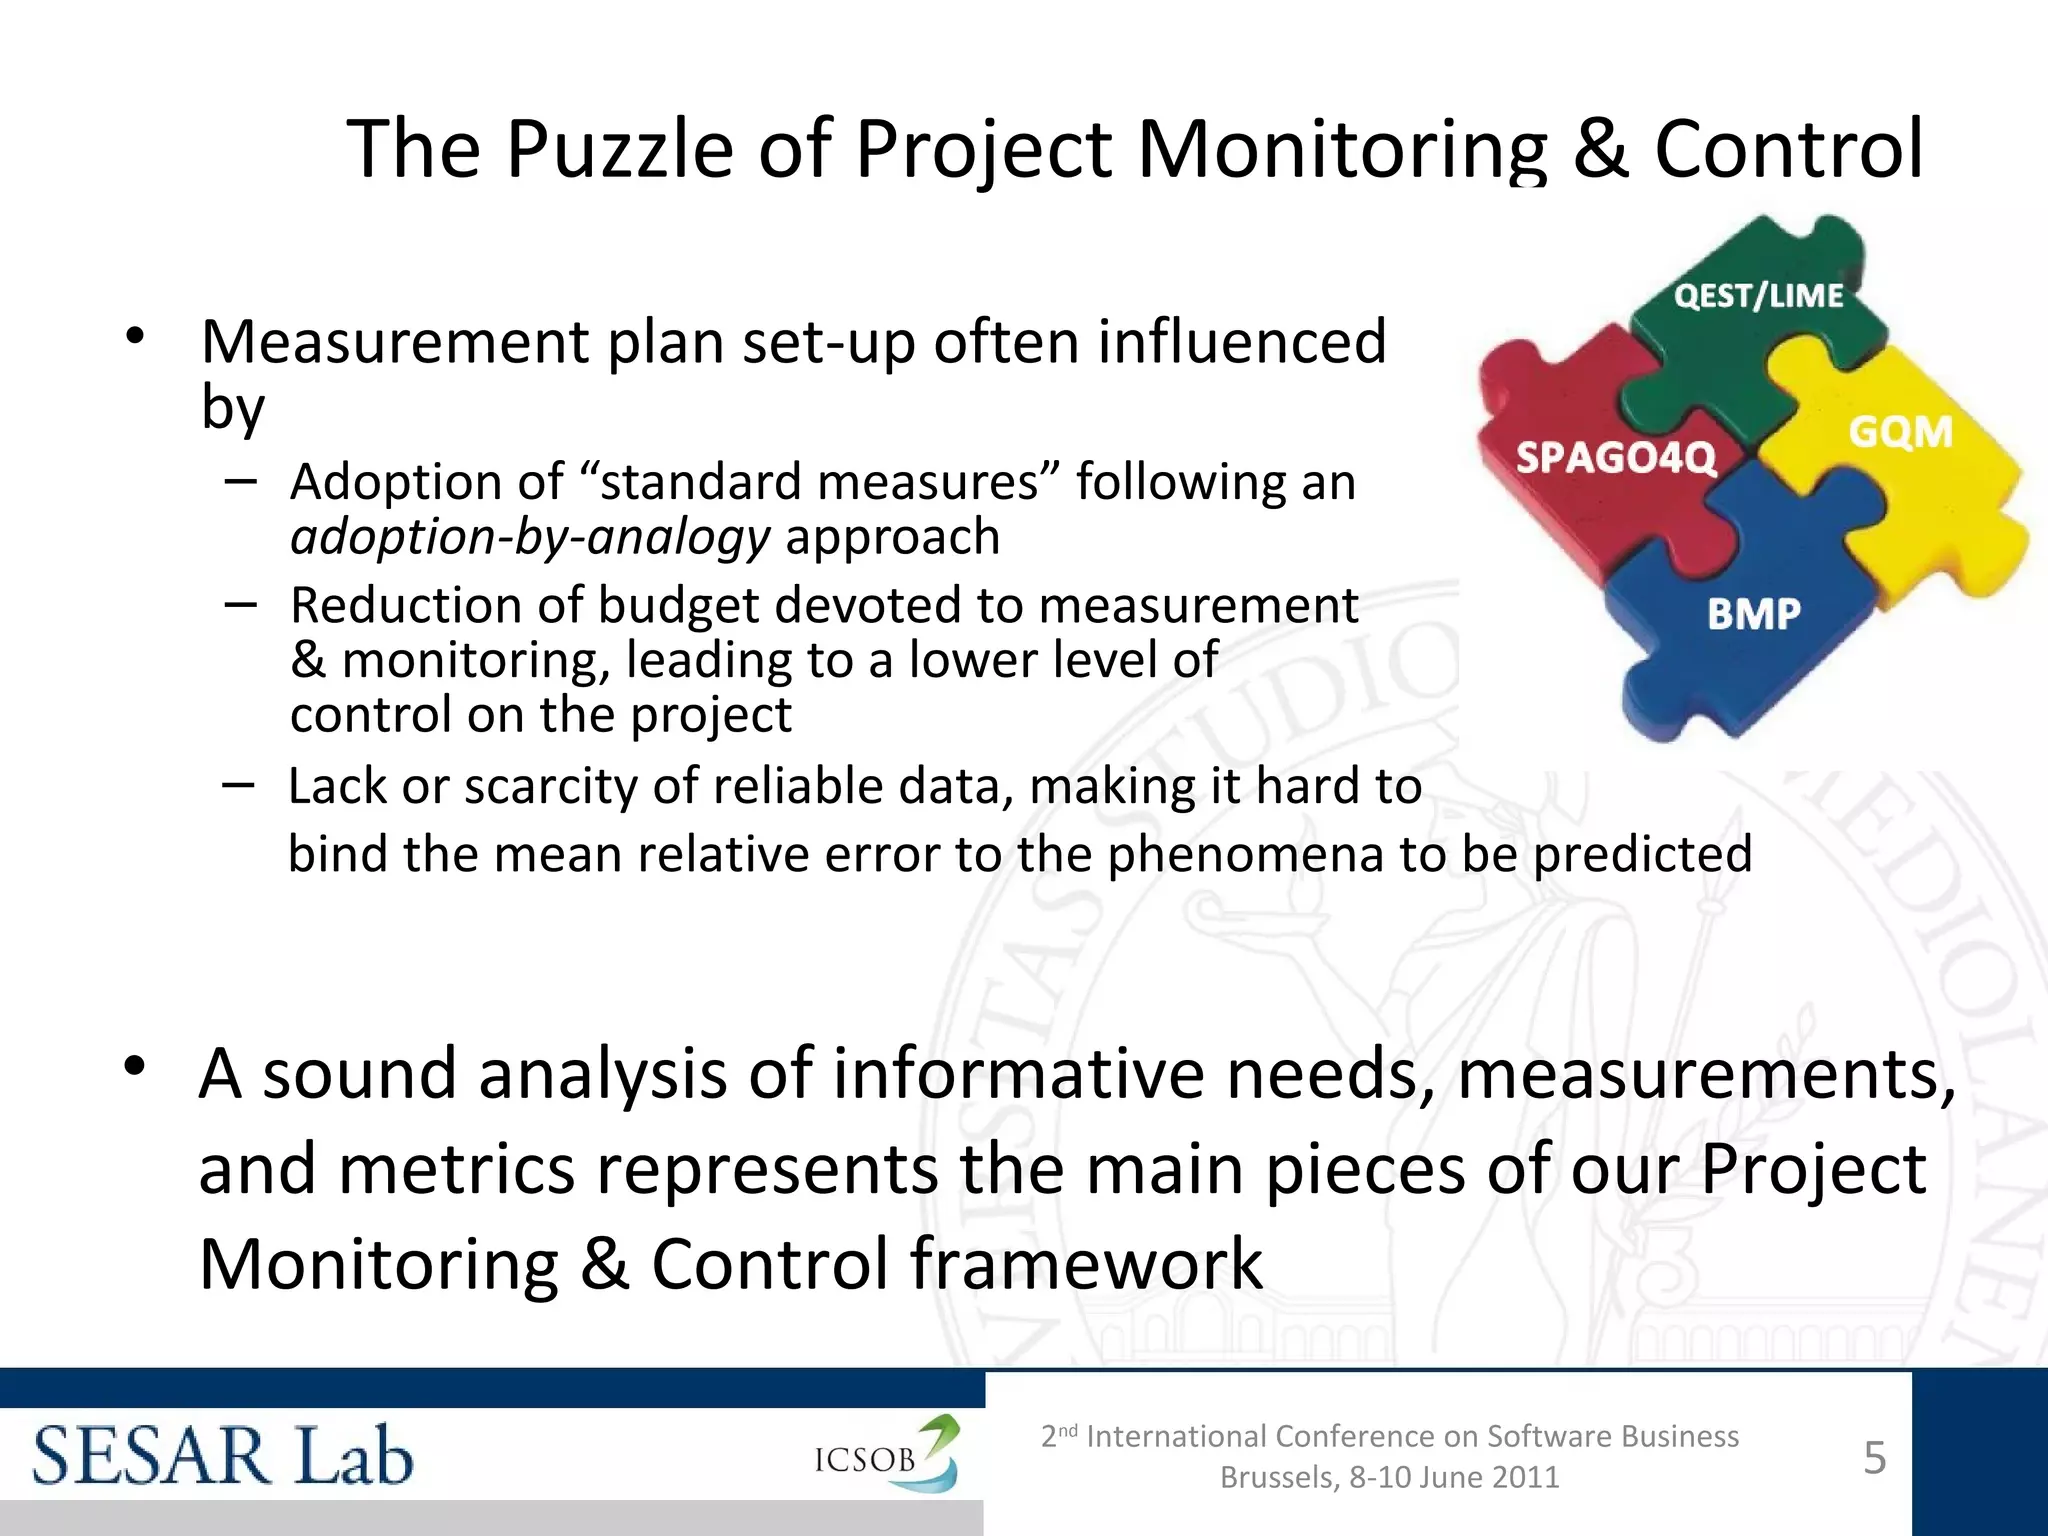
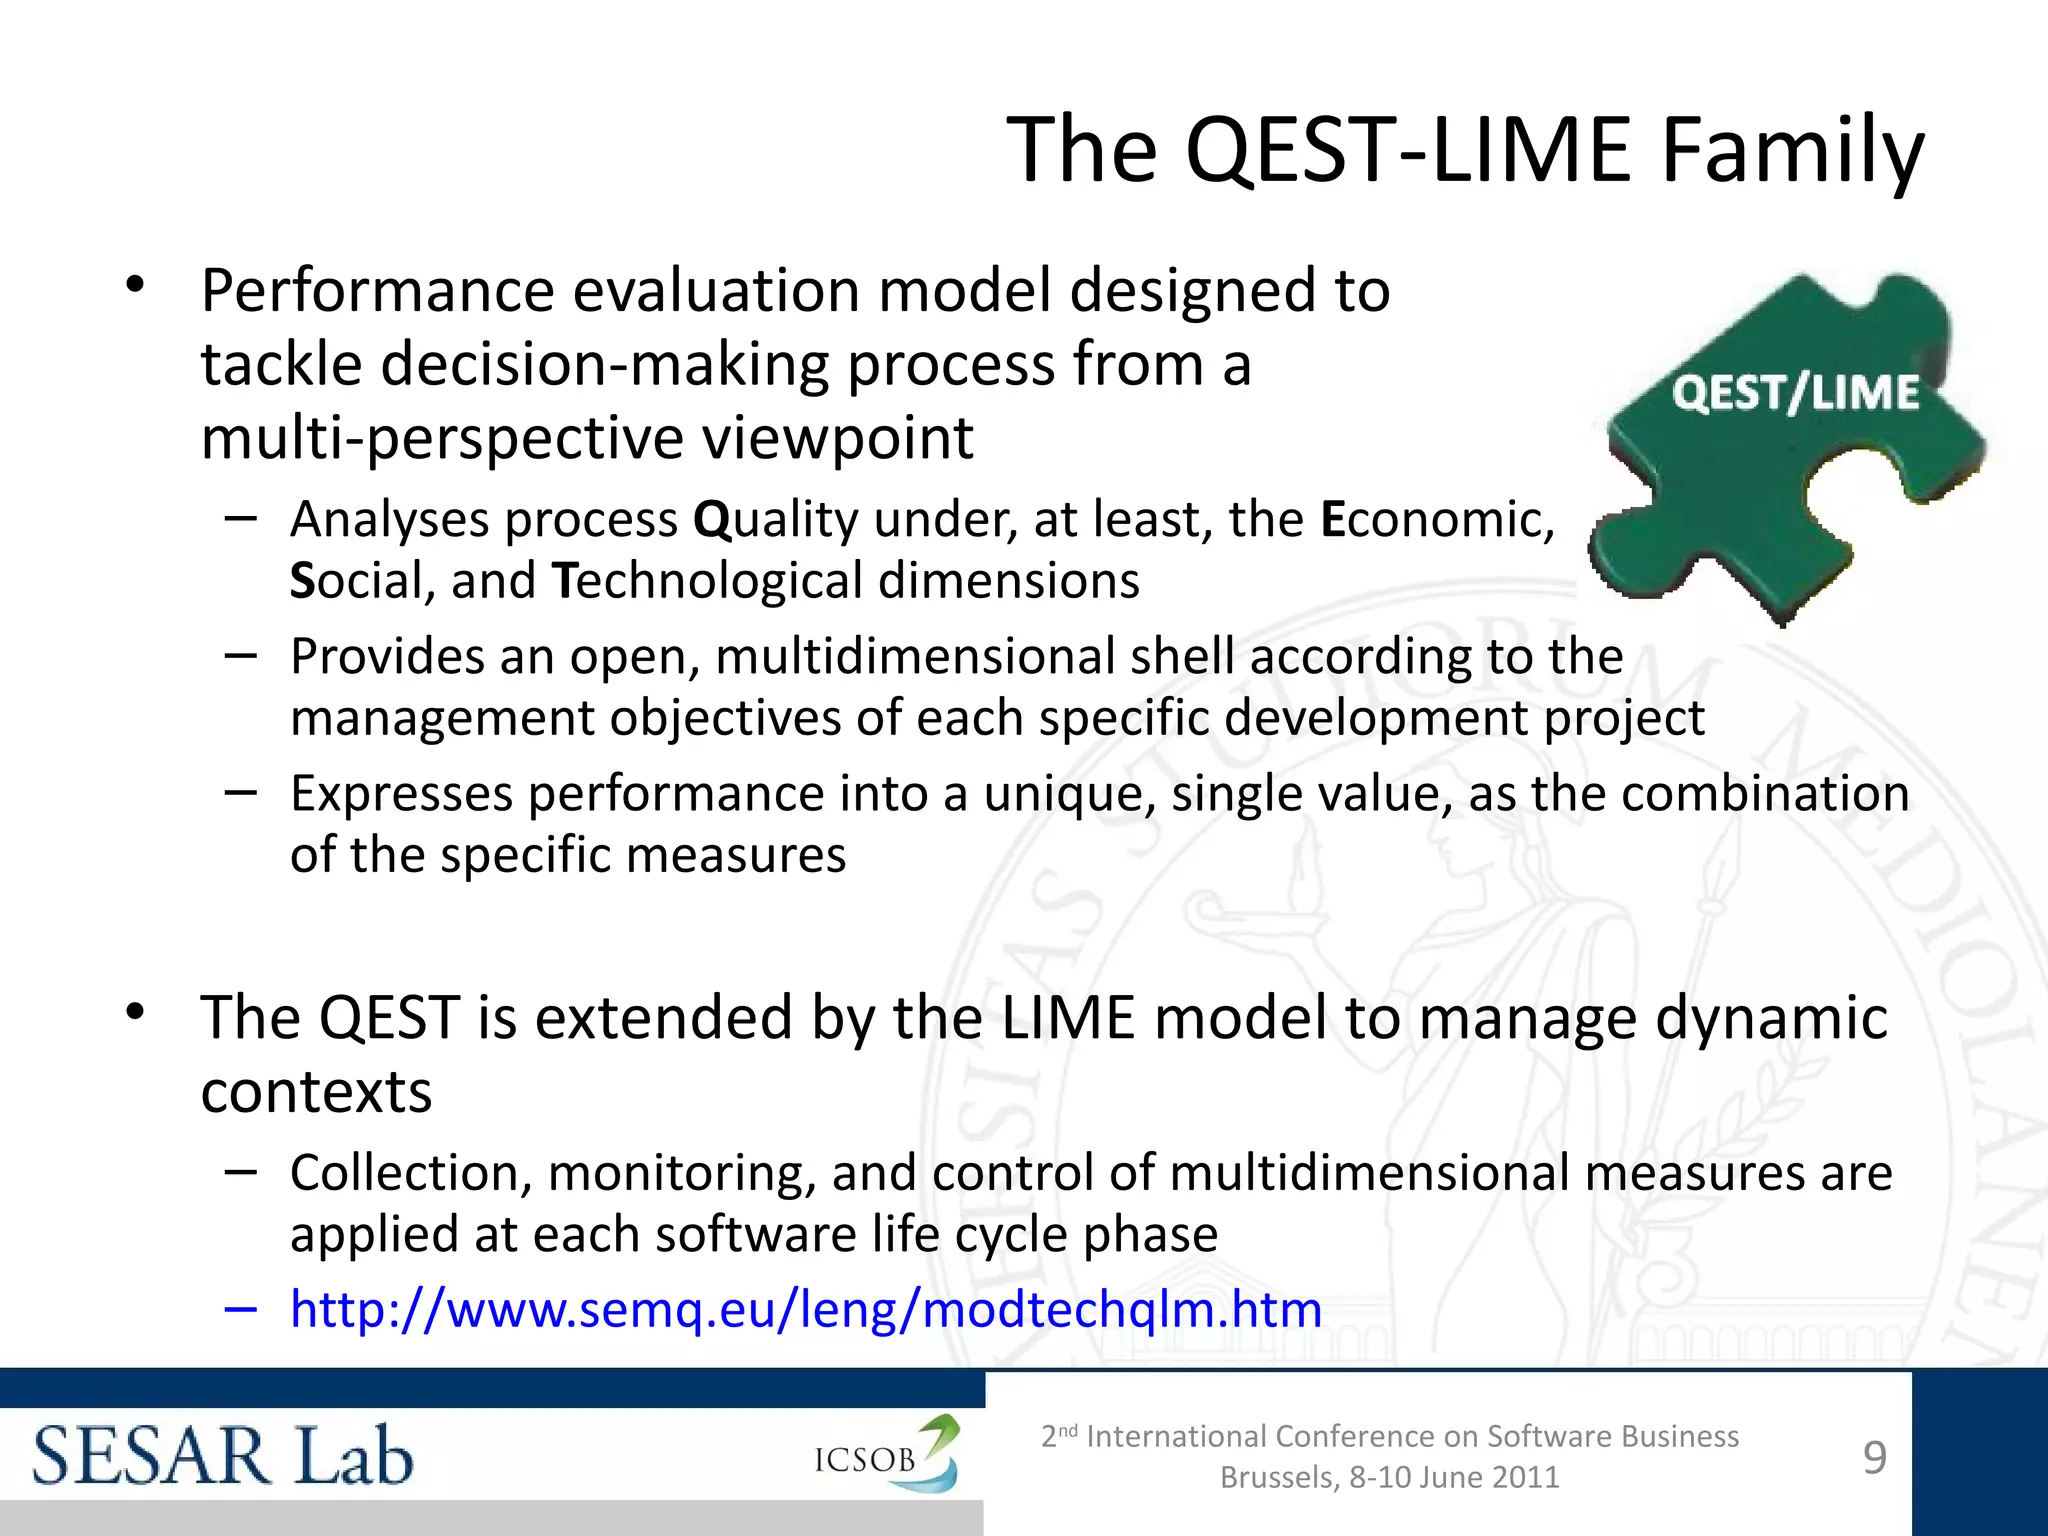
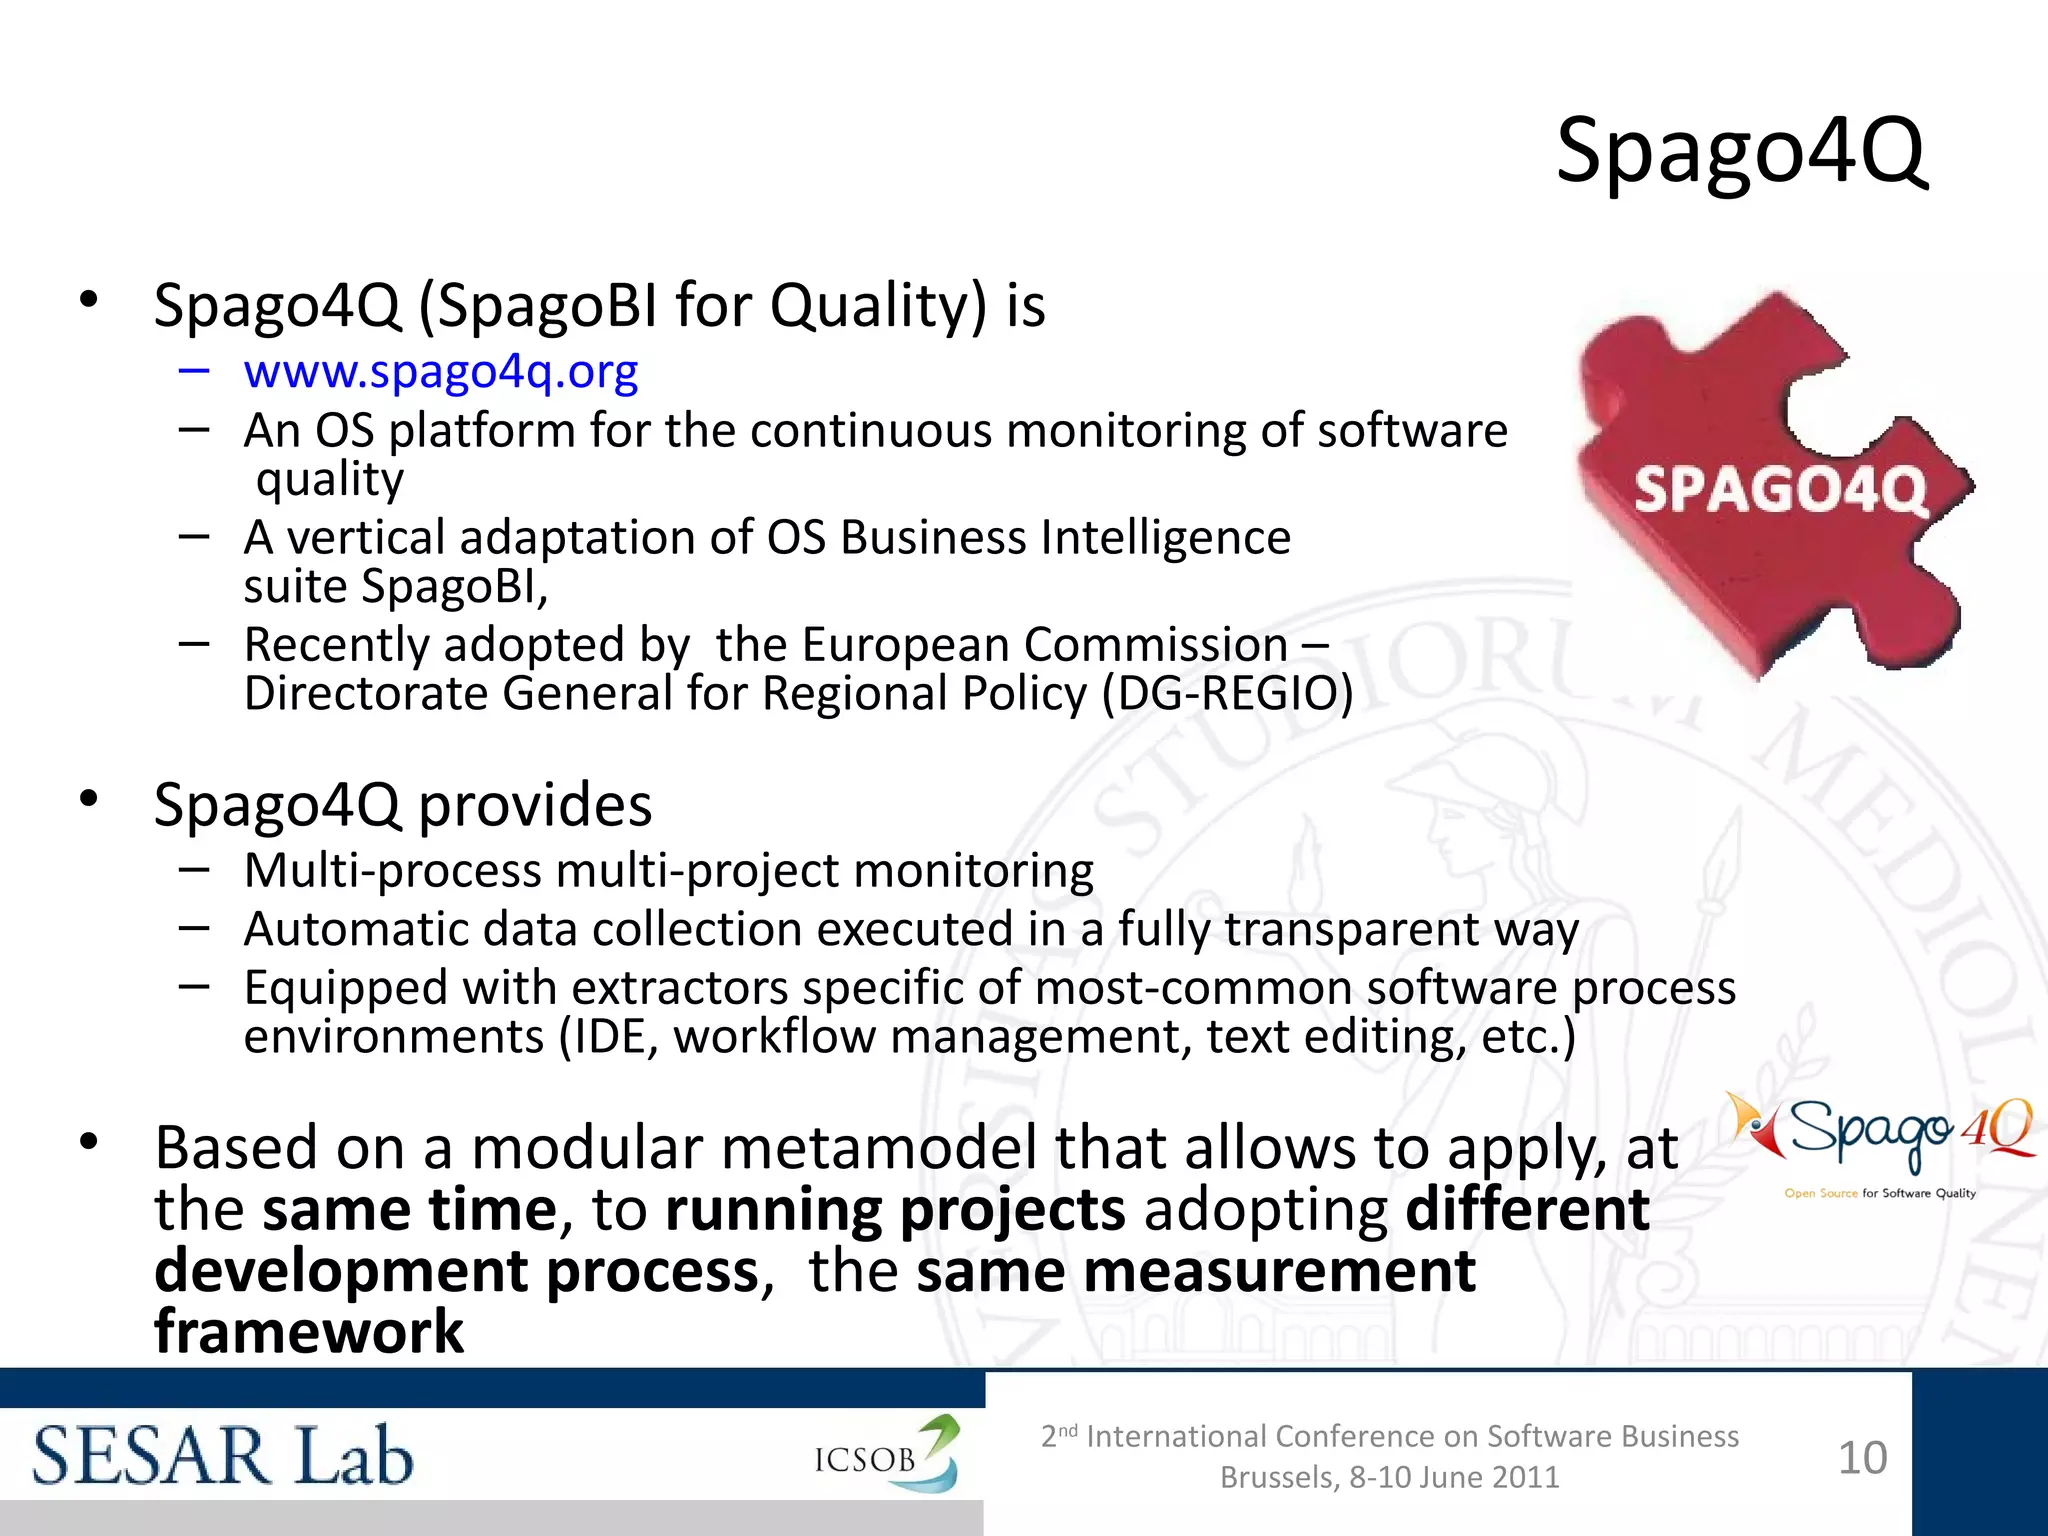
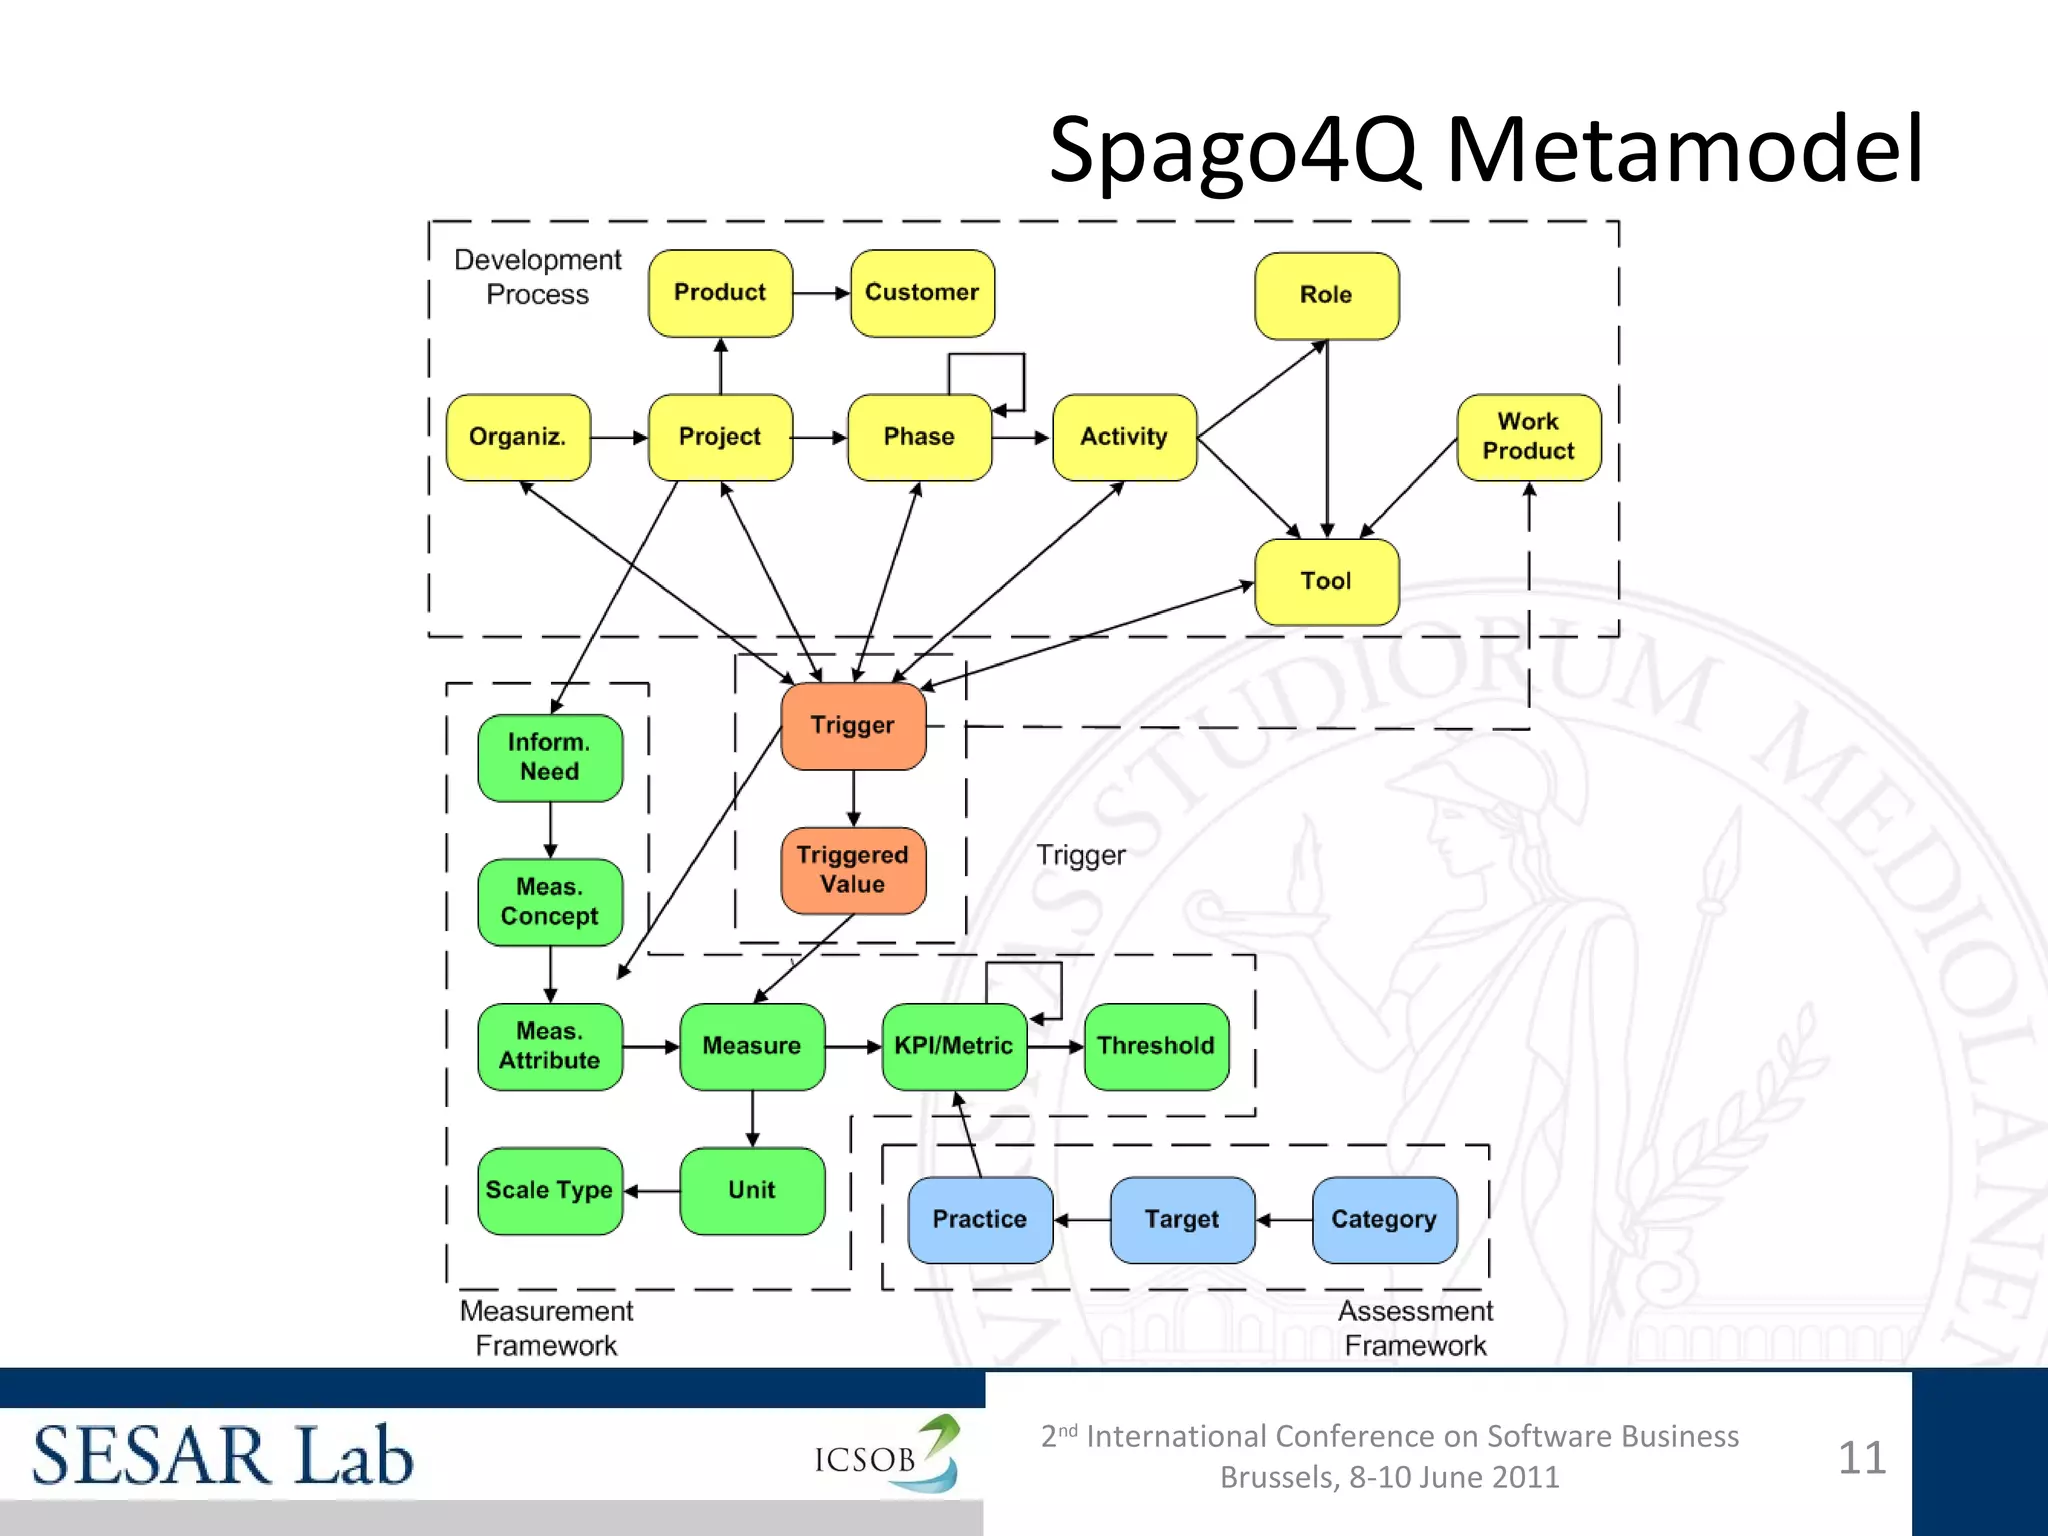
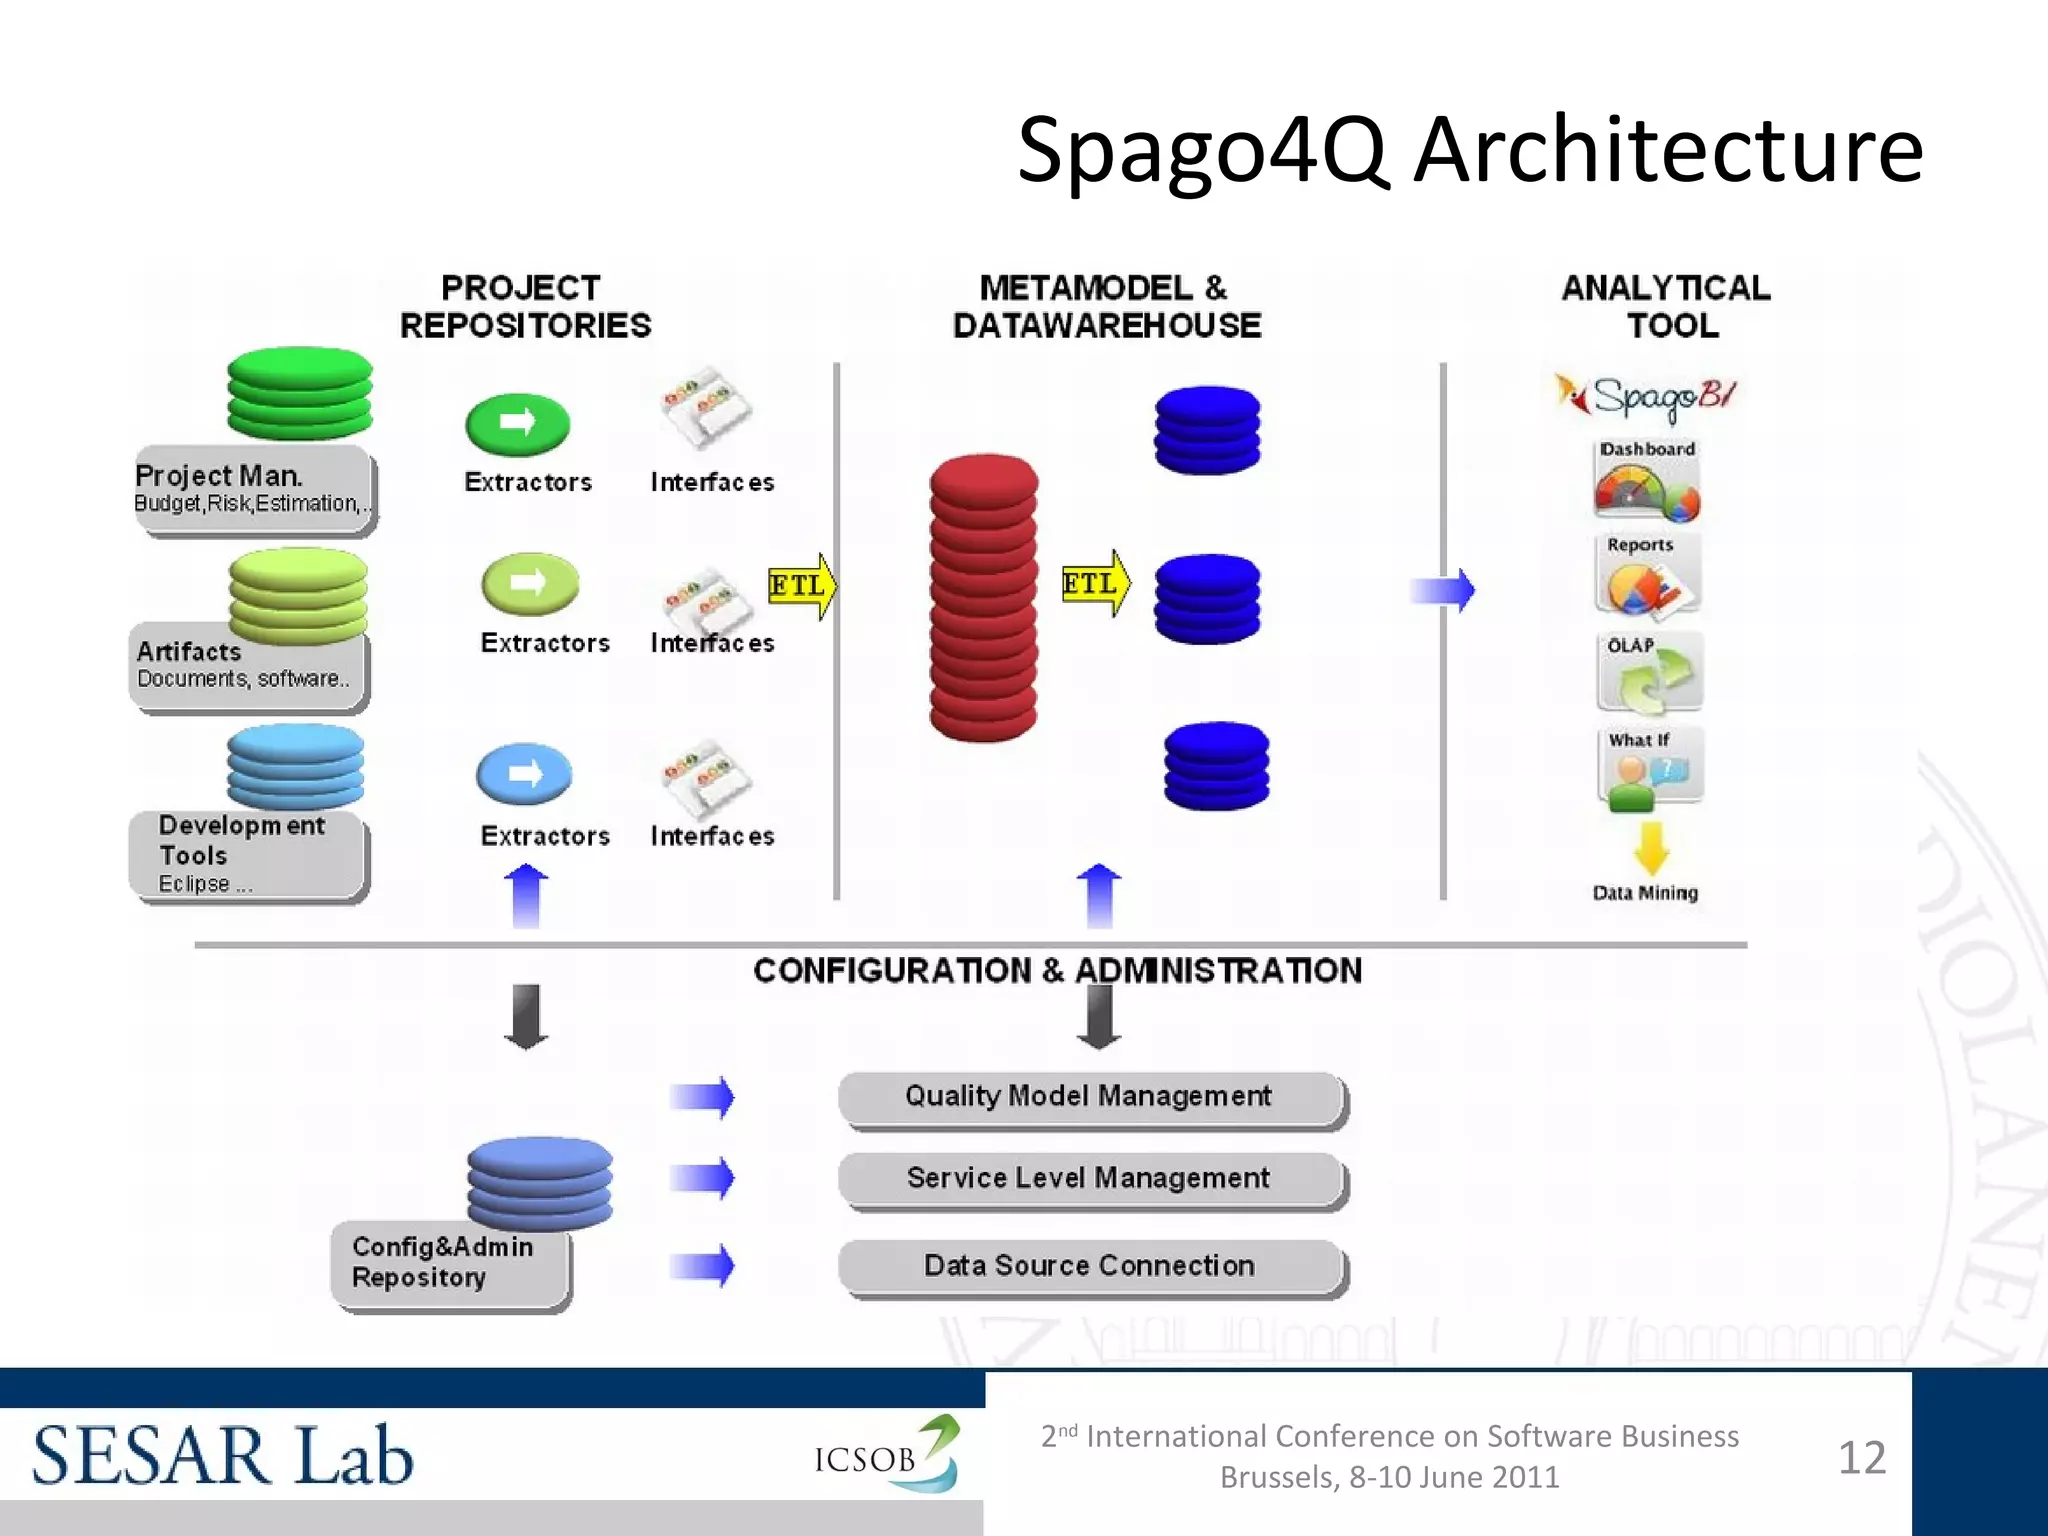
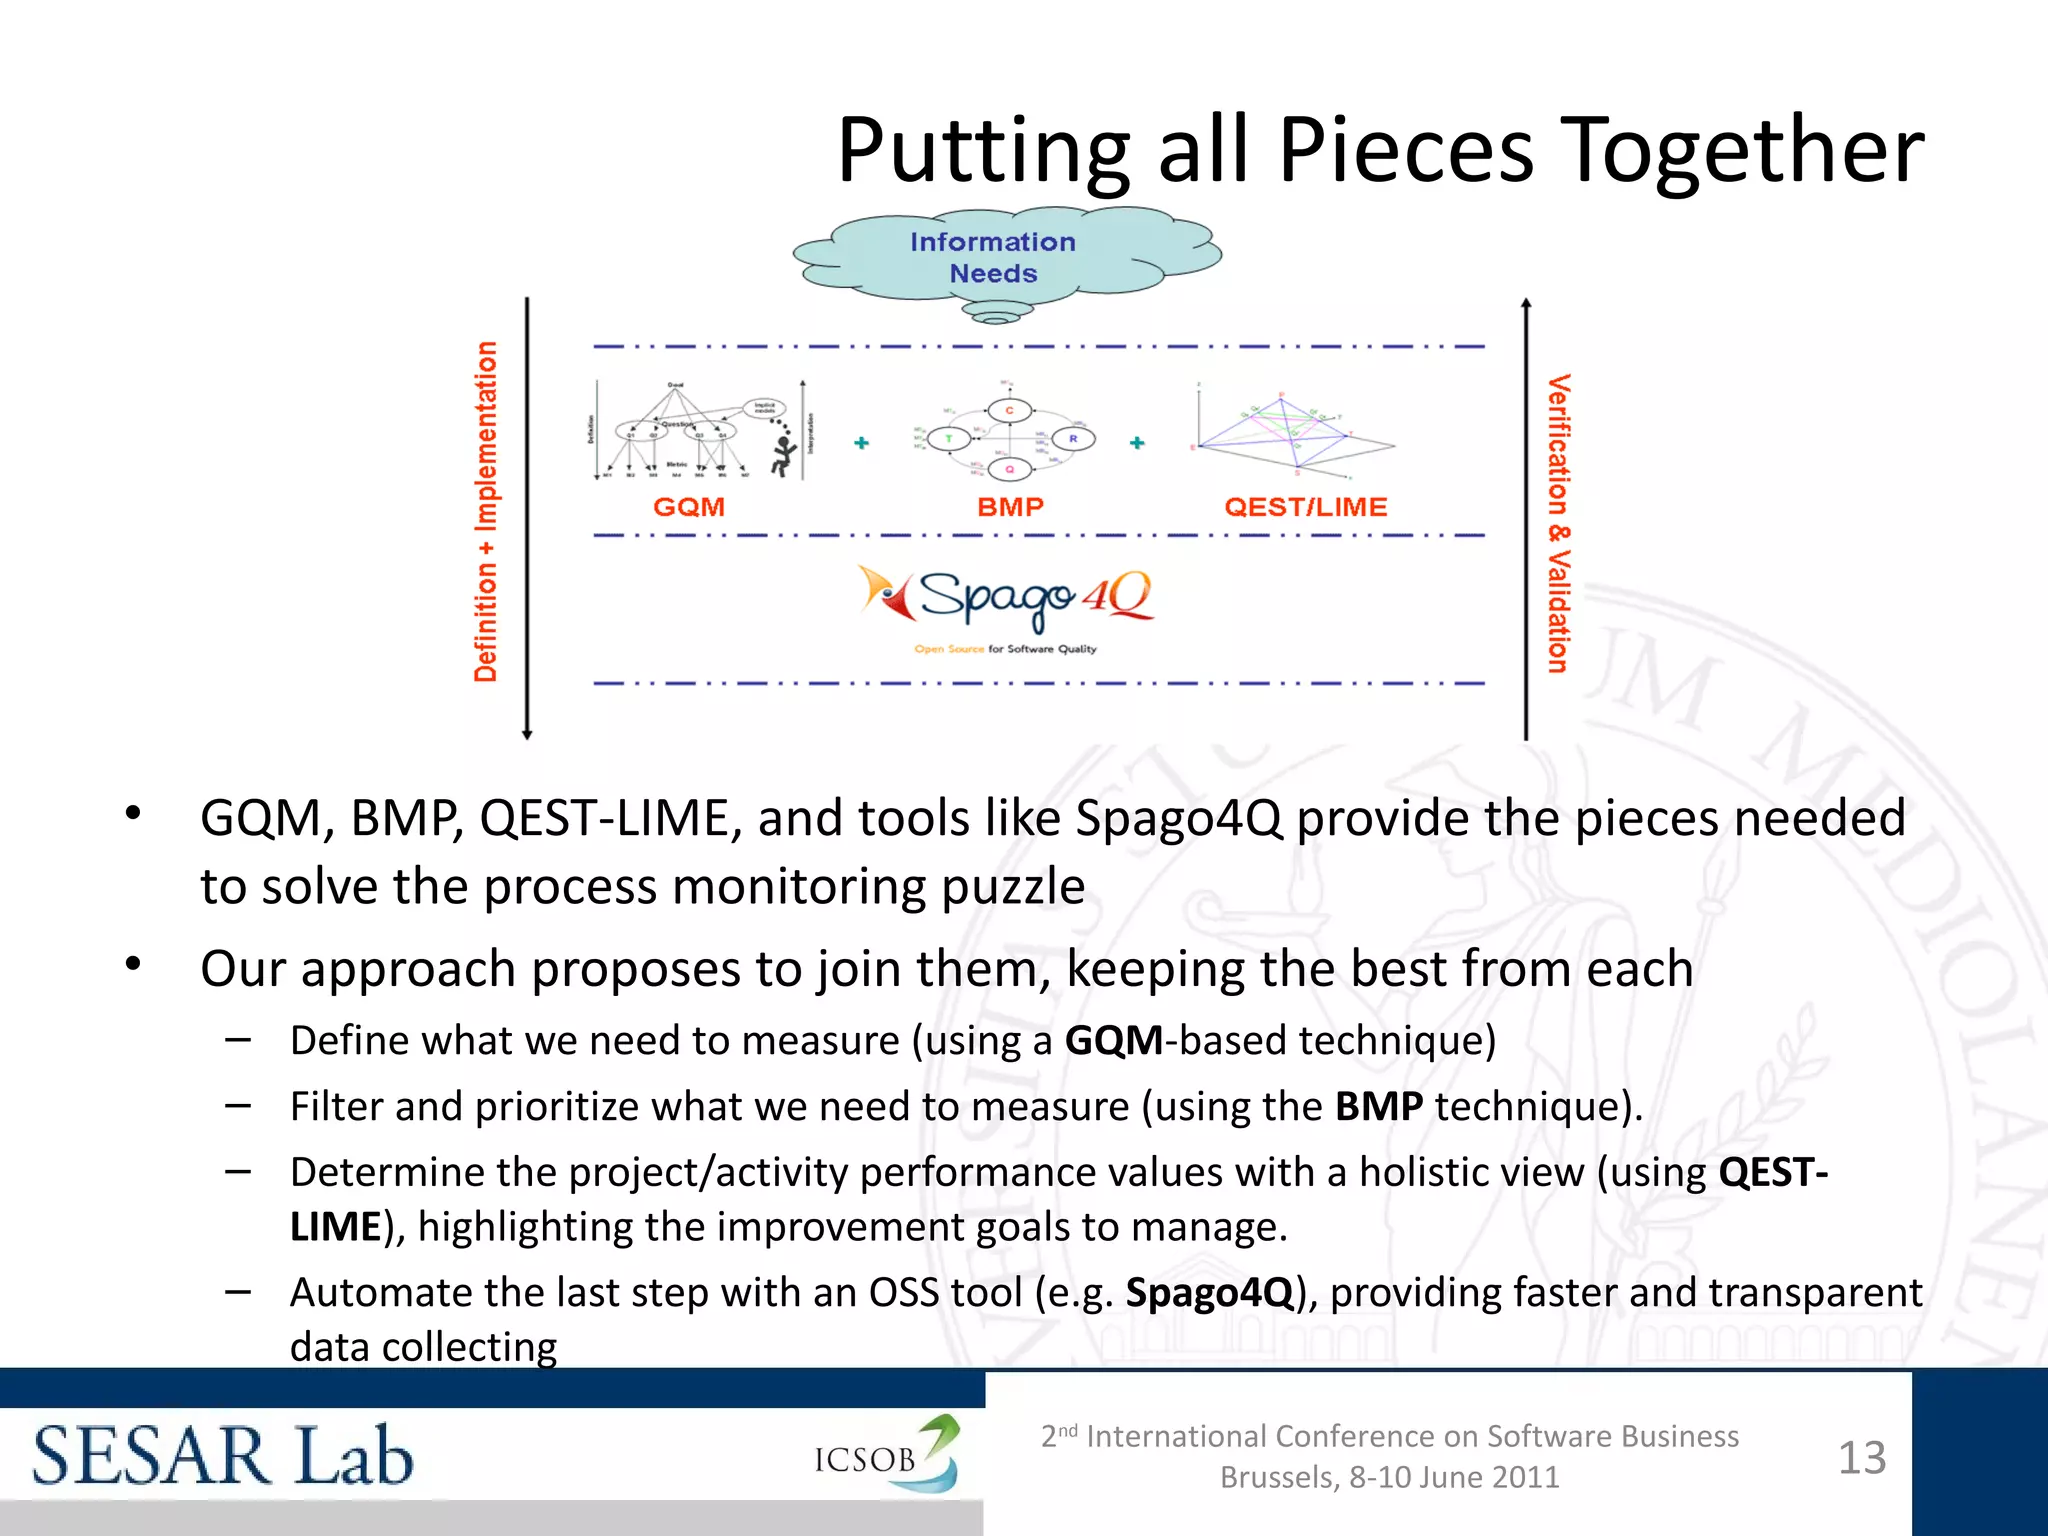
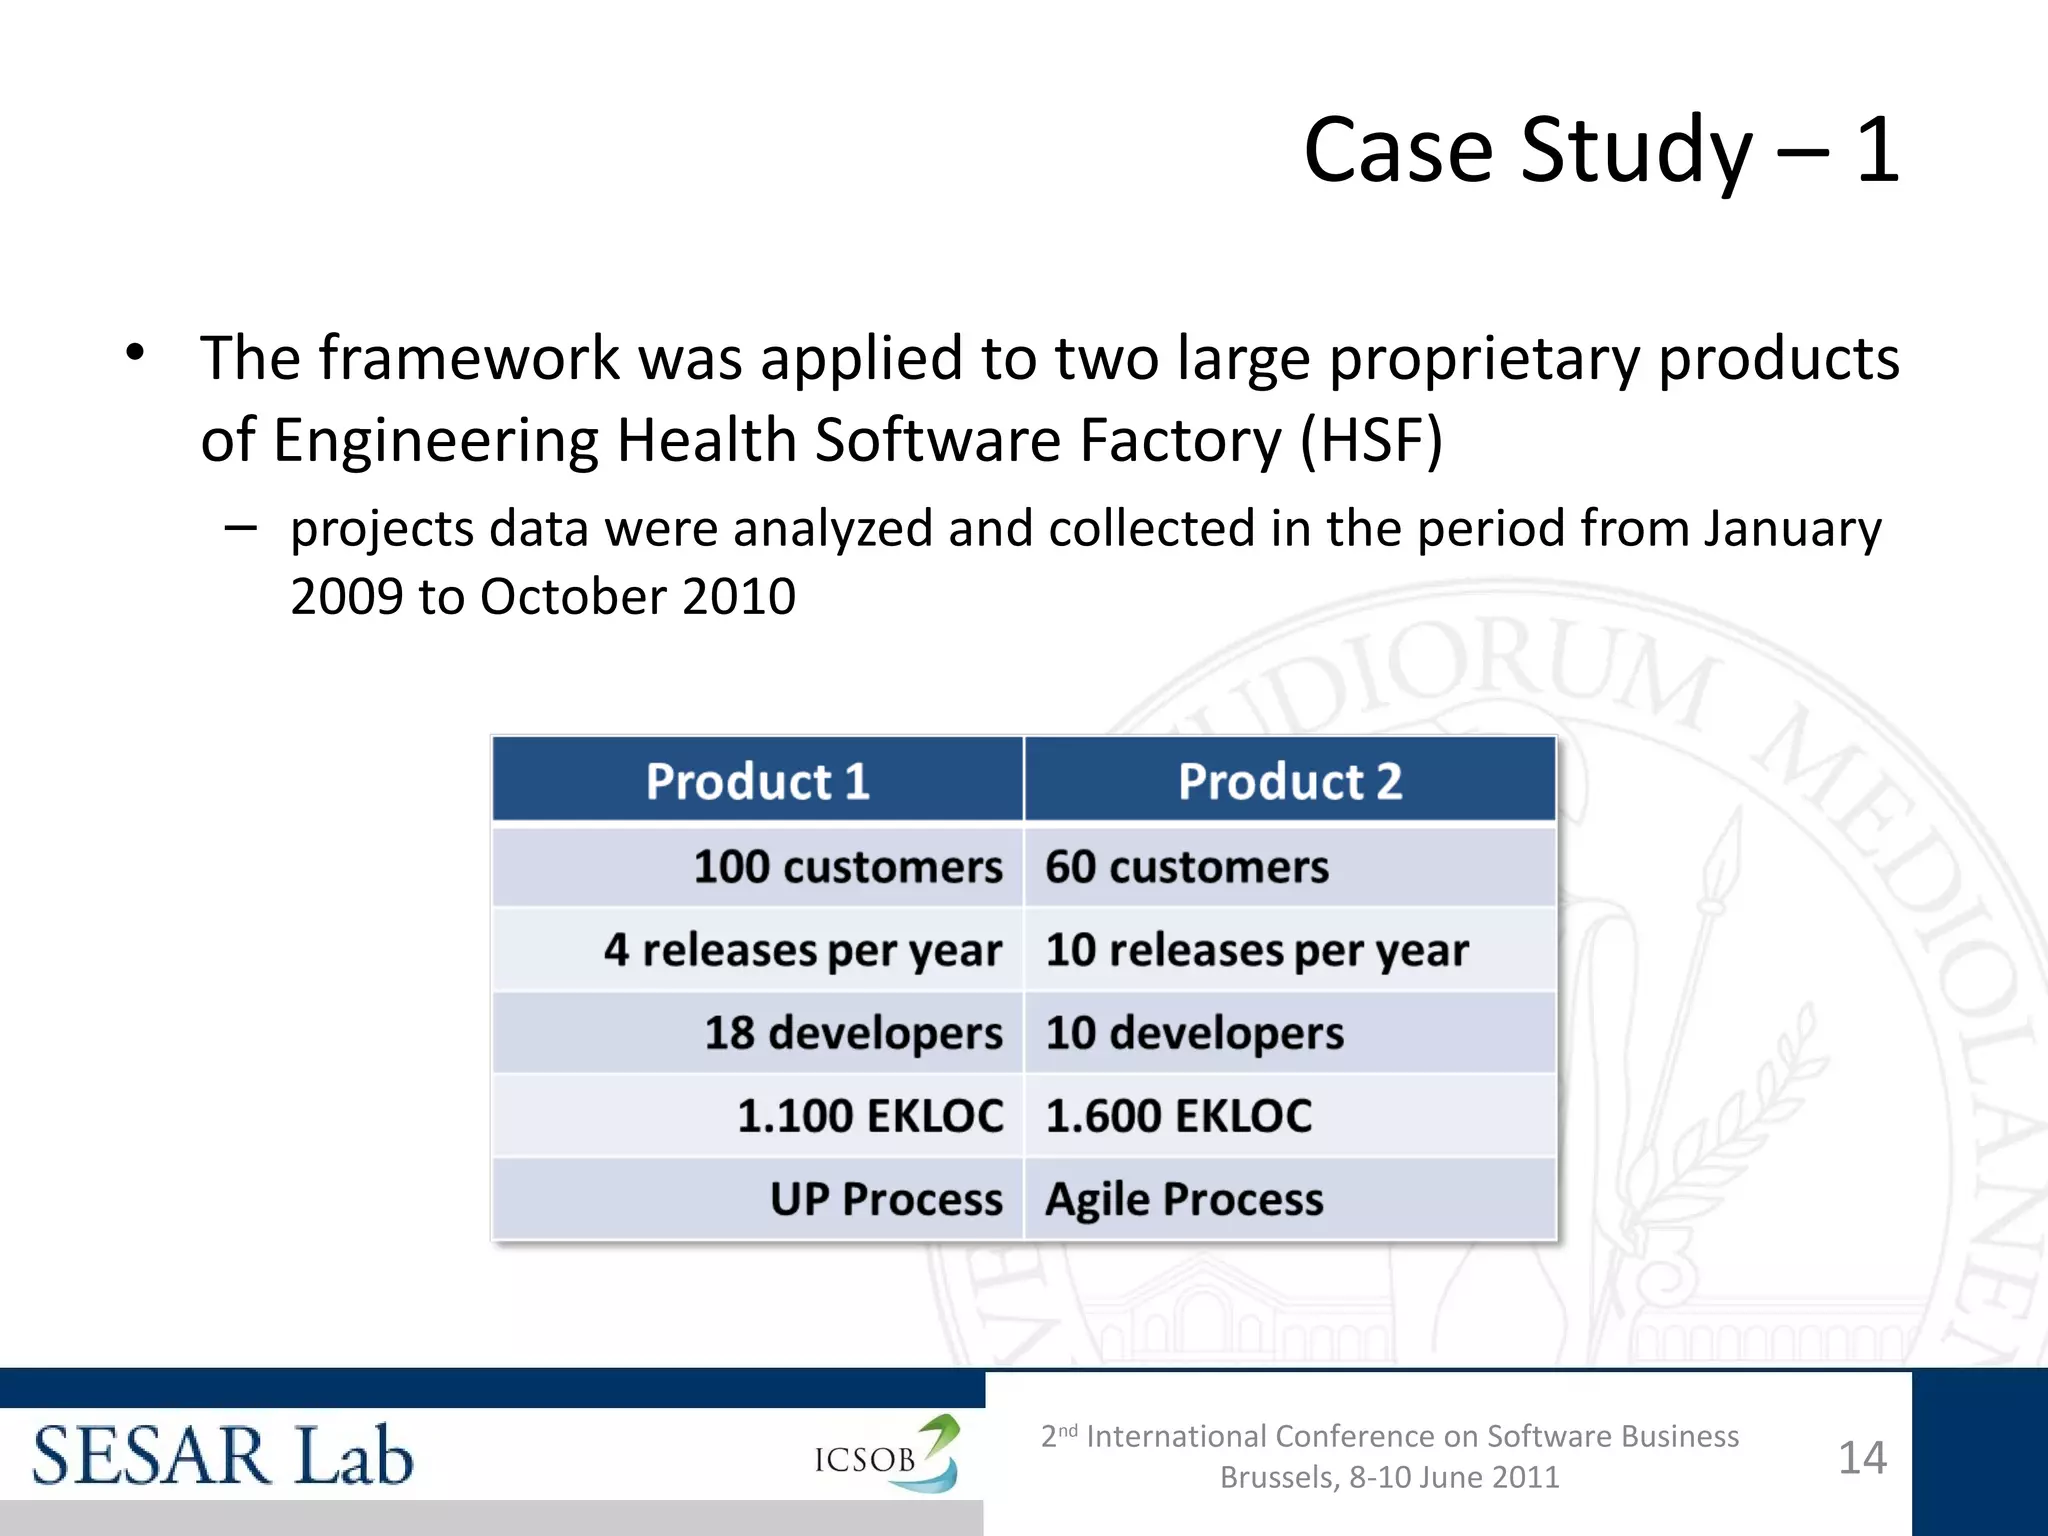


The document discusses a comprehensive approach to software project management, focusing on improving quality and cost-effectiveness through enhanced project monitoring and control strategies. It introduces spago4q, an open-source platform designed for process monitoring and automatic data gathering, and outlines various methodologies such as GQM, BMP, and QEST-LIME for effective measurement strategies. A case study demonstrates the practical application of this framework in software development, leading to improved management of production costs and quality.


![[SEPG Europe 2012] A Multi-Model Case Study: High Maturity in Development + S...](https://cdn.slidesharecdn.com/ss_thumbnails/strongsteppaperpresentationmultimodel20120501finalpresented-120608120351-phpapp01-thumbnail.jpg?width=640&height=640&fit=bounds)


![[QUATIC 2012] A Multi-Model Case Study: High Maturity in Development + Servic...](https://cdn.slidesharecdn.com/ss_thumbnails/strongsteppaperpresentationmultimodelquatic2012v21-120911082655-phpapp02-thumbnail.jpg?width=640&height=640&fit=bounds)