Download to read offline

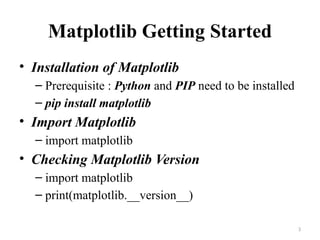
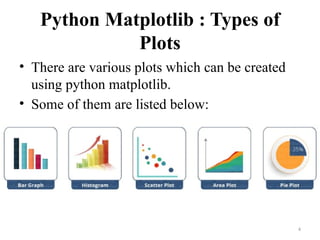


Matplotlib is a low-level graph plotting library in Python used for data visualization across multiple platforms. It requires Python and pip for installation and offers various types of plots for graphical representation. Users can check the installed version of Matplotlib using simple import commands.