2
Contents
Summary Impact Assessment...................................................................................................2
Context.......................................................................................................................................3
Evidence base..........................................................................................................................10
Interactions....................................................................................Error! Bookmark not defined.
Individual benefits ....................................................................................................................50
Risks & Assumptions ...............................................................................................................50
Sensitivity Analysis...................................................................................................................52
Wider Impacts ..........................................................................................................................52
Small and Micro Business Assessment (SAMBA) ..................................................................54
Monitoring & Evaluation...........................................................................................................57
Equalities Analysis ...................................................................................................................59
Annex .......................................................................................................................................71
Annex - Value for Money IA………………………………………………………………………74
Annex - Small Pension Pots IA………………………………………………………………...128
Annex - Guided Retirement IA…………………………………………………………………215
Annex - DC Megafunds IA………………………………………………………………………267
Annex - DB Superfunds IA………………………………………………………………..........326
Annex - DB Surplus IA…………………………………………………………………….........376
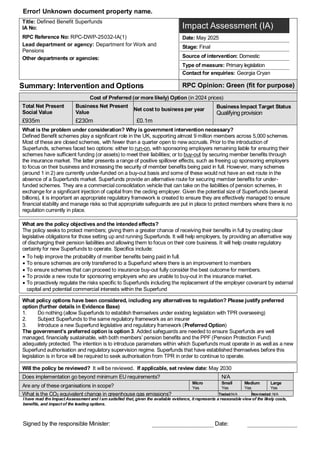
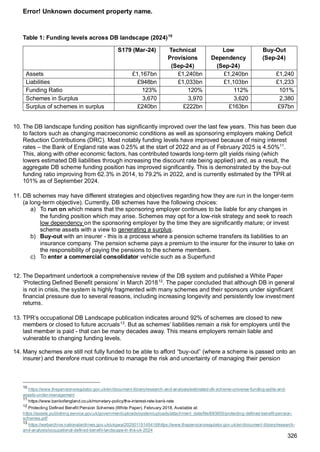
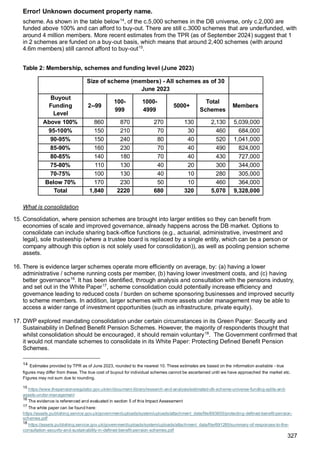
Title: Pension Schemes Bill – Impact Assessment
RPC Reference No: RPC-DWP-25032-IA(1)
RPC Opinion: Green (fit-for-purpose)
3.
3
Summary Impact Assessment
1.The Pension Schemes Bill has 12 policies aimed at improving both the Defined Contribution
and Defined Benefit markets. The focus is on reshaping the pensions landscape with the Bill
seeking to:
▪ Build a pension market with fewer, larger, and better pension providers with the
scale and capability to invest in a wider range of asset classes.
▪ Deliver stronger member outcomes through supporting members during
accumulation by ensuring providers are delivering good value for money and
supporting decision-making at retirement through providing default decumulation
products, with later life income protections.
▪ Support employers by removing poor performing pension funds from the market,
provide access to alternative DB solutions, and opportunities to access the surplus in
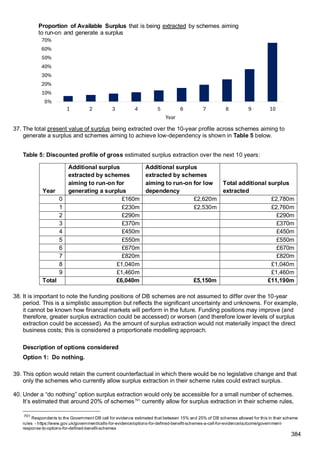
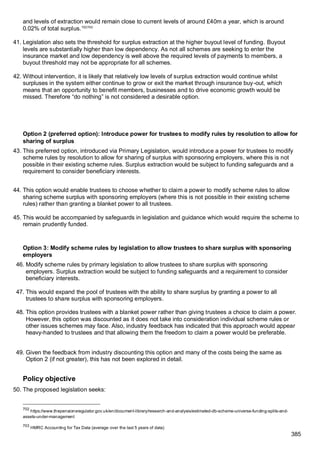
their DB scheme.
▪ Support economic growth through strengthening the opportunity for pension funds
to invest in more productive assets, which often have a stronger home bias,
compared to other assets.
2. Individual Impact Assessments have been produced, where appropriate, for all measures.
These are in the annex of this document. However, to support the discussion and increase
transparency, the summary IA brings all of this information together to present a complete
picture for the Bill. This is with a view of:
o Summarising the headline findings.
o Highlighting the interactions between the different measures.
o Estimating the potential impacts on savers.
o Outlining the wider context and pensions landscape the Bill is addressing.
3. Overall, the analysis shows:
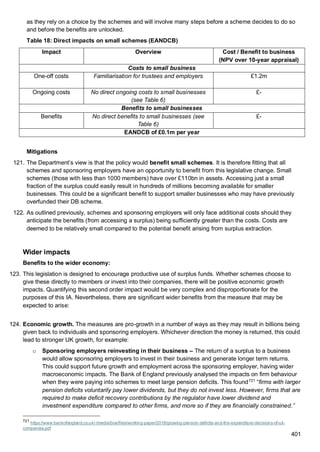
▪ There is an overall net direct saving to business of £34m per year from the
measures. There are further significant indirect benefits which could be accessed,
such as DB surplus, which further support businesses.
▪ Significant gains to pension savers.
▪ The reduction of multi-employer pension schemes from around 60 now to around
15-20 DC Megafunds estimated over the next 5 to 10 years.
▪ An estimated 20m people could benefit through the reforms1
.
Context
4. Automatic Enrolment (AE) was first introduced in 2012 and has led to a huge increase in the
number of workplace pension savers. 88% of eligible employees (over 20m) are now saving
into a workplace pension. The vast majority of these savers are saving into a Defined
Contribution (DC) workplace pension2
.
5. Workplace pensions are split into three markets:
1
Wealth & Assets Survey 2020-2022 (all DC pension holders not in payment) plus around 250,000 additional savers each year
over the next 10 years (DWP calculations based on ASHE)
2
https://www.gov.uk/government/collections/workplace-pension-participation-and-savings-trends
4.
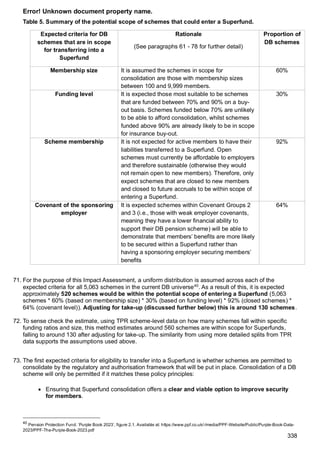
4
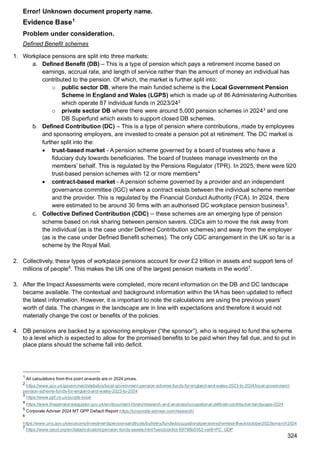
a. Defined Benefit(DB) – This is a type of pension which pays a retirement income
based on earnings, accrual rate, and length of service rather than the amount of
money an individual has contributed to the pension. Of which, the market is further
split into:
o Public sector DB, where the main funded scheme is the Local Government
Pension Scheme in England and Wales (LGPS) which is made up of 86
Administering Authorities which operate 87 individual funds in 2023/243
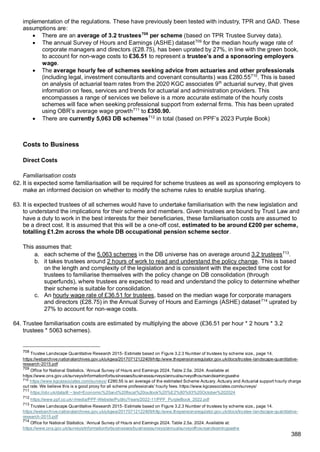
o Private sector DB where there were around 5,000 pension schemes in
20244
.
b. Defined Contribution (DC) – This is a type of pension whereby pension
contributions are made by employees/employers and are invested to create a
pension pot at retirement. The DC market is further split into:
o trust-based market - A pension scheme governed by a board of trustees
who have a fiduciary duty towards scheme members. The board of trustees
manage investments on the members’ behalf. This is regulated by the
Pensions Regulator (TPR). In 2024, there were around 920 pension
schemes with 12 or more members5
.
o contract-based market - A pension scheme governed by a provider and an
independent governance committee (IGC) where a contract exists between
the individual scheme member and the provider. This is regulated by the
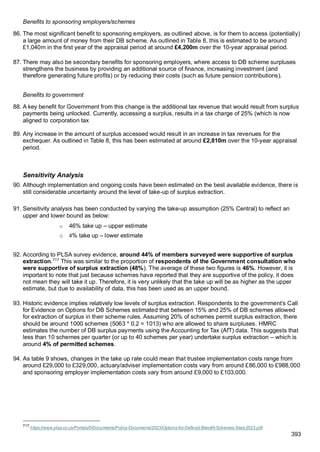
Financial Conduct Authority (FCA). In 2023, there were estimated to be
around 30 firms with an authorised DC workplace pension business6
.
c. Collective Defined Contribution (CDC) – these schemes are an emerging type of
pension scheme based on risk sharing between pension savers. CDCs aim to move
the risk away from the individual (as is the case under Defined Contribution
schemes) and away from the employer (as is the case under Defined Benefit
schemes). The only CDC arrangement in the UK so far is a scheme by the Royal
Mail.
6. Collectively, these types of workplace pensions account for over £2 trillion in assets
and support tens of millions of people7
. This makes the UK one of the largest pension
markets in the world8
. However, a large proportion of assets are invested abroad. Around
20% of DC assets are invested in the UK, which has declined from around 50% over the last
10 years9
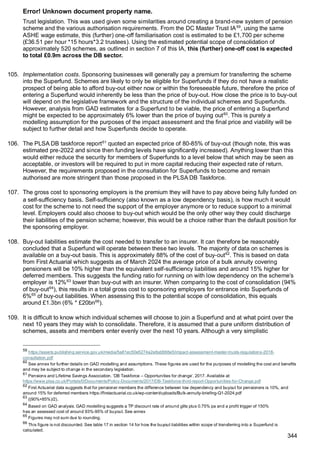
.
3
https://www.gov.uk/government/statistics/local-government-pension-scheme-funds-for-england-and-wales-2023-to-
2024/local-government-pension-scheme-funds-for-england-and-wales-2023-to-2024
4
https://www.ppf.co.uk/Purple-Book
5
https://www.thepensionsregulator.gov.uk/en/document-library/research-and-analysis/occupational-defined-contribution-
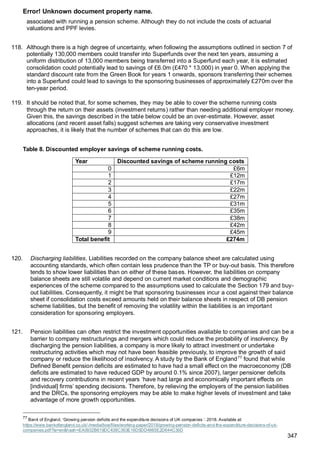
landscape-2024
6
https://www.fca.org.uk/publications/consultation-papers/cp24-16-value-for-money-framework
7
https://www.ons.gov.uk/economy/investmentspensionsandtrusts/bulletins/fundedoccupationalpensionschemesintheuk/october2
023tomarch2024
8
https://www.oecd.org/en/data/indicators/pension-funds-assets.html?oecdcontrol-69798b0352-var8=PC_GDP
9
https://www.gov.uk/government/publications/pension-fund-investment-and-the-uk-economy/pension-fund-investment-and-the-
uk-economy
5.
5
7. The DC-trustlandscape is growing in scale and maturing quickly with 30.6 million DC
memberships10
in 2025, an increase of 6% since 2024. DC trust workplace pension assets
have grown to £205 billion, increasing from only £22 billion in 201211
.
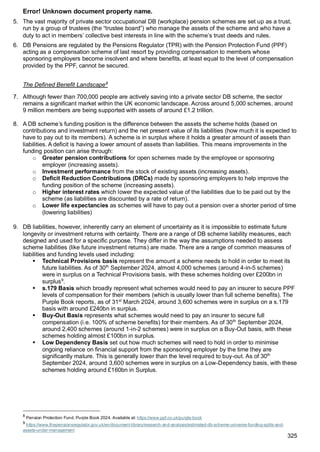
8. There are three main types of pension providers in the DC market:
o Master Trusts – an occupational pension scheme that provides DC pensions for two
or more unconnected employers (though often a lot more).
o Single Employer Trusts (SETs) – pension schemes which are managed for and on
behalf of a single employer.
o Group Personal Pensions (GPPs) – DC contract-based schemes which are
regulated by the FCA.
Table 1: Summary of workplace pension landscape
Type Number Assets Active Members
Master Trust 30 £166bn 10m
Single Employer Trust 890 £39bn 1m
GPP 30 £300bn 5m
Private Defined Benefit 5,000 £1,200bn Less than 1m
LGPS 87 £390bn 2m
9. The DC market has been consolidating, with the number of pension providers reducing from
around 3,700 in 2012 to around 950 schemes now. Close to 900 of these providers are
single-employer trusts, traditionally set-up by employers to support their workforce. However,
as AE resulted in all employers needing to enrol their employees (where eligible) into a
workplace pension, there has been a rise in Master Trusts (multi-employer pension
schemes). Across around 30 providers, these now account for over 90% of memberships
and 80% of assets in the DC trust market. In addition, there are around 30 GPPs, which
operate in the DC contract market. Across those two markets, there are now 7 DC providers
managing over £25bn worth of assets. This is a level where economies of scale are most
apparent enabling schemes to access a wider range of asset classes (including alternative
asset classes such as Private Equity and infrastructure), negotiate lower fees and improve
their governance12
.
10. AE has led to more people saving into a pension. However, inertia is strong and
engagement is low. For example, 47% have not reviewed how much their pension is worth in
last 12 months13
and over 94% of pension savers are invested in a pension scheme’s default
10
‘Memberships’ is used throughout this IA. This more closely represents the number of DC pots - the number of
members/savers is not knowable given an individual may have multiple pots with different providers.
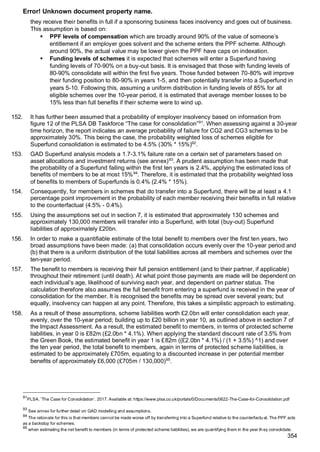
11
https://www.thepensionsregulator.gov.uk/en/document-library/research-and-analysis/occupational-defined-contribution-
landscape-2024
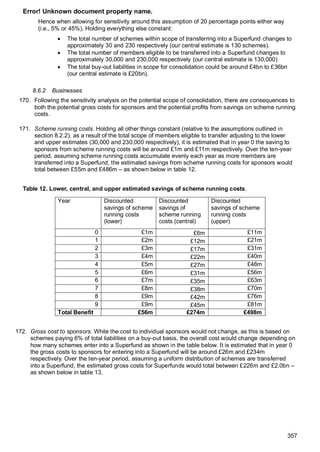
12
Corporate Adviser 2024 MT GPP Default Report (https://corporate-adviser.com/research/)
13
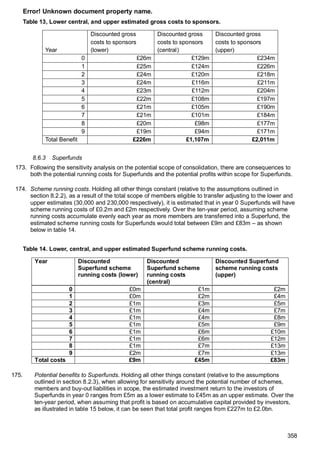
https://www.fca.org.uk/publication/financial-lives/fls-2022-pensions.pdf
6.
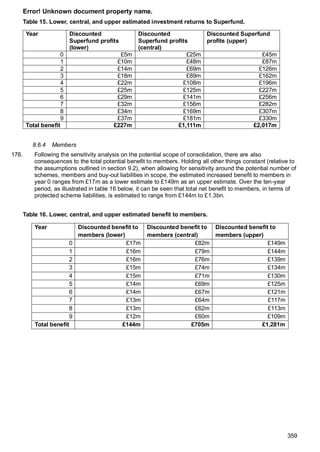
6
investment strategy inthe trust-based market14
. This highlights the importance of
government intervention, where appropriate, to deliver outcomes for members who may not
otherwise engage with their pension.
Regulation and types of pensions
11. Pension schemes are either personal or stakeholder pensions. They can be workplace
pensions arranged by an employer or private pensions arranged by an individual; the
legislation focuses on workplace pension schemes. Regulation of the pensions industry in
the UK is split between the FCA and TPR:
a) FCA regulates personal pensions, including workplace personal pensions (contract-
based pension schemes).
b) TPR regulates occupational pensions (trust-based pension schemes) across the private
sector DC and DB landscape
Policy Background
12. The pension measures are aligned with the Government’s mission of kickstarting
economic growth. The pension industry has a large amount of assets (£2 trillion) and
pension fund investment in domestic markets has the potential to support stronger economic
growth and capital market development15
. However:
o Investment by DC pension funds in the UK has been falling and remains lower than
comparator countries, such as Australia and New Zealand, investment in their own
economies.
o The UK does not have the same number of large pension providers seen in other
countries such as USA, Australia and Canada.
13. As a result, the focus is on reshaping the pensions landscape to build a pension market of
fewer, bigger, and better pension schemes. Larger schemes are shown to have better
governance (supporting decision-making), are able to access a wider range of asset classes
(including private markets, which have a stronger home bias), and therefore help support UK
economic growth.
14. Over the last two years, there has also been a significant increase in the level of DB funding
with around three-in-four schemes in surplus on a low-dependency basis16
. This offers the
opportunity for schemes to return money to employers and individuals, supporting
investment and UK growth, alongside increasing the likelihood of members receiving the
pensions they have been promised.
15. The Bill has been informed through multiple years of consultation and collaboration with the
pensions industry. For example:
14
https://www.thepensionsregulator.gov.uk/en/document-library/research-and-analysis/occupational-defined-contribution-
landscape-2024
15
See literature review of the evidence in here: https://www.gov.uk/government/publications/pension-fund-investment-and-the-
uk-economy/pension-fund-investment-and-the-uk-economy
16
https://www.thepensionsregulator.gov.uk/en/document-library/research-and-analysis/estimated-db-scheme-universe-
funding-splits-and-assets-under-management
7.
7
▪ Defined BenefitSuperfunds was first consulted on in 201817
with a Government
response being made in 2023.
▪ Mansion House 202318
included a package of planned reforms and consultations
across measures including small pots, VFM, DB, and LGPS.
▪ Options for Defined Benefit consultation launched in March 202419
to develop
future DB options.
▪ Phase 1 Investment Review was announced in July 2024, with a call for evidence in
September and further consultation in November20
. A final report will be published in
Spring 2025.
To legislate for the policy development, in the Kings Speech in July 202421
, the Pension
Schemes Bill was announced. This built on the Labour manifesto in 202422
which signalled
pension reforms by Government when in power, particularly on scale and consolidation in
the pension market to deliver for savers and the economy.
16. Consequently, there has been significant investment made and collaboration with industry to
gather the appropriate evidence and understand the impacts. In all consultations, there have
been specific evidence questions to gain important insights from the industry on the potential
costs and benefits from the proposals.
17. The result of the engagement made clear the preferred option to achieve these aims is to
legislate via the Pension Schemes Bill. Alternative approaches were considered for each
measure (see individual IAs), such as placing requirements in guidance. However, Primary
Legislation is seen as the only way to ensure sufficient coverage and take-up across the
options and ensure member outcomes are maximised.
18. The Pension Schemes Bill has 12 policies at introduction which include:
o Value for Money (VFM) - Many employers choose DC pension schemes for their
employees based on the costs that pension providers charge for those schemes
rather than the returns that the employees will receive. Often schemes that may get
better returns for the savers are overlooked by employers / advisers for schemes that
have a lower cost. This measure will require pension providers to be fully transparent
about both their costs and returns so employers can make better choices for their
employees. The measure will require scheme trustees to prepare periodic reports
comparing key metrics against other schemes and determining a value for money
rating. This will ultimately drive schemes to deal with poor value; with the backstop
that the Pensions Regulator and FCA will enforce scheme consolidation so that poor
value schemes are exited from the market.
o Small pots - Many people have more than one DC pot for retirement savings as a
new pot gets set up whenever they move employer. 13 million pension pots currently
17
https://www.gov.uk/government/consultations/defined-benefit-pension-scheme-consolidation/consolidation-of-defined-
benefit-pension-schemes
18
https://www.gov.uk/government/collections/mansion-house-2023
19
https://www.gov.uk/government/consultations/options-for-defined-benefit-schemes/options-for-defined-benefit-schemes
20
https://www.gov.uk/government/collections/pensions-investment-review-interim-report-consultations-and-evidence
21
https://assets.publishing.service.gov.uk/media/6697f5c10808eaf43b50d18e/The_King_s_Speech_2024_background_briefing_
notes.pdf
22
https://labour.org.uk/wp-content/uploads/2024/06/Change-Labour-Party-Manifesto-2024-large-print.pdf
8.
8
exist which areworth less than £1,000 and are no longer being paid into. This
measure will lead to consolidation of these pots for individuals via multiple default
consolidators (initially for pots worth less than £1,000) to ensure pots do not end up
lost, reducing pension scheme administration costs, and help create better value for
members.
o Guided Retirement - Most people do not engage with the complex financial
decisions that are required around retirement. As a result, many make sub-optimal
decisions about utilising their retirement savings, particularly to insure against living
longer than expected. This measure places duties on trustees to provide default
retirement products, either in-house or in partnership, which would include an income
in retirement as part of membership of the scheme. This is only on the DC trust-
based side of the market at this point.
o Contractual Override – Creating the ability for contract-based pension providers to
override a member’s contract within a contract-based pension arrangement and
either vary the terms or transfer members to a new arrangement. Effective consumer
protections are being put in place for this measure (e.g., contractual and tortious
duties and regulatory oversight).
o Megafunds for DC - A requirement for multi-employer pension funds to reach a
certain minimum size to enable a market of fewer, bigger, better governed funds with
the resources to pursue investment diversification and improved returns for savers.
The threshold will be set at £25bn of assets under management (AUM) in the main
default arrangement by 2030, or at least £10bn of AUM in the main default with a
credible plan to achieve £25bn by 2035. There will be exemptions for some schemes,
such as those set-up due to religious beliefs or aligned to a DB scheme, which is
open only to a closed group of related, but not legally connected, employers. There
will also be a pathway for new entrants and those offering Collective Defined
Contribution (CDC) schemes.
o Megafunds (Local Government Pension Schemes (LGPS)) – The LGPS will be
professionalised and consolidated, allowing it to invest more effectively in ways that
contribute to UK growth. Ensuring that investment strategies are of a high standard
will help drive UK investment and support economic development. The consolidation
of LGPS funds will also lead to greater expertise and more efficient management of
pension assets.
o DB Superfunds - Many employers support DB pensions which are closed to new
members and cannot pay the premium necessary to secure these benefits by “buying
out” with an insurance company, but would value being, free to concentrate on their
core business, enabling growth. This measure will allow schemes in this position to
transfer to commercial pension providers called ‘superfunds’, provided the superfund
offers a better prospect of paying full benefits than the original scheme. Superfunds
are required to be extremely secure but are not as secure as insurance buyout.
Schemes can only be transferred into a superfund if the trustees believe it is in the
best interests of the members and if it meets conditions overseen by the Pensions
Regulator. The measure will establish a permanent legislative regime for superfunds,
to replace the Pensions Regulator's interim arrangements.
o DB Surplus Flexibilities - This allows trustees of well-funded DB pension schemes
to extract and share some of the £160bn of surplus funds available with sponsoring
9.
9
employers and members,subject to adequate funding levels and stringent
safeguards.
o PPF Schemes Rules for Terminal Illness (SRTI) - This measure will extend the
definition of terminal illness in the DB pension compensation schemes - the Pension
Protection Fund (PPF) and Financial Assistance Scheme (FAS), so that people can
receive payments sooner in their illness. The definition will change from a life
expectancy of six months or less, to a life expectancy of 12 months or less, aligning
this with similar changes in social security legislation and with tax legislation.
o Pensions Ombudsman (TPO) - This measure will re-establish the legal standing of
TPO to make enforceable determinations in pensions overpayment recoupment
cases without the requirement of a county court judge’s order to enforce the
determination, so saving county court time and additional cost to the schemes and
members.
o PPF Levy - This will remove legislative restrictions that have blocked the Board of
the Pension Protection Fund (PPF) from reducing the annual pension protection levy
it collects, when it is not required. The levy is paid by schemes, frequently by their
sponsoring employers. The PPF have already more than halved the levy to £45
million for 25/26 and it could be reduced to zero with sufficient legislative progress.
o Display of PPF and FAS information on the pensions dashboard service
provided by MaPS - This would facilitate PPF and FAS information to be displayed
on the Government-backed pensions dashboard service provided by the Money and
Pensions Service (the Money Helper pensions dashboard), benefiting approximately
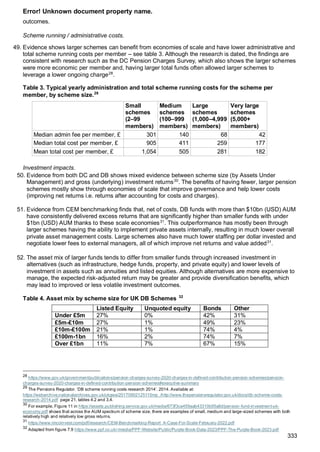
150,000 people with compensation not yet in payment.
Summary Impact Assessment
19. As outlined above, there are a wide range of measures included in the Bill affecting very
different parts of the pensions landscape. As a result, each measure (where relevant) in the
Bill has been analysed individually with the IA included in the annex of this document. This
contains the detail around each policy measure, the detailed evidence, and all the estimated
costs/benefits. To support the discussion and increase transparency, the summary IA brings
all of this information together to present a complete picture for the Bill. This is with a view of:
o Summarising the headline findings
o Highlighting the interactions between the different measures
o Estimating the potential impacts on savers
o Outlining the wider context and pensions landscape the Bill is addressing
20. Some measures will require secondary legislation to finalise policy choices. As a result, each
IA aims to present the best available evidence and estimated costs/benefits based on the
current position. However, these are very likely to change as further policy details emerge
and more evidence becomes available. Additionally, a number of assumptions are made to
best estimate the impacts in the absence of evidence, such as the split between employers
and members when sharing a DB surplus. In such instances, these are not government
recommendations; but purely used as an analytical assumption in the absence of available
information.
10.
10
21. The aggregatedmonetised impacts are calculated for a ten-year appraisal period and all
costs are given in 2024 prices and use 2025 as the base year for the present value
calculation, as given in the RPC Impact Assessment Calculator. The only exception is
Guided Retirement and Small Pots which use 2024 prices and 2028 as a base year due to
the implementation period for those policies. This standardised approach is taken because
of the large number of measures covered. For each policy-specific IA, price years and
present values may slightly differ depending on the data analysis and the expected timing for
policy implementation.
22. Pensions have very long-time horizons, for example, a person who enters the labour market
aged 22 will not be able to access this money for another 35 years. As a result, there was
consideration if the appraisal period should be assessed over a longer timeframe. However,
each of the IAs make use of 10-year appraisal periods. This is because:
a. Increasing uncertainty – There are already a significant number of assumptions
and uncertainties across the IAs. Going further into the future would present even
greater uncertainty for limited benefit.
b. Compounding effects – A number of IAs monetise the potential benefits of greater
investment returns. These can significantly compound the benefits over a very long
period of time, adding even greater uncertainty when dealing with large impacts.
c. Establishing the counterfactual becomes harder and less robust – The pensions
landscape is constantly changing, therefore the longer the timeframe considered, the
greater the likelihood things would naturally change. However, these effects cannot
be known.
23. Standard Green Book discounting rate of 3.5% has been applied throughout to the costs and
benefits.
24. There will be a final “enactment” Impact Assessment with the final costs/benefits of the
finalised Bill. The IA currently reflects the Bill at the point of Introduction.
Evidence base
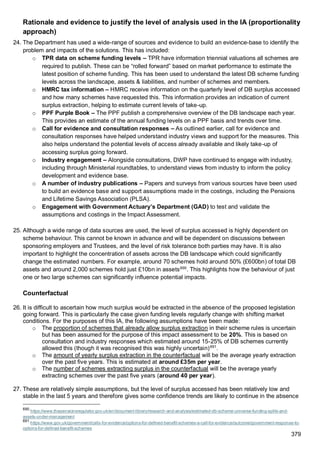
Rationale
25. The Pension Schemes Bill seeks to address a number of market failures and challenges
which exist across the pension market. These are explained in each of the individual IAs, but
the key elements are summarised here.
26. Principal-Agent Problem – This exists as savers (principal) bear all the risks and reward,
but the choice of the scheme is made by the employer (agent). These incentives can, and
often are, misaligned with the employer commonly choosing a pension scheme based on
cost rather than performance23
. Employers are also unlikely to switch or change providers.
Evidence from the DWP employer survey showed only 5% of employers with a DC pension
provider had switched to a different provider and employers’ main focus when selecting
provider was on convenience of enrolment and cost, not on overall VFM23
. Employees are
often not incentivised to switch the provider chosen by their employer due to low
23
https://www.gov.uk/government/publications/department-for-work-and-pensions-employer-survey-2022/department-for-work-
and-pensions-employer-survey-2022-research-report
11.
11
engagement and information.Additionally, they may risk losing employer contributions if they
do switch (the employer does not have to contribute to a pension into which they have not
enrolled their employee). This issue further applies to other elements, such as decumulation.
An employer may not necessarily choose a scheme offering a range of decumulation
products, which subsequently impacts the employee who bears the cost of this. For
example, in order to access a pension product, such as an annuity or income drawdown, the
individual may have to pay a transfer cost (potentially around 1% of their total pot24
). The Bill,
through ensuring decumulation products are provided and a strong emphasis on value,
should significantly reduce this problem.
27. Fragmentation – The pension market is currently fragmented with around 1,000 pension
schemes in the DC market and around 5,000 schemes in the DB market. Across the DC
landscape, there are also 1,000s of different arrangements and funds across Master Trusts
and GPPs, adding further fragmentation. This is bad for schemes and bad for members.
Schemes cannot move members into other funds without their consent (which is costly and
timely) and being spread across 1,000s of funds adds additional overhead costs to manage
and reduces the opportunities to maximise economies of scales. This can then result in
individuals being stuck in expensive or inefficient funds, either unaware of the higher costs
(due to information failures) or unable to switch (as outlined above). Exiting the market is not
always possible either or exit options might be limited. For example, employers with DB
schemes have a commitment to run their pension scheme and can only wind-up the scheme
where the scheme has paid the final member or have passed their scheme onto an insurer
via “buy-out”. Superfunds, regulated for in the Bill, will provide another credible and secure
alternative. The Bill will accelerate consolidation in the DC market, both across the number
of arrangements and number of providers.
28. Positive externalities – The Bill aims to build a pension market with fewer, larger, and
better pension providers which have greater capabilities to invest in more illiquid and
productive assets (such as infrastructure). These investments are more likely to be UK-
based compared to some other asset classes (e.g. listed equities) and the Government has
sought to produce an investable pipeline via initiatives such as the National Wealth Fund. As
a result, pension funds increasing their allocations to these assets may generate spillover
and positive externalities to the UK economy25
. There are 4 main routes this could arise from
(further details can be found in “Pension Fund Investment and the UK Economy”:
o Capital market development - Pension investment makes market deeper and more
liquid. This can lead to increasing market capitalisations leading to higher volume
and improved valuations. This may all lead to a positive investment spiral.
o Supporting start-ups to scale-up - Pension funds’ long-term horizons, scale and
expertise mean they can access and support promising companies to scale-up,
succeed and remain in the UK.
o Promoting ‘block ownership’, corporate governance and management -
Investing in businesses directly may improve their governance, improving
management and ensuring long-term performance is prioritised. This is because the
24
https://online.email.hsbc.co.uk/HSBC_Tomorrow_Report_Converting_pension_pots_into_incomes.pdf
25
https://www.gov.uk/government/publications/pension-fund-investment-and-the-uk-economy/pension-fund-investment-and-
the-uk-economy
12.
12
incentives between ownersand managers become greater aligned and longer-term
decisions can be made26
.
o Long-term investment in productive domestic assets - Pensions funds can invest
in assets that other types of investors may not be able to. This is from pension funds
having longer-term horizons or being able to support high capital requirement
projects e.g. infrastructure.
29. Asymmetric and imperfect information - The absence of a consistent framework and
standardised, accessible data means there are a wide variety of definitions, methodologies
and metrics used to determine whether a pension scheme is delivering value. This data is
hosted on thousands of different provider websites and some providers do not publish this
data at all. This makes it difficult for both employees and employers to objectively compare
the VFM provided by schemes and means some schemes may have lower standards in
assessing value. The proposed VFM framework aims to address these issues to promote
consistent, accessible comparisons of value and drive competition on this basis.
Transparency, standardised price and value comparison, and competitive pressures have
improved outcomes in other markets, such as energy markets, that is hoped to be emulated
in the DC market through the VFM framework27
.
Providers also accept the members an employer signs-up, without perfect knowledge of
which members may leave/stop saving shortly after. This creates loss-making deferred small
pots (now estimated at 13m worth £4bn in assets and growing by around 1m a year). Some
providers may only accept certain employers to mitigate this or charge greater fees to insure
against the risk of members leaving. This will be addressed through the small pension pots
consolidation policy.
Across the DB landscape, over the last 4 years, sponsoring employers have contributed over
£50bn in Deficit Reduction Contributions (DRCs)28
. However, market conditions have meant
schemes are now much better funded and, for some schemes, this money will be well above
the amount needed to meet future benefit payments. A sponsoring employer cannot know
how financial markets may change and therefore whether they are over- or under-
contributing towards the funding of their pension scheme. Without being able to access a
surplus, a sponsoring employer is at risk of over-funding their scheme or may seek to limit
funding or extend contributions over a longer time frame to minimise this risk. Being able to
access a surplus minimises the risks of schemes being “over” funded on a sustained basis
and improves incentives for sponsoring employers to fund their DB schemes.
30. Financial stability – The workplace pension industry is worth around £2tn with over half of
the working-age population saving into a pension. As this grows further, and a greater
proportion of the population have larger pension entitlements, it becomes of greater
importance that there are sufficient legislative requirements around the industry. It is
imperative to deliver financial and macroeconomy stability through an appropriate regulatory
regime for such an important industry. The Bill puts in place measures designed to create a
more stable and secure pension regime to encourage long-term investments and innovation.
This is particularly important for Superfunds, ensuring these large entities have an
appropriate level of regulation in place. In addition, the requirements for DC Megafunds will
26
https://www.sciencedirect.com/science/article/pii/S1062940817302917
27
https://publications.parliament.uk/pa/cm201415/cmselect/cmenergy/899/899.pdf
28
https://www.ons.gov.uk/economy/investmentspensionsandtrusts/datasets/fundedoccupationalpensionschemesintheuk
13.
13
help drive upstandards across the DC market to ensure funds with significant assets are
appropriately identified and regulated.
31. Low take-up of guidance and advice. There is a positive correlation with pot size and take-
up of advice/guidance. However, many people are accessing DC pots without advice or
guidance, despite the introduction of the Stronger Nudge to Pensions Wise guidance
legislation29
. DWP’s Planning and Preparing for Later Life Survey found that nearly three in
ten people (29%) who had accessed a DC pension had not received information, advice or
guidance from their pension provider, Pension Wise or a financial advisor. This suggests
greater support may be needed, via legislation, to support individuals in their decision-
making. Individuals currently face longevity and investment risk which they need to manage
for decades in retirement, which presents a significant risk. Feedback to DWPs consultation,
‘Helping savers understand their pension choices: supporting individuals at the point of
access’ also suggested for many members of occupational pension schemes the idea of
people making decisions on their behalf was crucial. The role of guided retirement should
help support members and provide a default approach that members are able to opt-out of.
32. Maximising flexibility for employers. Across the DB measures, the changes are designed
to lower costs to businesses and seeking to increasing the likelihood of members benefits
being secured. The measures will remove poor performing pension funds from the market,
provide access to alternative DB solutions, and opportunities to access the surplus in their
DB scheme. This should all support further business investment, reduce search costs, and
deliver better value.
33. Merit good. Pensions can be considered a merit good given individuals underestimate the
benefit of pensions. For example, 79% have never thought a lot about how much they
should be paying into a DC pension30
. As a result, individuals are unlikely to respond
themselves or put competitive pressure on employers or providers to improve performance.
This therefore requires additional protections to be put in place. For example, through the
VFM framework (to address underperforming schemes) or through small pension pot
solution (as individuals are highly unlikely to consolidate pots themselves nor can schemes
currently move individuals).
Legislation & alternatives to legislation
34. Engagement across the industry and stakeholders clearly identified the preferred option to
address the market challenges and aims identified was to legislate via the Pension
Schemes Bill.
35. Alternative approaches were considered for each measure (see individual IAs for details).
The most common alternative was placing the measures in guidance. This would be non-
enforceable and has already been tried in a number of instances in an effort to encourage
the market to respond via information and guidance from the Regulator. However significant
issues remain:
29
Introduced in 2022, requiring all pension scheme providers to refer their members to Pension Wise guidance when they
decided to access their pension savings, unless the member actively opted out.
30
https://www.fca.org.uk/publication/financial-lives/fls-2022-pensions.pdf
14.
14
▪ Decumulation solutionsare not in place across the market and no default is on
offer. This is leading to the majority of individuals taking out their pensions as cash31
and having to make significantly challenging financial decisions managing longevity
and investment risk throughout their retirement. This is despite the increasing focus
on support members in retirement being a key theme for Government and across the
industry. This risks sub-optimal outcomes for members and the industry.
▪ Data on performance across investment, costs and services is incomplete and
inconsistent, therefore comparisons across the market cannot be accurately made
leading to underperformance across a number of providers.
▪ Trustees remain cautious in decision-making, such as sharing DB surplus, without
the clear legislation to support their decisions32
.
▪ A large number of Master Trusts and GPPs remain in the market despite some
providing high cost and poor performance, highlighting market forces alone are not
enough to drive inefficient schemes.
36. The workplace pension market is also unique, making legislation the most appropriate form
of intervention. The market has not responded to a number of the challenges with a wide-
range of evidence demonstrating the outstanding issues that remain, for example:
▪ Market failures – As outlined above, there are a significant number of market
failures identified in the market which make legislation the appropriate vehicle to
address these and improve the competitiveness of the market and deliver good long-
term outcomes for members.
▪ Industry support many of the measures and recognise need for government
intervention – The ABI and PLSA’s Small Pots Cross-Industry Co-ordination Group33
in its conclusion recommended that Government should explore a number of
solutions to address the proliferation of small pots. Since then, engagement with
industry through a call for evidence and the small pots delivery group has focused on
how industry and government can co-operate on a government legislated solution.
Industry has extensively engaged with the Department in the development of a
solution which further suggests broad industry support for the requirement of
government legislation.
▪ Low engagement and awareness from individuals. As identified by OFT34
on DC
workplace market “product complexity made decision making very difficult. This was
leading to low levels of competitive pressure and ultimately poorer value for money”.
This is perhaps not surprising. Automatic Enrolment has enrolled millions of new
savers into workplace pensions, particularly for groups who were not previously
saving. For example, only 17% of low earners in the private sector were saving into a
workplace pension; this is now 75%35
. Individuals are highly unlikely to drive
employer or pension provider behaviour through competitive forces as:
31
55% of pots accessed have been fully encashed since 2018:
https://www.fca.org.uk/data/retirement-income-market-data-2023-24
32
https://www.ftadviser.com/defined-benefit/2025/2/20/scheme-members-must-remain-priority-in-any-db-surplus-distribution-
proposals/
33
https://www.plsa.co.uk/Portals/0/Documents/Policy-Documents/2022/Small-pots-co-ordination-group-spring-2022-report.pdf
34
https://www.fca.org.uk/publication/feedback/fs19-05.pdf
35
https://www.gov.uk/government/statistics/workplace-pension-participation-and-savings-trends-2009-to-2023/workplace-
pension-participation-and-savings-trends-of-eligible-employees-2009-to-2023
15.
15
o They donot choose the pension provider. An individual is enrolled into a
pension selected by their employer. The individual risks losing their employer
contribution if they choose to select another provider as the employer does
not have to pay into another scheme.
o Pensions are complex with over 50% of the savers having very low, or low,
pension engagement36
. DWP have undertaken significant research into
pension engagement and find people don’t have a sense of control (often
from lack of knowledge or external factors such as financial markets).
o Individuals do not consolidate their pensions. Only around 5% of
individuals had consolidated a pension pot in the last 12 months37
. DWP
research found “Barriers to consolidating deferred pots were knowing whether
or not they could; fear of scams; not knowing information about their deferred
pensions; not knowing how to consolidate; believing it would be hard work or
not understanding the benefits of consolidation”38
.
▪ Low engagement and awareness from employers. AE has resulted in over 2.5m
employers fulfilling their duties39
and it is for the employer to decide on the pension
scheme for their employees. However, employers are highly unlikely to drive
employer or pension provider behaviour through competitive forces as:
o Employers rarely switch their pension provider. Research40
found “it was
too difficult a process” and latest information shows only around 5% of
employers have switched pension provider (driven by large companies)41
.
o Employers choose convenience or cost. DWP Employer Survey finds the
most common reasons for choosing a pension scheme is the convenience or
ease of the scheme. However, the individual, not the employer, bears the cost
of a bad decision when selecting a provider. This means incentives are
misaligned.
o Information is complex and incomplete. Currently, there is not one single
place to compare and contrast performance, which adds time and cost to
employers. The resource implication was a notable barrier found for
employers’ reluctance to switch: “switching was incredibly difficult to do
because of the resource implications (time and financial costs). As such,
these employers would only switch if the security of the scheme was
threatened, or there was a worrying drop in the scheme’s investment.”42
37. There are other important reasons why legislation is appropriate, most notably the size and
systemic importance of the pension system. The workplace pension industry is worth around
£2 trillion and will continue to grow, with over 1-in-2 working-age adults saving into a
36
https://www.fca.org.uk/publication/financial-lives/fls-2022-pensions.pdf
37
https://www.fca.org.uk/publication/financial-lives/fls-2022-pensions.pdf
38
https://www.gov.uk/government/publications/understanding-member-engagement-with-workplace-pensions/understanding-
member-engagement-with-workplace-pensions
39
https://www.thepensionsregulator.gov.uk/en/document-library/research-and-analysis/automatic-enrolment-declaration-of-
compliance-report
40
https://assets.publishing.service.gov.uk/media/6358e5a08fa8f557d9a2d573/workplace-pensions-and-automatic-
enrolment.pdf
41
https://www.gov.uk/government/publications/department-for-work-and-pensions-employer-survey-2022/department-for-work-
and-pensions-employer-survey-2022-research-report
42
https://assets.publishing.service.gov.uk/media/6358e5a08fa8f557d9a2d573/workplace-pensions-and-automatic-
enrolment.pdf
16.
16
workplace pension andover 35 million people having some form of pension wealth43
.
Pension funds are an integral part of capital markets; for example, UK private sector DB
funds own an estimated 80% of the long-dated index-linked gilt market44
. As a result, it can
only be right there is appropriate legislation to ensure the right safeguards are in place for
savers, providers, and the economy.
Delivery Timetable
38. Across the measures, the timings of when the policies come into force may be slightly
different. This is subject to change, and further details are outlined in the Roadmap
document published by DWP. However, the table below highlights the emerging timetable.
Table 2: Provisional outline of delivery dates of policies
Measure Estimated Commencement Date (subject to change)
VfM Regulations process: 2026/27
First publication of VFM data and assessment in 2028
Small Pots Regulations process: 2027/28
Duties come into force from 2030
Guided Retirement Regulations process: 2026/27
MTs start complying with Guided Retirement 2027
Contractual Override 2028
DC Megafunds 2030 deadline for £25bn (or £10-25bn with clear path)
DB Superfunds Regulation consultation 2026 with view of 2028
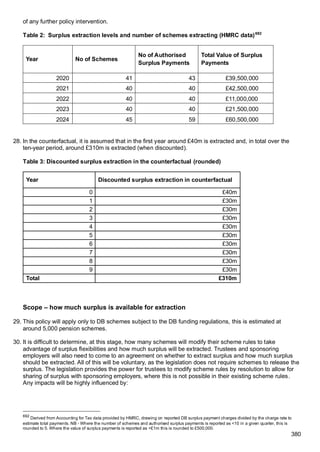
DB Surplus Regulation consultation in 2026 with view of 2027
Data
39. DWP has aimed to use a wide-range of data sources to support the evidence-base and
understand the impacts of the proposals. Each IA discusses the sources used for each
policy, but a number of the key sources are captured here for completeness and to
demonstrate the breadth of evidence sought. Data sources include:
▪ TPR Scheme Returns – TPR publish annual scheme returns from DC schemes,
providing a comprehensive overview of the DC trust landscape on assets,
memberships, and scheme numbers. This will be critical to monitor the rate of
consolidation happening across the market. In addition, an annual overview of DB
schemes is provided (and publication of triennial valuations) to monitor the patterns
in the DB market.
▪ PPF’s Purple Book – PPF produce a thorough assessment of DB schemes and
trends each year. This will help understand the movement into Superfunds market
and the latest funding levels across the DB landscape.
▪ FCA’s Retirement Income Market data – Every year the FCA publish information
on how people are accessing their pension in the contract-based market. This offers
43
https://www.ons.gov.uk/peoplepopulationandcommunity/personalandhouseholdfinances/incomeandwealth/bulletins/totalwealthi
ngreatbritain/april2020tomarch2022
44
https://www.plsa.co.uk/Portals/0/Documents/Policy-Documents/2023/Pensions-and-Growth-Jun-2023.pdf
17.
17
in-depth information onthe amount being accessed, the method this is being
accessed through (e.g. drawdown, annuity) and trends over time.
▪ Corporate Adviser GPP/MT Report – Corporate Adviser produce an in-depth
assessment of the multi-employer market each year, offering insights on
memberships, asset allocations, and returns. This is, and will be, essential in
understanding the changing market and growth of “Megafunds”.
▪ DWP Employer Survey – DWP has regularly run a survey of employers with a
pensions module. This has included questions around the types of factors employers
consider when choosing and switching pension schemes. This will be important in
monitoring switching levels and whether there is a trend towards greater value, over
cost, when choosing a scheme.
▪ FCA Financial Lives Survey – Every 2 years, the FCA publish a large-scale
quantitative survey covering all aspects of accumulation and decumulation. This will
help understand trends and plans of people accessing a pension.
▪ HMRC RTI data – The Department currently receives monthly management
information from HMRC RTI on pension participation and how many people are
accessing a pension. This offers timely insights into trends, particularly around
decumulation, that will help understand the decisions individuals are taking.
▪ Wealth and Assets Survey – The ONS publish a household survey on wealth every
2 years. This has comprehensive information on pension wealth, particularly allowing
the number of pension pots (and the wealth in those pots) to be analysed in detail.
▪ Consultation Responses – As part of the evidence gathering for individual policies,
DWP have often issued “data gathers” from providers to understand the latest
position across the industry. This has been particularly helpful on Small Pension
Pots, DB surplus, and Megafunds through accessing sensitive data on pension
scheme holdings.
▪ Workshops – There have been multiple roundtables and workshops with industry to
gather new insights, discuss emerging areas of interest, and to listen to stakeholders.
This information has been critical in shaping the policy areas and understanding the
likely impacts.
40. Recognising the impacts of the policies, DWP have further invested in 2 brand-new
quantitative surveys to further enhance the policy area, support IA development where
timings allow and will further support the Bill during the Parliamentary process. They will also
be key sources of monitoring and evaluation. These are:
a) Planning and Preparing for Later Life (PPLL) – Previously run in 2021, this survey
asks around 4,000 40-75 year olds their views and attitudes towards retirement,
pension provision and decision-making. This particularly sought to improve the
understanding of the benefits of policies to individuals, through the innovative use of
Willingness to Pay modules. This has been used, where possible, to add consumer
surplus benefits to the policy areas.
b) Pension Provider Survey – DWP have previously run a Pension Charges Survey
every 3 years – several of the individual Bill measures (for example, VfM and
Megafunds) have made use of this existing survey evidence. This year, the survey
has been significantly enhanced to explore asset allocations, investment
performance and costs/charges across both accumulation and decumulation. This is
with a view of developing a stronger understanding of single-employer trusts (often
18.
18
missed from othersurveys and consultation responses of the DC market) and
therefore likely impacts of policy changes on this group. Early findings will be
available in the Summer with results informing the Parliamentary debate, final details
of the policy and IA refinements.
Summary of Impacts
41. The summary of the key costs and benefits, along with the Equivalent Annual Net Direct
Cost to Business (EANDCB) (2024 prices), are presented in Table 3a below. This aims to
summarise, for all of the measures, the estimated overall direct business cost to business.
Each individual IA contains further details on methodology and approach taken. It is
important to note that, due to likely interactions between the measures (see next section on
interactions), the sum of individual measures may overstate the business costs.
42. The EANDCB figures in Table 3a are expressed in 2024 prices. It is important to note the
EANDCB represents the direct cost to business, however there are wider indirect benefits to
business which arise from the policies (e.g. accessing a DB surplus) which are significant,
but ultimately dependent on employer behavioural response. The measures are also
focused on improving saver benefits (e.g. VFM aims to improve outcomes for members)
which could be significant (see later section). Table 3b shows the estimated Net Present
Social Value, Business Net Present Value and EANDCB of each of the measures.
43. Recognising the importance of the EANDCB, each direct cost/benefit is outlined in detail
about its inclusion and the rationale to support the decision. Further details are also provided
within each IA.
44. Across each Impact Assessment, unless otherwise stated, all aggregated monetised
impacts use 2024 prices and 2025 present value base year, as given in the RPC/DBT
Impact Assessment Calculator. 2024 prices are used because this is when the Department
considered the policy evidence and 2025 is the present value base year as this is when the
individual policy measures – and wider Pension Schemes Bill – will either be implemented or
begin to impact the market. The exceptions to this are the ‘Small Pots’ and ‘Guided
Retirement’ IAs, which uses 2024 prices but a 2028 present value base year as there is no
reasonable expectation for there to be any real market impacts across these policies until
2028 at the earliest.
45. There are also one-page summaries across all the measures in the Bill. IAs have not been
produced for all measures as this was not always considered proportionate or necessary.
For example:
o Terminal Illness – The additional cost is on the PPF (an Arm’s Length Body) rather
than industry and this is estimated to support around 10 people per year.
o LGPS – The impacts of the measures are largely on public-sector bodies, and
therefore no IA was deemed necessary by MHCLG.
o Contractual Override – As this will need to be completed with FCA rules and
dependent on firm behaviour, an IA has not been produced at this stage. It is,
however, implicit within other policy measures (such as small pots, Megafunds and
VFM) that firms would be able to access this benefit to implement the policies. This
measure would only be used by firms where it is in their financial interest to
19.
19
consolidate funds. Thisis reflected in the measure being welcomed by the pension
industry). However, recognising the importance of transparency, indicative
calculations have been estimated to give a potential sense of impact.
o TPO – This is out-of-scope of the RPC coverage given it is in relation to legal cases
and rulings.
o PPF Levy – This is out-of-scope of the RPC coverage given it is in relation to a Levy.
o Dashboards - Any additional costs would be on ALBs rather than industry.
However, one-page summaries are included on these for transparency on the potential
impacts as outlined in Table 4.
46. The tables below bring together the key information across all the measures in the Bill:
▪ Table 3a outlines the key benefits and costs alongside the EANDCB estimate across
the measures.
▪ Table 3b outlines the estimated 10-year net present social value and 10-year net
business present value.
▪ Table 3c outlines which benefits are considered direct for the purposes of the IA,
following RPC guidelines.
▪ Table 3d outlines which costs are considered direct (or unavoidable) for the
purposes of the IA, following RPC guidelines.
20.
20
Table 3a: Summaryof individual policy measures (values rounded – see individual IAs for further details)
Measures Key Benefits Key Costs EANDCB (2024
prices, £m)
Regulatory
Measure?
Value for Money Members: Savers may potentially
receive greater investment returns
which will grow their pension pots,
contributing to more income in
retirement. Estimated market-wide
benefit of £20bn over a 10-year
appraisal period (£2bn per year).
Schemes: Pension schemes benefit
from improved performance due to
charging structures (monetised) and
have more availability of information
(non-monetised). Estimated benefit of
£100m over the appraisal period
(£10m per year).
Members: Most members should not face
an increase in costs; but there is a risk
some costs may be passed on or indirect
impacts (such as wage impacts or
contributions).
Schemes: Will need to familiarise and
implement the new regulations (around
£140m) and face ongoing costs over the
10-year period (£330m cumulative)
£43m Yes
Small Pots Members: Should see a reduction in
the average charge faced on their
pension pot. In addition, the
consolidation of pension pots
automatically will generate a consumer
surplus. These benefits are estimated
at £890m over the 10-year appraisal
period.
Providers: The reduction in loss-
making pots will generate estimated
benefits of £1,170m to providers.
Members: Expectation that members
should not see an increase in costs.
There is a risk that some members could
face higher charges if their pots are moved
to a higher charging scheme. Authorisation
(including a Value for Money requirement)
and market-wide reduction in charges
should help mitigate such risk.
Providers: The cost for scheme trustees to
familiarise with the new legislation and the
development and implementation of a
Central Data Service is estimated at
around £220m. Transferring small pots will
-£64m Yes
21.
21
cost industry around£220m over the 10-
year appraisal period.
Guided Retirement Members: May no longer fully
withdraw their pension and can
potentially receive greater investment
returns through remaining invested for
longer. There are also benefits from
reduced transfer fees. Benefits
estimated at £1,660m over 10 years,
largely driven through improved
investment returns.
Providers: Through managing larger
pension pots, will see an increase in
revenue from charges of around
£260m over the 10 years.
Members: Most members should not face
an increase in costs; but there is a risk
some costs may be passed on by pension
schemes.
Providers: running a decumulation service
will face additional costs alongside those
providers who need to choose, and review,
their partnership arrangements. These
ongoing costs are estimated at £310m
over 10 years with one-off costs of around
£60m.
£13m Yes
Contractual
Override
Members: Should benefit from lower
costs, as fees on older arrangements
are often charged greater amounts.
Should also benefit from moving into
better performing funds, consistent
with consumer protections being put in
place.
Providers: Merging arrangements
should allow scale benefits to be
realised and reduce costs. This could
range from £170m to £510m
depending on the amount of assets that
providers consolidate.
Members: Possible risk some funds
performing worse in some instances
having seen members transferred in.
However, mitigations are in place to avoid
consumer harm.
Providers: May be costs from
moving/merging arrangements. Movement
to lower cost funds may result in lower
profits. This could range from £30m to
£90m depending on the amount of assets
that providers consolidate.
N/A Yes
DC Megafunds Members: The monetised benefits
occur in the form of higher net returns,
attainable through the lower charges
and higher diversification that can be
Members: None monetised.
Schemes: A reduction in the number of
pension schemes will be a cost to some
-£26m Yes
22.
22
accessed as pensionscheme scale
increases. Together, these benefits are
estimated to be around £1,680m over
the ten-year period.
Schemes: The monetised benefits
occur due to the lower investment fees
attainable as pension scheme scale
increases, with it modelled that
providers retain a portion of the profits,
as well as additional charge revenue
given the larger pension pots built by
members. Together, these benefits are
estimated to be around £350m over
the ten-year period.
schemes due to the transfer of funds.
Estimated to be around £110m over the
ten-year period.
LGPS Megafunds Members: Not impacted as benefits
are guaranteed in statute.
Providers: By capitalising on
economies of scale and pool capability,
expect the reforms to have a beneficial
impact on costs and investment
performance.
Members: Not impacted as benefits are
guaranteed in statute.
Providers: Administering authorities will
be required to meet a higher minimum level
of governance and conduct triennial
reviews, which may lead to some modest
additional costs.
N/A No
DB Superfunds Members: Entry into a superfund
should increase the likelihood of
members receiving their pension
benefits in full, relative to a
counterfactual where these schemes
would face limited prospects for
consolidation. Estimated benefit of
£710m.
Members: None.
Employers: In total, employers who
voluntarily choose and recognise the
additional benefits of entering a Superfund
would need to pay around £1,110m to
transfer their scheme.
Less than £1m Yes
23.
23
Superfunds: Superfunds wouldsee a
return on their investment (around
£1,110m over 10 years)
Schemes/Employers: See a
reduction in running costs of their
scheme (£270m).
DB Surplus Members: Share of surplus extracted
of around £4,200m over a 10-year
period.
Employers: Share of surplus extracted
of around £4,200m over a 10-year
period.
Members: No monetised costs. However,
there may be an increase in risk of
schemes being underfunded (impacting
future ability to pay future benefits).
Though this risk is considered low.
Schemes/Employers: Less than £10m
from trustees/employers understanding the
new legislation and ongoing costs
reflecting additional time spent considering
and commissioning scenarios of DB
funding levels.
Less than £1m Yes
PPF/FAS SRTI Members: Benefit from earlier access
to terminal illness payment.
Providers: PPF may face slightly greater
costs; though this is likely negligible
N/A No
The Pension
Ombudsman
Members: Able to benefit from more
efficient and accessible means of
resolving pension complaints. This
should save members time and, where
applicable, ensure appropriate
contributions have been made to the
member.
Schemes: Able to benefit from more
efficient and accessible means of
resolving pension complaints. This
should save schemes time and
reduced legal costs.
N/A N/A No
24.
24
PPF Levy Employers:Benefit from a reduction in
costs when PPF Levy is set to zero.
This could yield potential benefits
through greater investment in their
business or improved financial
situation.
N/A N/A No
Dashboards – PPF /
FAS
Members: Benefit around 150,000
individuals who will be able to see their
information on the Pension
Dashboards.
N/A N/A No
Note: Figures rounded to the nearest £10m. See individual IAs for the full results.
Table 3b: Total net present social value, business net present value and EANDCB summary of individual measures
Across the measures, the individual impact assessments estimate a £33bn Net Present Social Value, a £4.7bn Business Net Present
Value and an EANDCB of -£34m (i.e. a net direct saving of £34m per year for businesses).
Measures Total Net Present Social Value
(£m)
Business Net Present Value (£m) EANDCB (2024 prices, £m)
Value for Money £19,364 -£371 £43
Small Pots £1,245 £551 -£64
Guided Retirement £1,550 -£109 £13
DC Megafunds £1,911 £231 -£26
DB Superfunds £935 £230 £0
DB Surplus £8,393 £4,193 £0
Total £33,399 £4,724 -£34
Note: A positive (+) estimated EANDCB is a direct cost to business. A negative (-) estimated EANDCB is a direct benefit to business. Rounded
to the nearest £m
25.
25
Table 3c: Mainmonetised benefits of individual measures, to whom they accrue and whether they are direct or indirect
Policy Main monetised benefit Direct/Indirect Explanation
Value for
Money
Higher returns Direct to
members
Improved returns are the main aim of the policy; the scheme (agent) invests on
behalf of the member (principal) so the benefit of improved returns wholly passes
through to the ultimate asset owner (the member).
Charge Revenue Direct to
business
Directly/automatically follows from above, no new steps.
DC
Megafunds
Provider savings Direct to
business
This is the first consequence of building scale; achieving greater economies of
scale and being able to deliver a wider range of investments for lower costs.
Savings for members
who are transferred into
larger schemes
Direct to
members
Members who are transferred into larger schemes, necessary as their existing
scheme leaves the market, automatically access the lower charges that the
larger scheme is already offering.
Savings for existing
members of schemes
that achieve more scale
Indirect to
members
This element of cost savings relies on schemes passing some of their initial cost
saving on, which is an additional step in chain and dependent on schemes
actively choosing to do this.
Higher returns Indirect to
members
Members benefit from better performing, better diversified pensions on a net
return basis as scale is achieved. However, this is dependent on schemes
actively making changes to invest in a wider range of asset classes (such as
private markets) and being able to achieve greater returns.
Increased charge
revenue
Indirect to
business
This is an indirect benefit, requiring pension schemes to either pass on lower
investment fees as lower charges, or diversify their portfolios to invest in wider
asset classes, thus enabling the increases in net returns for members that can
enable this higher charge revenue (as a percentage of larger pension pots).
Small Pots Admin saving Direct to
business
This is the main policy aim and first step in the logic chain of consolidating small
pots.
Lower charges for
members
Indirect to
members
As for ‘DC Megafunds’ – this relies on providers passing on some savings; an
additional step in the chain and not automatic.
Consumer surplus Direct to
members
Members receive their stated ‘willingness to pay’ benefit of no longer having
multiple small loss-making pots, this is a primary policy objective and ‘automatic’
(members do not have to actively do anything to benefit from receiving a service
they would have been willing to pay for (consumer surplus and involves no ‘pass
through’).
26.
26
Guided
Retirement
Higher returns Directto
members
Ensuring a market-wide decumulation offering alongside a default retirement
product for members is expected to lead to a reduction in full-cash withdrawals
and transfers – members are expected to receive greater returns by remaining
invested with their pension scheme in the long run, as schemes will be able to
invest them in higher-returning asset allocations.
Savings in transfer fees Direct to
members
Ensuring a market-wide decumulation offering is expected to lead to a reduction
in transfers for members seeking to access certain decumulation products –
members are expected to save on fees that are associated with transferring a
pension pot.
Charge Revenue Direct to
business
Ensuring a market-wide decumulation offering alongside a default retirement
product for members is expected to lead to a reduction in full-cash withdrawals –
greater number of members are expected to remain invested in the trust-based
market, leading to increased revenue for schemes from charges pots remaining
invested.
DB Surplus Access to surplus
funding - employer
Indirect to
business
Surplus access is the prime policy aim but relies on the trustees choosing to
access surplus and agreeing with employers; they are not required to do so.
Access to surplus
funding - members
Indirect to
members
Surplus access is the prime policy aim but relies on the trustees choosing to
access surplus and agreeing with employers; they are not required to do so.
DB
Superfunds
Investment Returns to
Superfunds
Indirect to
Business
Superfunds present a business opportunity for financial intermediaries that deem
it profitable to enter the market. Benefit classed as indirect as entry into a
superfund is optional and will be dependent on the business model taken.
Reduced scheme
running costs for
employer
Indirect to
Business
Once a sponsoring employer has transferred their DB scheme to a Superfund,
they will no longer be required to pay on-going expenses of running the pension
scheme. Benefit classed as indirect as entry into a superfund is optional
Increased likelihood of
receiving full scheme
benefits
Indirect to
members
Entry into a superfund should increase the likelihood of members receiving their
pension benefits in full, relative to a counterfactual where these schemes would
face limited prospects for consolidation. Benefit classed as indirect as entry into a
superfund is optional
27.
27
Table 3d: Mainmonetised costs of individual measures, to whom they accrue and whether they are direct or indirect
Policy Main monetised cost(s) Direct/Indirect Explanation
Value for
Money
Familiarisation,
implementation and
ongoing costs
Direct to
business
One-off and ongoing cost impacts to schemes are immediate and unavoidable;
schemes are accountable for compliance each year and the first step in the logic
chain.
DC
Megafunds
Familiarisation costs Direct to
business
Necessary costs for all schemes to ensure compliance with the measures.
Search costs Direct to
business
Necessary costs for the schemes leaving the market, with them required to
engage a larger scheme to consolidate their assets into.
Consolidation costs Direct to
business
Further necessary costs of the measures, incurred when transferring assets from
the schemes leaving the market.
Small Pots Transition Costs –
Central Mechanism and
Familiarisation Costs
Direct to
business
Necessary costs involved for schemes in the implementation of the policy and
therefore are direct costs as a result of the measures.
Transfer Costs Direct to
business
The first step in the logic chain as schemes will be required to send their pots to
the relevant consolidator. As the costs of the immediate action required to be
undertaken to achieve the policy objectives, these are therefore direct costs.
Guided
Retirement
Familiarisation and
training
Direct to
business
Familiarisation and training costs will occur as schemes understand and comply
with the new regulations.
Developing an in-house
decumulation/default
product
Direct to
business
Schemes that do not currently offer decumulation services to their members will
be expected to develop an offering in-house or transfer their members to a
scheme at decumulation. Developing a decumulation offering in-house is
expected to accrue upfront and ongoing running costs.
Transfer arrangement Direct to
business
Where unfeasible to develop in-house decumulation and default offerings,
schemes are expected to transfer their members reaching decumulation to an
appropriate scheme which can offer these services – this is expected to accrue
upfront arrangement costs as well as ongoing costs at intervals as schemes
review their transferring arrangements.
DB Surplus Familiarisation Costs Direct to
business
Trustees and sponsoring employers of all DB schemes would be expected to
undertake some level of familiarisation to understand the implications of the
policy change
Implementation and
Ongoing Costs
Indirect to
business
Schemes that choose to undertake surplus extraction would face additional costs
to modify scheme rules and extract surplus.
28.
28
DB
Superfunds
Initial Familiarisation
Costs forschemes
Direct to
business
Trustees of all DB schemes would be expected to undertake some level of
familiarisation to understand the implications of the policy change, in line with
their obligations under trust law and fiduciary duty.
Employer contribution to
enter a superfund
Indirect to
business
Additional costs on sponsoring employers for scheme to enter a superfund. The
measure does not mandate schemes to enter a superfund, therefore costs would
only be incurred if this is in the best interest of members.
Superfund running costs Indirect to
business
Superfunds will have running costs of their own in taking on DB pension
schemes. These would only be incurred if Superfunds decide to take on these
schemes.
29.
29
Table 4a: Valuefor Money (VFM): summary of policy measure
Summary of the measure VFM aims to shift the competitive focus of the DC
market from cost to value, encompassing
investments, services and costs. It aims to improve
the value schemes offer to savers, ensuring better
retirement outcomes by enhancing transparency,
comparability, competition and performance.
Underperforming schemes must either improve or
exit the market.
Impact on savers Savers are the main policy beneficiary from saving
into better performing pension arrangements. Driving
up standards and investment returns means savers
should have larger pots at retirement.
Savers are not expected to see higher charges on
their pensions as the market is already competitive
on cost making pass-through costs unlikely.
Impact on pension providers Schemes will earn higher charge revenue from
member pots as their performance improves (as
charges are set as a % of pot value). Therefore better
returns are in provider interests too.
Schemes will have to familiarise themselves with the
policy and implement relevant systems, as well as
complete VFM assessments annually and store the
required data.
Impact on employers Employers should find it easier to select good-value
pension schemes for their employees as value is
driven up. VFM scores should inform scheme
selection and shift the market focus from cost to
value, mitigating principal-agent problems.
Impact on Government VFM reforms may result in greater regulatory costs
through TPR/FCA compliance and additional
pressures on MaPS/TPO as a result of the changes.
However, the submission of consistent and greater
levels of data should allow for easier comparisons of
performance across schemes.
This could additionally support wider government
aims of increasing productive investment in the
domestic economy as these larger providers are
better equipped to access such investments.
Wider impacts Better-performing, larger pension schemes can
invest productively and at scale, helping markets
function more efficiently, improving diversification,
capital markets, and supporting economic growth.
VFM’s competitive focus could help spur innovation
in the market as schemes seek to maintain/improve
their ‘value’ rating and best practice is shared.
30.
30
Table 4b: SmallPots: summary of policy measure
Summary of the measure A multiple default consolidator model aims to address the
proliferation of deferred small pots (pots initially below
£1,000). There are currently 13m pots worth less than £1,000
across the DC pensions market. The policy aims to reduce the
number of these loss-making pots that providers have to
administer and improve retirement outcomes for members by
combining members’ small pots into one pot within an
authorised consolidator scheme.
Impact on savers Savers would be a significant policy beneficiary from the
consolidation of their potentially multiple small pots into one
pot within a consolidator scheme. Due to the competitive
nature of the DC pensions market, specifically in terms of
annual management charges, all members across the DC
market would be expected to benefit from lower charges as a
result of industry savings through the reduction in the number
of small pots being passed on to members. There may be
further non-monetised benefits such as making pots easier to
manage – saving time and reducing the likelihood of members
losing their pension pots.
Impact on pension
providers
Providers will have to facilitate the transfer of members’ small
pots into the authorised consolidator schemes; however, the
consolidation of small pots should help reduce the number of
loss-making small pots that providers have to administer and
therefore ultimately reduce providers’ administration costs.
Delivery arrangements are being assessed in more detail
including through a Feasibility Review. There would also be a
cost of a central mechanism to facilitate identifying and data
matching with the expectation that this would be met by
industry.
Impact on employers Only deferred pots would be within scope and therefore any
pots transferred will no longer be receiving any employer
contributions. For a pot to be eligible, it will need to have been
deferred for at least 12 months and therefore there is no
envisaged impact on employers as the consolidation and
transfer process would be the responsibility of pension
providers.
Impact on Government DWP are assessing delivery options to refine the cost/benefit
analysis. There would be a cost to regulators in authorising /
supervising the system albeit this may be reduced through
addressing existing costs in the system (e.g. derived from lost
pots).
Wider impacts The automatic consolidation of small pots may support the
wider consolidation of the DC pensions market and help drive
investment performance with the growth in scale of the
consolidator schemes. The increased share of assets saved
in large, well-governed DC schemes could potentially direct
funds to longer-term illiquid investments which could have
wide-ranging benefits across society. This measure also
supports public trust and confidence in workplace pensions
saving, which risks being eroded if small pots are ‘lost’ or
require cost to members to find and consolidate.
31.
31
Table 4c: GuidedRetirement: summary of policy measure
Summary of the measure For DC pension schemes to develop decumulation
solutions for their members, including a default
decumulation solution which the member would be
placed into unless they opt-out.
Impact on savers Savers are the main policy beneficiary; they are
expected to receive greater investment returns
through being defaulted into a decumulation option(s)
rather than having to fully withdraw their pension as
cash at point of access. Schemes are likely to enter
members into higher return-seeking assets for a
longer period in anticipation of them entering a
default solution with later life income protection,
further enhancing investment returns. Members will
save on transfer costs by no longer having to transfer
to another scheme to access decumulation products.
Impact on pension providers Providers benefit from earning greater revenue as
members remain invested for longer and their pots
are greater from investment return; increasing the
total amounts of charge revenue received.
However, there may be significant costs for providers
to familiarise themselves with the legislation, provide
training to staff, and either develop in-house
decumulation products for their members or set up
contracts to transfer them to another provider to
facilitate this.
Impact on employers Employers will benefit through knowing all their
employees will be signed into a pension scheme that
provides pension income solutions. This may reduce
search costs when looking for a new scheme.
Impact on Government There may be greater regulatory oversight required
from the measures, particularly to ensure all schemes
are meeting the requirements and regularly reviewing
the default solution(s) is appropriate for their
members. Further details will be developed. There
may be long-term savings from the measures through
individuals having greater income protection and not
becoming reliant on the state in later life after
exhausting private pension savings.
Wider impacts The legislation encourages schemes to keep pension
pots invested (rather than moving to liquid assets in
anticipation of individuals withdrawing them). This
may have benefits for capital markets and private
companies through larger pools of risk capital
becoming available to be invested and invested for
longer (due to defaults). This can indirectly help to
boost economic growth, deepen capital markets and
increase the UK’s low investment levels.
32.
32
Table 4d: ContractualOverride measure
Summary of the
measure
The contractual override measure will enable pension providers to
override a member’s contract within a contract-based pension
arrangement and either vary the terms or transfer members to a new
arrangement without their consent, where it is in the member’s best
interest. This measure will introduce the mechanism to enable a
contractual override to take place and allow for its permissive use
where certain conditions are met. It will not dictate when it must be or
can be used. It is anticipated that FCA rules or secondary legislation
may require its use, and this is the reference to mandatory uses.
However it is not this measure which imposes those cases.
Impact on savers It is expected there to be an overall positive impact on savers. Due to
the best interest test, the contractual override power can only be used
where savers are expected to benefit from the variation or transfer.
They may benefit from potential lower costs or better investment
performance in new arrangements / from varying of contractual terms.
Overall, this will provide the saver with better value.
There is a risk a saver could be transferred to an arrangement that
performs worse than the incumbent as it is impossible to predict
investment performance. Safeguards will mitigate this risk.
Impact on pension
providers
It is expected there will be an overall positive impact on pension
providers and industry has been calling for this measure for a long
time. It will allow them to consolidate costly, inefficient legacy
arrangements which will bring scale benefits and reduce costs.
Through variation of contractual terms, providers will be able to update
the investment platforms through which the pension is delivered where
they are out of date. These positive impacts may offset any costs
associated with undertaking a contractual override, which could
include communication and advisory costs, including costs related to
the independent third party.
Impact on
employers
The measure creates no further mandatory role for the employer
beyond their existing automatic enrolment obligations. However, they
will be notified of the contractual override as part of the process and
there may be costs associated with employers updating their payroll
information after a contractual override has taken place.
Impact on
Government and
Regulators
The measure will require the drafting of further FCA rules and
secondary legislation and regulation to underpin it. This will also
include the need for the FCA to supervise a new regime though this
could be offset by the overall lessening of arrangements to supervise
where there is consolidation.
Wider impacts The ability to override member’s contracts and consolidate their DC
pensions is expected to support the wider consolidation of the DC
pensions market, delivering better returns for UK savers and greater
investment for UK PLC. It will also allow the delivery of the Value for
Money Framework and the Government’s Small Pots work.
33.
33
Table 4e: DCMegafunds: summary of policy measure
Summary of the
measure
For multi-employer DC workplace pension schemes, there will
be an introduction of a minimum Assets under Management
threshold of £25bn at arrangement-level to be met by 2030.
There are time-limited transitional pathway for schemes with
AUM exceeding £10bn and exemptions for certain specific
type of schemes (such as certain schemes with both DB & DC
arrangements).
Impact on savers For savers whose assets are consolidated into larger
schemes, or whose schemes achieve significant additional
scale, a reduction in charges is expected. These lower
charges are passed-on by providers, who gain access to lower
investment fees with additional scale. Given existing market
competition on price, savers are not expected to have costs
passed-on to them. Savers may further benefit through larger
schemes being able to access a wider range of assets
including UK productive markets, helping diversification and
this may help generate additional returns.
Impact on pension
providers
Providers are expected to benefit from lower investment fees
and greater efficiencies, with a portion of the benefits retained
as profits. However, familiarisation costs are expected to be
faced as schemes understand and implement the legislation.
There are additional costs of consolidating schemes, including
engagement with other schemes, the selling and buying of
funds, and other supportive activity including legal,
consultancy and communication. A number of pension
providers are expected to close as a result of not meeting the
AUM threshold.
Impact on employers There will be fewer, larger pensions schemes from which to
select a scheme for their employees; this may result in a
reduction in search costs. However, impacts are expected to
be minimal. Larger providers may be able to support
employers with workforce retirement planning and
engagement more easily.
Impact on Government With a reduced market of larger pension providers, this may
reduce regulatory costs as there are fewer schemes to
oversee.
Wider impacts The establishment of a market of fewer, larger pension
schemes should support the UK economy through these
schemes being able to access a wider range of asset-classes,
such as infrastructure and private equity, which tends to have
a stronger “home bias” compared to some other asset classes.
Additionally, ‘block ownership’ of UK firms by pension
schemes may also be enabled, further supporting economic
growth through improved governance and adoption of longer-
term investment horizons.
34.
34
Table 4f: LGPSPooling: summary of policy measure
Summary of the
measure
The LGPS measures will make a series of reforms to the
investments and governance of the LGPS. The aim of the reforms
is to build an LGPS with improved governance and world-class
investment capabilities in powerful institutional investors in the
form of the LGPS asset pools. This will deliver economies of scale
and improved investment expertise to invest in the UK and locally.
The requirements are:
- LGPS asset pools will be required to meet a set of minimum
standards, including that they are FCA regulated, have sufficient
knowledge and capability, and adhere to reporting requirements.
- LGPS funds will have to set a high-level investment strategy and
to receive advice from the pool. Pools will be required to
implement this high-level strategy, including setting tactical
allocations and selecting managers, or managing investments
internally.
- The pools will be required to manage the administering
authority’s assets on their behalf, in accordance with the fund’s
investment strategy. All assets must be managed by the pool.
- Administering authorities (or their pool) will be required to work
with Strategic Authorities to develop local investment
opportunities.
Administering authorities will be required to undertake a triennial
independent governance review.
Impact on savers Members are not impacted by these measures as benefits are
guaranteed in statute.
Impact on pension
providers
The reforms will require funds to delegate investment management
to their pool. Administering authorities will retain the ability to set a
high-level strategy, and thus full control on the most important
drivers of risk and return, as well as wider high-level goals such as
those on environmental and societal impact, funding strategy
requirements, and local investment. By capitalising on economies
of scale and pool capability, it is expected the reforms to have a
beneficial impact on costs and investment performance.
Administering authorities will also be required to meet a higher
minimum level of governance and conduct triennial reviews, which
may lead to some modest additional costs.
Impact on
employers
The measures will have no immediate impact on scheme
employers. It is expected future investment performance and cost
to be improved by the reforms due to increased scale and pool
capability, with a positive impact on future employer contributions.
Impact on
Government
The measures have no impact on Government, as the Scheme is
managed locally.
Wider impacts Investment Consultants: administering authorities will be required
to take principal advice from their pool, which will impact the
consultants who are currently providing that advice. Funds may
wish to take supplementary advice as well, which is not limited by
these proposals.
Local growth: there are expected to be beneficial impacts of the
requirement for LGPS pools and funds to work with strategic
authorities as this should increase local and regional investment .
35.
35
Table 4g: DBSuperfund: summary of policy measure
Summary of the measure The measure seeks to introduce a legislative
framework and authorisation regime for DB
Superfunds. These are commercial consolidation
vehicles that can take on pension scheme liabilities,
in exchange for a significant injection of capital from
the ceding employer. The aim is to provide an
alternative route for schemes that are unable to
secure member benefits through the insurance
market, thereby improving the chances of member
benefits being paid in full.
Impact on savers The policy is intended to protect DB members by
increasing the likelihood of receiving their pension
benefits in full. Superfunds will have to demonstrate
a high probability (at least 98%) that their members
will receive their benefits in full.
Impact on pension providers For superfunds, taking schemes on from ceding
employers is a business opportunity intended to
earn them a profit. These benefits will be offset by
some of the costs around familiarisation,
authorisation fees, and scheme running costs.
However, any entry to becoming a Superfund is
expected to be with a view of profitability in the long-
run (therefore benefits being greater than costs).
Impact on employers Sponsoring employers are expected to benefit from
discharging their ongoing DB pension liabilities,
allowing them to focus on their core business.
However, there will also be some upfront costs to
implement the new arrangement.
Impact on Government The government, through The Pensions Regulator
(TPR), will incur costs related to the authorisation
and supervision of Superfunds. However, these
costs may be transferred to the Superfunds via
application fees and bespoke levies, resulting in no
expected overall cost to the regulator.
Wider impacts The policy is expected to benefit the Pension
Protection Fund (PPF) by reducing the amount it
would have to pay out in benefits. There may be
additional wider benefits to the UK economy through
Superfunds being greater in size, being able to
access a wider range of diverse assets, and
therefore investing in assets such as private equity
and infrastructure.
36.
36
Table 4h: DBSurplus Flexibilities: summary of policy measure
Summary of the measure This measure aims to remove legislative barriers
that currently prevent DB schemes from accessing
surplus funds. The measure will introduce a power
for trustees to modify scheme rules to allow for the
sharing of surplus with sponsoring employers,
subject to funding safeguards and a requirement to
consider member interests
Impact on savers Members of DB schemes could benefit from surplus
extraction, for example through cash payments
and/or benefit improvements where their
scheme/employer come to an arrangement.
However, there is a potential risk extracting surplus
funds could impact the security of member benefits,
and increase PPF liabilities, if this scheme was to
later enter the PPF, due to employer insolvency.
This risk is considered low given planned legislative
requirements for schemes to be prudently funded.
Impact on pension providers Schemes who agreed to allow their employer to
access the surplus would see a reduction in their
funding level. However, any surplus would only be
extracted where there is sufficient confidence
funding levels would continue to remain high. The
measure may result in familiarisation costs and
greater discussions with employers.
Impact on employers Sponsoring employers could benefit from surplus
extraction, for example through benefit
improvements and/or using surplus funds to pay
their employer contributions for DC pensions, where
they come to an arrangement with the scheme’s
Trustees. However, there will be costs for employers
associated with familiarisation, modifying scheme
rules and surplus extraction.
Impact on Government The government will benefit from the additional tax
revenue on surplus payments. However, there may
be a small additional risk of members not receiving
their full benefits if surplus extraction results in
greater risk-taking or significant worsening of
funding levels (though this risk is expected to be
low).
Wider impacts The return of surplus funds to businesses and
members is expected to boost economic growth
through increased investment and consumption
effects. The measure may help generate
distributional benefits by reallocating investment
from DB to Defined Contribution (DC) pensions,
potentially improving pension outcomes for DC
members by going beyond AE minimum levels. The
ability to access surplus funds may influence DB
schemes' investment strategies, potentially leading
to greater investment in more productive assets.
37.
37
Table 4i: PPFSchemes Rules for Terminal Illness (SRTI): summary of policy measure
Summary of the measure This measure will extend the definition of terminal
illness in the DB pension compensation schemes -
the Pension Protection Fund (PPF) and Financial
Assistance Scheme (FAS), so that people can
receive payments sooner in their illness.
Impact on savers Around 10 people per year receive a terminal illness
payment from PPF/FAS. The measure will benefit
savers through:
i) Allowing earlier access to a payment;
ii) Potentially increasing the numbers who
receive a payment (those members who
have a terminal illness with a life
expectancy of between 6-12 months, but
who sadly pass away before reaching the
6 months stage).
Impact on pension providers The measure only affects the PPF and FAS – not
the private pension industry. Any additional costs
arising to the PPF are likely to be negligible and
therefore would not be passed onto industry.
Impact on employers There is no impact on employers.
Impact on Government There may be a very slight increase in cost to the
PPF/FAS (which are Arm’s Length Bodies) but the
cost is expected to be negligible.
Wider impacts The definition of terminal illness used by the DWP
was extended by the Social Security (Special Rules
for End of Life) Act 2022. The definition was
extended to include people with a life expectancy of
up to twelve months – instead of six months.
Therefore the measure will align the definitions with
the Department’s definition.
38.
38
Table 4j: ThePension Ombudsman: summary of policy measure
Summary of the measure This measure will restore the original policy intent
that the Pension Ombudsman (TPO) should be
regarded as a competent court for certain pension
complaints. This measure will re-establish the legal
standing of TPO to make enforceable
determinations in pensions overpayment
recoupment cases without the requirement of a
county court judge’s order to enforce the
determination.
Impact on savers Savers will benefit from more efficient and
accessible means of resolving pension complaints.
This should save members time and, where
applicable, ensure appropriate contributions have
been made to the member in a more timely and
cost-effective manner.
Impact on pension providers Providers and Trustees will benefit from a more
efficient and accessible means of resolving pension
complaints. This should save schemes time and
reduced legal costs.
Impact on employers Employers will benefit from a more efficient and
accessible means of resolving pension complaints.
This should save schemes time and reduced legal
costs.
Impact on Government This should reduce the cost and time required by
county court judge’s, helping to reduce costs for
government.
Wider impacts N/A
39.
39
Table 4k: PPFLevy: summary of policy measure
Summary of the measure This measure seeks to provide the Board of the PPF
greater flexibility to adjust the annual pension
protection Levy it collects from DB schemes, by
removing legislative restrictions. The PPF have
introduced provisions within their Levy rules allowing
them to set a Levy rate of zero, pending this
legislative change being approved.
Impact on savers Impact on savers is likely to be small as the Levy is
paid in practice by employers who ultimately bear
the pension scheme costs. However, some
schemes do have cost-sharing where a small
benefit may be gained. If reductions in the levy paid
by employers are passed onto savers, then this may
benefit them through larger benefits at retirement.
Impact on pension providers It is expected the impact on pension providers would
be minimal, as employers tend to cover the cost of
paying the PPF Levy. However, pension providers
may experience a small benefit from the Levy being
reduced to zero, as the administrative burden of
paying the Levy by the scheme to the PPF would be
eliminated.
Impact on employers Employers tend to bear the cost of paying the PPF
levy and would therefore see the biggest impact
from this change. Being able to reduce the levy,
would directly benefit them in terms of cost savings.
This could yield second-order benefits through
greater investment in their business and/or
improved resilience. £173m was collected in
2023/2445
and £43m is planned in 2025/2646
- with
the PPF in surplus by around £13bn, a movement of
the Levy to around £0 in the future could
significantly benefit employers in future years.
Impact on Government Reduced legislative burden from not setting the
annual levy ceiling each year.
Wider impacts The reduced level of the Levy offers the
opportunities for employers and schemes to benefit,
either through further supporting their members or
being able to make greater levels of investment
within their business, supporting the UK economy.
45
https://www.ppf.co.uk/-/media/PPF-Website/Public/Purple-Book-Data-2024/PPF-The-Purple-Book-2024.pdf
46
https://www.ppf.co.uk/news/Levy-estimate-2025-26
40.
40
Table 4l: Dashboards:summary of policy measure
Summary of the measure This measure would facilitate PPF and FAS
information to be displayed on the Government-
backed pensions dashboard service provided by the
Money and Pensions Service (the Money Helper
pensions dashboard). This will mean information on
entitlements from the PPF/FAS will be shown
alongside the individuals other pension information.
Impact on savers Around 150,000 people with compensation not yet
in payment will be able to see the information from
PPF/FAS alongside their State and other Private
Pensions.
Impact on pension providers There should be no impact on pension providers.
Impact on employers There should be no impact on employers.
Impact on Government There may be a small additional cost of connecting
to the pension dashboard architecture.
Wider impacts Allows for a more complete picture of retirement
savings for individuals, allowing them to find more
entitlements and helping them make better
decisions when approaching retirement.
41.
41
Contractual Override estimates
47.This measure allows pension providers within a contract-based workplace pension
arrangement to either vary the terms of member’s contract or, transfer them to a new
arrangement without their consent when it is in the member’s best interest (as determined by
independent third party).
48. Pension providers can have a large number of pension arrangements for different employers
– hundreds or even thousands of arrangements. This will include legacy (pre-AE)
arrangements, and bespoke arrangements created either by the pension provider or by the
employer. Many of these arrangements may not be delivering value for money for members
and may have greater costs for providers, including potentially limiting the ability to benefit
from economies of scale. Currently, it is very difficult and can be costly for providers to move
contract-based members to a new arrangement even if they are not offering good value for
money, due to the need to seek individual consent from members. A general lack of
engagement by members with pension providers makes this tricky.
49. Based on responses to the Phase 1 Investment Review consultation in November 202447
,
keys costs are expected to include transfer costs, communication costs, and advisory costs.
Consultation feedback, though limited, suggested one-off costs may be in the region of 5
basis points (0.05%) of the value of assets transferred. Consultation feedback also indicated
that the key benefit is it allows pension providers to consolidate costly, inefficient
arrangements, which will bring scale benefits and reduce costs. It was indicated that this
might be around 3 basis points (0.03%) per year on any assets that are consolidated. This
assumption is potentially on the lower end, given there could be large differentials between
arrangements and the industry feedback to the consultation indicating the cost of inefficient
arrangements, but felt appropriate to use for these illustrative purposes.
50. An IA has not been produced for this measure at this stage, due to it being a mechanism to
enable an action rather than mandating its usage48
, dependent on firm behaviour and due to
the measure needing FCA rules to fully bring it into effect. A full IA will be produced at a later
point as policy is developed. However, to support the Bill an illustrative estimate of the
potential costs and benefits of this policy have been made.
51. Using above assumptions and a similar method to that outlined in the DC Megafunds IA
below49
, the amount of assets in contract-based providers within non-main default
arrangements was estimated in 2028 (the year of the estimated commencement date for this
policy). These benefits would continue every year, though for this analysis a 10-year
appraisal period of 2025 to 2034 has been used, with costs and benefits starting from 2028.
Table 4m below shows the range of costs and gross and net benefits, depending on the
amount of assets that providers consolidate. For example, by 2034, if 25% of assets outside
of the main default were consolidated into that main default there would be an estimated
cost of £30m, a gross benefit of £170m, and a net benefit of £140m. If, however, 75% of the
assets estimated to be outside of the main default were consolidated into that main default,
47
https://www.gov.uk/government/collections/pensions-investment-review-interim-report-consultations-and-evidence
48
Though other policies, such as the Value for Money framework, may themselves lead to use of contractual override
49
See section “Projections of necessary consolidation” in Megafunds IA, around page 294.
42.
42
by 2034, therewould be an estimated cost of £90m, a gross benefit of £510m, and a net
benefit of £420m. While the scale of the benefit to providers is unclear and dependent on the
assumptions outlined above, it is highly likely that providers will see a large net benefit from
this measure.
Table 4m: Estimated costs and benefits to providers of Contractual Override
% of non-main default assets consolidated:
25% 50% 75%
Cost (One-off transfer cost of 0.05%) £30m £60m £90m
Gross benefit (0.03% pa, over 7 years) £170m £340m £510m
Net benefit (over 7 years) £140m £280m £420m
Powers to mandate asset allocation
52. Though not covered in a dedicated impact assessment, the Pension Schemes Bill plans to
establish a measure which could enable a legal minimum allocation of investment in
productive assets to be applied across schemes subject to the DC “megafund” requirements.
That is, those multi-employer schemes with a minimum AUM of £25bn by 2035.
53. The industry has already expressed a level of support for improving UK and productive
investments, citing many of the measures (such as the VFM requirements) as key enablers
to support investment in more illiquid assets such as infrastructure. The recent Mansion
House Accord50
saw 17 providers pledge to invest 10 percent of their default workplace
growth phase portfolios in assets such as infrastructure, property and private equity by 2030.
At least 5 percent of these portfolios will be ringfenced for UK-based investments.
54. For several reasons, the potential costs and benefits associated with the use of this power
has not been monetised at this stage:
• The aim is for voluntary industry compacts and goodwill to meet the requirements
– not the legislation. Many pension providers have already signed up to a voluntary
Accord, accounting for around 90% of active savers in the DC market. As a result, the
power is only intended to be used should the reforms elsewhere in the package not lead
to sufficient changes in productive investment or the voluntary commitment is not
realised. On current estimates, it is estimated around £50bn could be additionally
invested (see paragraph 58, with around half of this being additional UK-based) by 2030
from the Accord.
• Additionality is hard to estimate to measure - The Pension Schemes Bill measures,
along with wider government policy such as the National Wealth Fund, are already
expected to drive additional investment in productive domestic assets. A DC market of
‘megafunds’ will be able to access these private investments much more easily due to
scale, and these investments often have a higher domestic bias compared with traditional
asset classes (e.g. listed equities). This should allow the Government aim of increased
50
https://www.gov.uk/government/news/pension-schemes-back-british-growth
43.
43
pension capital beinginvested in productive domestic investments to be met without such
mandation powers being utilised. As schemes continue to grow, there has already been
an increase in scheme-set targets towards greater productive assets, and therefore the
net additionality would also be challenging to know (especially as not all schemes
disclose, due to commercial sensitivity the detailed allocations and forward projections).
• The policy specifics would be in secondary legislation: Ahead of any use of the
power, there will be a market assessment report to shape the design of any powers used.
This means if these powers were to be utilised, it will be subject to a range of, currently
unknowable, factors. For example, the power may specify specific asset classes - such
as infrastructure – but this could vary and would significantly impact the estimated
cost/benefit. The required amount may be higher or lower than current industry
commitments – hugely impacting the potential cost/benefit.
o The powers would also need to be tailored to the state of the market and recognise
the transition time that may be required to achieve a certain threshold. Consequently,
if an example policy were set out and monetised, this may differ significantly from the
true policy if it were ever implemented, with the costs and benefits estimated being
misleading.
• The implementation period is unknown: As well as the specifics regarding the powers
being unknown, they could also be implemented at various points in time. Consequently,
given the utilisation of discounting, assumptions regarding the exact implementation
period would impact monetisation. Alongside this, the size of costs and benefits would be
dependent on the state of the market at the point of implementation, which will also be
highly sensitive to the unknown implementation period.
• The market response to the other Bill measures is highly uncertain: If a higher
proportion of schemes were already investing at a level which exceeded any thresholds,
then the monetised costs and benefits would be smaller, given that fewer schemes would
be required to adjust their investment strategies and there would be less ‘additionality’
delivered by the power. While projections can be made regarding the state of the future
market, these are ultimately highly uncertain and determined by provider behaviour,
particularly the reaction to the other Pension Schemes Bill measures, which is currently
uncertain. Any monetisation of mandatory asset allocation changes would also have to
assume, at provider level, which specific assets are divested from and which are then
invested into, and the returns then earned on these specific investments, all of which
cannot be known.
• Fees paid for productive assets are commercially sensitive: There is currently limited
publicly available information regarding the fees paid by providers when investing in
productive assets, which are highly commercially sensitive. Given these would be an
important input into any monetisation exercise, any resulting costings would be highly
uncertain and could only be estimated at a high-level. The absence of publicly available
information likely stems from market competition, with providers being unwilling to
disclose the exact commercial agreements they have made, with competitors being able
to utilise this information in their own strategy and negotiations.
55. DWP remain committed to better understanding the impact of this proposal and as the policy
is finalised to assess the potential impact, where this is appropriate to do so.
44.
44
56. Although formalimpacts cannot be estimated, any (reasonable) increase in productive
assets may deliver positive outcomes51
as (and as outlined further in the DC Megafunds IA):
• Member outcomes may be greater through a slightly greater allocation to private
markets.
• Investing in private markets leads to greater diversification which should help
support risk-adjusted member outcomes
• Investment in the UK could support the wider UK economy and growth.
57. As outlined in Paragraph 48, the Mansion House Accord demonstrated the willingness from
industry to voluntarily boost allocations to private market assets, without the need for
legislative powers. An indication of the potential level of unlocked investment through such
changes to asset allocation (delivered through the Accord) is detailed below.
58. The 17 signatories of the Mansion House Accord, accounting for around 90% of active DC
savers, have estimated to the Association of British Insurers (ABI) that £252 billion worth of
assets are currently in scope of the pledge52
.
• As the Accord is only due to be met by 2030, this starting in-scope AUM of £252
billion is projected to 2030 based on historical Master Trust growth rates (average
over the last 5 years53
). This is halved to reflect a maturing market and the fact GPPs
may be growing more slowly. This results in an annual assumed growth rate of
assets of 17%. This is also broadly consistent with average investment returns
(around 8%) and contribution levels entering the DC market54
.
• To reflect further consolidation in the pensions market (for example, due to DC
Megafunds, VfM and Contractual Override, all of which could be expected to lead to
more assets in these in-scope default funds), an additional £60bn is added into the
‘in-scope assets’ projection from 2027-2029 (in £20bn increments). This is based
on, and consistent with, the methodology laid out in the DC Megafunds Impact
Assessment.
• This means it could be expected around £735 billion worth of assets are in-scope of
the Accord by 2030 (cash terms).
• It is currently estimated that the DC market allocates 3.5% of assets to the ‘private
market’ asset classes covered by the Accord55
. In the baseline scenario (without any
change), this would mean the £735 billion in-scope market size would allocate £26
billion to private markets. It is also estimated that 40% of these existing private
investments are ‘UK-based’55
, this would mean £10 billion worth of UK-based private
investment in a baseline scenario.
• The success of the Mansion House Accord would instead mean 10% of in-scope
assets are allocated to private markets. This would mean the £735 billion worth of
assets allocated £74 billion to private markets, £48 billion higher than the
‘baseline’ scenario. This would also mean 50% of private market investments are
51
www.gov.uk/government/publications/pension-fund-investment-and-the-uk-economy/pension-fund-investment-and-the-uk-
economy
52
https://www.gov.uk/government/news/pension-schemes-back-british-growth
53
Based on TPR DC scheme assets data
54
Around £60bn is saved into annual private-sector schemes, for example, from an industry AUM of around £600bn.
55
https://assets.publishing.service.gov.uk/media/673f3ca459aab43310b95a8d/pension-fund-investment-uk-economy.pdf
45.
45
‘UK-based, resulting in£37 billion worth of UK-based private investment, £26 billion
higher than the baseline scenario.
£bn (cash terms) Private Market
Investment
… of which UK-based
Baseline £26 £10
With Accord £74 £37
Additionality (impact) +£48 +£26
Cost savings
59. Alongside the potential additional investment in private markets, there has been a strong
interest in the savings which might arise to industry from the reforms. Individual policies are
assessed in detail (see individual IAs). Evidence suggests scale could deliver over 10 basis
points reduction in fees. This is derived from a number of sources:
• The Pension Investment Review consultation responses suggested consolidation of
pension providers could lead to reduced charges by up to 10-20bps over the longer
term.
• DWP charges survey shows around 12bp difference in charges between smallest
and largest GPP/MTs56
.
• People’s Partnership research, conducted by Toby Nangle57
, found:
o Internalising investments could save members hundreds of millions a year
with “nearly £1bn in potential fee savings available”.
o Australia had around 12bp cost reduction through scale, based on CEM
benchmarking data.
60. Taking a “top down” approach. If the overall DC market is estimated to be around £800bn-
£900bn (current earnings terms) by 203058
, then a 12bp reduction in cost applied to £800bn
industry would result in a £960m saving in 2030. This is likely an ‘upper bound’ estimate as it
assumes gains are made across the entire market.
61. To assess the likelihood of this approach, a “bottom up” approach is applied considering the
various measures and impacts within this Impact Assessment. The IA shows:
o Contractual Override could generate annual provider savings in the range of £20m to
£90m depending on the amount of assets that providers consolidate.
o DC Megafunds could generate around £200m average annual savings from 2030
onwards59
.
56
https://www.gov.uk/government/publications/pension-charges-survey-2020-charges-in-defined-contribution-pension-
schemes/pension-charges-survey-2020-charges-in-defined-contribution-pension-schemes
57
https://peoplespartnership.co.uk/media-centre/press-releases/workplace-pensions-industry-could-save-hundreds-of-millions-
of-pounds-in-private-market-fees-new-report/
58
For example:
https://www.gov.uk/government/publications/trends-in-the-defined-contribution-trust-based-pensions-market/trends-in-the-
defined-contribution-trust-based-pensions-market; and
https://www.pensionspolicyinstitute.org.uk/media/hbrgvfw5/20240926-the-dc-future-book-2024-final.pdf
59
It is estimated, within the IA, around half of this gain may be passed onto members in the form of lower charges.
46.
46
o Other measures,such as small pots, are likely to generate savings of £100-£200m
per year.
This would estimate annual average savings closer to around £0.5bn; though these
calculations are likely on the conservative side as further economies of scale may be
realised from the measures, providing a ‘lower bound’ estimate given calculations are based
on specific sections of the market.
Interactions
62. As previously outlined, the impacts of each measure in the Bill have been considered
individually, with separate IAs produced for each relevant policy. This was considered the
most appropriate mechanism given the very wide-ranging nature of the Bill, covering
significantly different parts of the pension industry and savers, along with the available
evidence and available time to produce an assessment.
63. However, the Bill is a package of measures all designed to support a number of outcomes
and designed to complement each other in achieving this. The Bill seeks to:
▪ Deliver stronger member outcomes through supporting members during
accumulation by ensuring providers are delivering good value for money and
supporting decision-making at retirement through offering decumulation products.
▪ Support economic growth through pension funds being able to invest in more
productive assets (such as infrastructure and private equity), which have a stronger
home bias, compared to other assets such as listed equities.
▪ Build a pension market with fewer, but larger, pension providers with the scale and
capability to invest in a wider range of asset classes.
▪ Support employers by removing poor performing pension funds from the market,
provide access to alternative DB solutions, and opportunities to access the surplus in
their DB scheme.
64. Table 5 outlines the potential interactions between the DC measures in the Bill and
discusses the likely impacts this may drive. This focuses on the DC industry, but there may
be interactions between DB measures, though to a lesser degree. Interactions are estimated
on a qualitative basis as estimating quantitatively cannot be known in advance. It will be
dependent on industry reaction/response, final policy details, and a large number of
behavioural responses. Any attempt to do this would add even greater uncertainty and would
require a number of uncredible assumptions.
65. The interactions may impact the cost/benefits across the total package, with potential for
movement in either direction:
o Overstate the benefits – The interactions may mean some of the benefits are
reduced. For example, VFM will drive improved performance and may result in poor
performing larger schemes already exiting the market and delivering scale to other
providers when their assets are merged. This would reduce the benefits of the DC
Megafund policy.
o Understate the benefits – A number of the costs may be reduced as the market
responses in advance of the measures coming into force. This may happen through
merging/consolidating into other providers (and thereby reducing the number of
47.
47
schemes and thuscost of implementation). For example, providers who are unlikely
to meet the AUM threshold by 2030 (DC Megafunds policy) may:
• Exit the market earlier
• Not invest in developing future policies, such as decumulation products, as
they know they will not be staying in the marketplace.
On balance, the interactions could work in either direction and therefore the individual policy
estimates are considered the most appropriate to estimate the impact of the Bill. Further
details can be developed at Secondary Legislation and as final policy details emerge.
66. The interactions between the measures also highlight challenges of delivery which continue
to be a focus for policymakers in making the measures a success. There are notable
challenges, which are being mitigated against, around:
▪ Industry capacity – There are a large number of reforms to be implemented over
the rest of the decade, which may put pressure on the pension industry. However,
many of the reforms have been in the pipeline for years (such as VFM) and some
reforms are designed specifically to address industry challenges (such as Small
Pots). Many measures, such as via the Pension Investment Review, have been
consulted on as a wider package to give industry notice.
▪ Sequencing – It is important to get the sequencing of policy reforms right. For
example, delivering VFM tests ahead of Small Pots and DC Megafunds will ensure
pension pots are not consolidated into poor performing schemes, as those
funds/providers will no longer be operating in the market. This is a key area of focus
for Government.
67. Overall, taking the various DC measures together, it is estimated by 2030:
o There will be around 300-400 DC schemes which remain (down from around 1,000
currently).
o Around 10-20 multi-employer DC Megafund providers operating (down from
around 60 multi-employer schemes currently). This would constitute around a
doubling in ‘Megafund’ providers compared to current levels.
48.
48
Table 5:
Interactions inDC
Market
Value for Money DC Megafunds Small Pots Decumulation
Value for Money Both aim to increase
consolidation in the DC
market and build scale among
providers.
Fewer providers and default
arrangements from the
introduction of DC Megafunds
will likely reduce the cost of
VFM as fewer assessments
will be needed across the
industry (though Megafunds
will only impact multi-employer
schemes).
VFM and DC Megafunds
should accelerate scale
benefits quicker, leading to
greater investment in the UK
and help improved member
outcomes.
Both should improve value for
members. Reducing costs to industry
via removing loss-making pots should
make greater returns and value for
members easier to achieve.
Fewer providers should mean fewer
pension pots under £1,000 and
therefore fewer transfers required.
VFM will ensure small pots are only
consolidated into good value default
consolidator schemes. VFM also helps
build scale for providers for those
who become default consolidator,
which should drive efficiencies and
reduce the cost of holding low value
pension pots.
VFM will decrease the number
of schemes in the DC market,
reducing the cost of schemes
developing a decumulation
product.
Although VFM is focused on
accumulation, the transparency
of information may help deliver
better decumulation investment
strategies and lead to greater
investment returns. This would
lead to greater pension pot
sizes and generating greater
benefits for the decumulation
policy.
DC Megafunds Both aim to increase consolidation in
the DC market and build scale among
providers.
Fewer providers and default
arrangements from the introduction of
DC Megafunds will likely reduce the
cost of VFM as fewer assessments will
be needed across the industry (though
Megafunds will only impact multi-
employer schemes).
Fewer providers should mean fewer
pension pots under £1,000 and
therefore lower number of transfers
required.
Additional scale should help reduce
the cost of managing small pension
pots and therefore result in default
consolidators becoming a more
attractive proposition.
Megafunds will decrease the
number of schemes in the DC
market. This would reduce the
overall number of schemes
required to offer decumulation
and thus lowering
cost/requirement.
Megafunds will drive scale
which may help increase
investment in innovation in the
decumulation market and
increase the likelihood of multi-
49.
49
VFM and DCMegafunds should
accelerate scale benefits quicker,
leading to greater investment in the UK
and help improved member outcomes.
employer schemes offering their
own suite of decumulation
products.
Small Pots Both should improve value for
members. Reducing costs to industry via
removing loss-making pots should make
greater returns and value for members
easier to achieve.
Fewer providers should mean fewer
pension pots under £1,000 and
therefore fewer transfers required.
VFM will ensure small pots are only
consolidated into good value default
consolidator schemes. VFM also helps
build scale for providers for those who
become default consolidator, which
should drive efficiencies and reduce the
cost of holding low value pension pots.
Fewer providers should mean
fewer pension pots under
£1,000 and therefore lower
number of transfers required.
Additional scale should help
reduce the cost of managing
small pension pots and
therefore result in default
consolidators becoming a
more attractive proposition.
Fewer pension pots at
retirement (and those pots being
of greater value) should help
increase the likelihood a
default product is offered
(rather than being exempt
through a small pot value).
Fewer pots should also help
members be able to better
manage their pots as they
have fewer pots to oversee and
lower likelihood of pension pots
becoming lost.
The reduction in loss-making
pots should free up money for
investment in decumulation
products and service.
Guided
Retirement
VFM will decrease the number of
schemes in the DC market, reducing
the cost of schemes developing a
decumulation product.
Although VFM is focused on
accumulation, the transparency of
information may help deliver better
decumulation investment strategies and
lead to greater investment returns. This
would lead to greater pension pot
sizes and generating greater benefits
for the decumulation policy.
Megafunds will decrease the
number of schemes in the DC
market, reducing the
cost/requirement of schemes
to offer a decumulation
product.
Megafunds will drive scale
which may help increase
investment in innovation in
the decumulation market and
increase the likelihood of multi-
employer schemes offering
their own suite of decumulation
products.
Fewer pension pots at retirement (and
those pots being of greater value)
should help increase the likelihood a
default product is offered (rather
than being exempt through a small pot
value).
Fewer pots should also help members
be able to better manage their pots
as they have fewer pots to oversee
and lower likelihood of pension pots
becoming lost.
The reduction in loss-making pots
should free up money for investment
in decumulation products and service.
50.
50
Individual benefits
68. ThePension Schemes Bill has significant impacts on individual outcomes, enabling people
to receive greater amounts from their DC pension pot (and increasing their likelihood of
receiving their full DB pension). For example, through lower costs being passed on or
greater investment returns.
69. There are also estimated benefits to members across the package of DB measures.
However, as a DB pension is a promise based on earnings and length of service, the
measures do not translate as easily into monetary gains. Nevertheless, the two key
measures could deliver material gains to individuals:
▪ An increased likelihood of members receiving their full benefits of around 4
percentage points for those entering a Superfund.
▪ A share of the £4,200m which is estimated could be accessed from a pension
scheme and provided to pension savers, should there be the assumed 50:50 split of
benefits between employers and members.
Risks & Assumptions
70. The Pension Schemes Bill has a wide-ranging and significant impact on the pensions
landscape. Although best available evidence, data and assumptions are used, there remain
a number of significant risks and uncertainties on the impacts. As a result, sensitivity
analysis across all the measures has been conducted with each measure outlining the key
uncertainties and risks from the estimates.
71. The main areas of risk are listed and RAG-rated below (Red = significant analytical/policy
risk or significant driver of IA modelling; Green = low impact risk or assumption and/or
unlikely to significantly impact IA modelling).
72. Final policy detail (red) - At this stage there remains uncertainty about the detail of some
proposals where detail will be added in secondary legislation. As a result, the IAs present the
best available estimate but recognise these could change as policy details are finalised.
73. Investment returns and market movements (red) – Market performance may significantly
impact the proposals across a number of measures. For example:
o DB schemes funding positions are constantly changing in response to market
movements. This has an impact on the amount of surplus and whether schemes are
better or worse funded when considering whether to enter a superfund or be able to
reach buy-out with an insurer. Market movements cannot be known and an
increasing number of DB schemes are “hedging” their assets, limiting (or fully)
mitigating the risks of future funding levels.
o Across VFM and decumulation, a significant benefit to members is the improvement
in investment returns. Although it is anticipated, relative to the counterfactual, there
would still be a gain in performance, this may be impacted by financial market
movements which cannot be known in advance.
74. Behavioural change (red) – The impact of a number of measures will be dependent on how
providers and individuals respond to the reforms. Any behavioural assumptions are highly
51.
51
uncertain and willdepend on the design of the policy, particularly around the ease of opting
out. Assumptions on behaviour change are based on responses to similar policies and the
best available evidence. Nevertheless, some policy areas are unknown and mean a
simplistic, arbitrary assumption is used. For example:
o Share of DB surplus split – It is assumed this is evenly split between the employer
and the member. This is not Government policy, rather the assumption that has been
made. However, in reality, this will likely vary by each provider and cannot be known
in advance, given limited evidence at this point.
o Take-up of default decumulation offer – Defaults in pension systems are powerful,
such as around 9-in-10 eligible employees saving into a workplace pension from
Automatic Enrolment and over 94% of savers remain invested in their schemes’
default investment strategy. However, other defaults may have less of an impact
depending on how well the options are communicated, engagement by individuals,
and individual preferences. For the proportion entering a default retirement product, it
is assumed people currently engaging via financial advice or guidance do not change
their decision. Of those who do not seek support, then around 50% are assumed to
enter the default solution (based on evidence from similar initiatives from the FCA’s
Investment Pathways policy).
o The number of Multiple Default consolidators – For the purposes of the Small
Pots IA it is assumed that there are five consolidators. This is not government policy
and will be decided by the number of providers who apply to and meet the criteria to
be a consolidator. Based on informal discussion with industry as part of the Small
Pots Delivery Group, five was decided as the best assumption. Though providers
may respond to the reform in a different way, leading to a different number of
consolidators. This would not necessarily impact the overall magnitude of the
change; but may increase/decrease the transfers across providers.
75. Commercial sensitivity (amber) – Some policy areas may have a noticeable impact on a
small number of providers, (such as DC Megafunds). This presents a challenge in both the
level of information available (as not all information will necessarily be shared with
government) and what can be included in the IAs (as it would not be appropriate to discuss
individual schemes who may be impacted). This has an impact on the coverage of some of
the IAs; but the balance between transparency and commercial sensitivity has been sought
throughout.
76. Competition impacts (amber) – The DC pension market continues to consolidate, and the
reforms will further drive consolidation, reducing the number of providers in the market. The
vast majority (over 90%) of savers are in multi-employer schemes which are estimated to be
reduced to from around 60 schemes to 15-20 schemes. However, the vast majority of savers
are already in a small number of providers and competition is already very strong across the
industry (reports suggest business is won or lost by a few basis points). Therefore, although
this will be monitored closely, the impacts via competition are not expected to be significant.
77. Cost and data assumptions (Green): Where robust survey data does not exist, the
industry costs calculated across the Impact Assessments have been extrapolated from
industry feedback, similar policy initiatives, and discussions with key stakeholders. The costs
and data will be further improved as the policy is finalised.
52.
52
Sensitivity Analysis
78. Recognisingthe uncertainty across the methodologies and data (outlined in the section
above), sensitivity analysis has been conducted across all of the measures. More detail is
outlined in the individual IAs, but key variations have included:
▪ Investment returns are a key driver of the returns on VFM and decumulation. This
reflects that even just small changes in investment can accumulate and add up over
time. As the evidence shows, there is a huge variation in investment returns across
the market (from less than 4% annualised returns to over 12%)60
and markets are
inherently volatile. Therefore adjusting on this assumption is appropriate to test the
potential impacts on returns.
▪ Take-up of measures – A number of measures are dependent on take-up of
individuals and employers. Therefore these have been adjusted to reflect potential
lower and higher scenarios of take-up, such as the extent employers will access a
surplus or the take-up of a default offering at retirement.
▪ Differences in familiarisation costs – Most costs of implementing are based on
industry feedback and surveys. However, these have been adjusted to reflect the
uncertainty given some of the final details are still to be decided.
79. The table below presents the summary low, middle, and high net present social value
estimates across the measures. It can be shown the Bill is estimated to deliver an overall net
benefit to society (largely to members) even under a low scenario. For more detailed
sensitivity analysis, please see the individual IA.
Low NPSV (£m) Best estimate NPSV (£m) High NPSV (£m)
Value for Money £6,014 £19,364 £29,669
Small Pots £600 £1,245 £1,936
Guided Retirement £270 £1,550 £6,424
DC Megafunds £847 £1,911 £2,976
DB Superfunds -£1,670 £935 £3,559
DB Surplus £1,332 £8,393 £15,454
Total £7,393 £33,399 £60,019
Wider Impacts
80. Economic growth. The measures across the Pension Schemes Bill are pro-growth in a
number of ways, as they seek to encourage greater investment in the UK economy. For
example:
o Employers reinvesting in their business – The return of a surplus to a business
would allow employers to invest in their business and generate longer term returns.
This could support future growth and employment across the employer, driving wider
macroeconomic impacts. The Bank of England previously analysed the impacts on
firm behaviour when they were paying into schemes to meet large pension deficits
(i.e. the reverse of the current situation). This found61
“firms with larger pension
60
https://capa-data.com/
61
https://www.bankofengland.co.uk/-/media/boe/files/working-paper/2018/growing-pension-deficits-and-the-expenditure-
decisions-of-uk-companies.pdf
53.
53
deficits voluntarily paylower dividends, but they do not invest less. However, firms
that are required to make deficit recovery contributions by the regulator have lower
dividend and investment expenditure compared to other firms, and more so if they
are financially constrained.” Consequently, there is a link between funding towards
DB schemes and firm investment expenditure which could be influenced by the
policy.
o Greater wages – Firms receiving additional money from accessing a surplus may
seek to increase wages across the workforce. If this happens, this could boost
economic growth through individuals facing a greater than normal pay rise and thus
increasing consumption. Resolution Foundation62
previously estimated funding DB
deficits was potentially contributing to lower average employee pay by 0.2%-0.3% in
the 2010s. As a result, there is a link between DB funding and wages across the
economy.
o Higher consumption – Money paid to members maybe ultimately be spent in the
economy, boosting growth.
o Greater allocation towards more UK assets – By achieving scale in the DC
market, pension funds should be able to access a wider range of productive asset
classes, including private market assets (private equity and venture capital,
infrastructure and property, private credit, etc.). These assets require more direct,
expert investment management and have closer links to improved economic growth
outcomes. Analysis63
supporting Phase One of the Pension Investment Review found
these wider asset classes to have a ‘home bias’ when compared to more traditional
assets, such as listed equities. Consequently, a market that is better able to access
these assets will, provided there is an investible supply of opportunities, also invest
more in the UK economy.
o Greater investment in the UK may support more liquidity in capital markets.
Additional inflows into UK asset classes and capital markets could create a virtuous
cycle, whereby these markets becoming deeper, more liquid, and more efficient. This
could in turn improve the attractiveness of UK markets, increasing both the supply of
and demand for investible opportunities across UK markets.
81. A DC Market with greater scale can increase ‘block ownership’ of UK economic assets.
A market of ‘megafunds’ could be expected to increase ‘block ownership’ of UK economic
assets, making asset ownership less dispersed and more focussed on long-term
performance. Block ownership is where a firm has a shareholder that is able to influence firm
decisions through their voting rights. Ownership of UK firms has become increasingly remote
and dispersed over time – pension funds owned 32% of UK-listed firms in 1992 but this had
fallen to under 2% by 2022 as ownership increasingly became overseas. This means UK-
listed firms often lack a ‘blockholder owner’ that used to be fulfilled by the pension fund. By
contrast, Germany has also seen its listed firms become more overseas-owned, however
family owners continue to be prevalent, meaning its firms still have significant domestic block
62
https://www.resolutionfoundation.org/app/uploads/2017/05/The-pay-deficit.pdf
63
https://www.gov.uk/government/publications/pension-fund-investment-and-the-uk-economy/pension-fund-investment-and-
the-uk-economy
54.
54
ownership64
. As theResolution Foundation outline “the large stakes of blockholders also
insulate managers from short-term pressures to boost earnings at the expense of
investment” 65
. Achieving scale in the UK DC market means pension funds will have the
capacity and expertise to once again take significant equity stakes and become block
owners in businesses and large-scale projects, such as infrastructure.
82. By having material stakes in domestic firms and projects, pension fund investment can
improve corporate governance, as institutional investors with long-term horizons can
engage more actively with management, promoting sustainable business strategies and
improved performance over short-term shareholder returns. Owning such large stakes can
also give enhanced, or more direct, voting rights to the pension fund, further allowing long-
term performance to be prioritised. Larger stakes in critical projects such as renewable
energy and digital infrastructure can also facilitate strategic investment that aligns with
national priorities.
83. Distributional effects. Currently, members of DB schemes have more generous pension
outcomes and greater contribution levels. The average DB contribution level is around 20%
compared to around 8% in DC schemes66
. The ability to fund DC schemes from DB surplus
may help give a boost in contribution levels to members (often younger and lower paid) in
DC67
. Additionally, guided retirement products should help ensure individuals are well
supported at retirement, even if they are unable to access financial advice or guidance. This
is most likely to benefit individuals who may have lower incomes and pots.
84. Accelerated consolidation. The Bill’s measures will drive consolidation across the pension
landscape, leading to fewer, but larger, pension schemes, with the scale benefits outlined
previously.
Small and Micro Business Assessment (SAMBA)
85. Pension schemes are different to many other businesses as they may hold a large amount
of assets but not necessarily employ large number of employees. Many pension schemes
are also not businesses seeking a profit but looking after pension contributions to deliver for
their members, and small schemes may be run by large businesses/employers.
86. It is important to note the Government is aiming for a pensions landscape which has fewer,
but larger, pension schemes. This reflects the very strong evidence that scale can bring
significant benefits, and strong governance and oversight is essential in an industry worth £2
trillion. However, it is recognised smaller providers can provide good value for their members
too.
64
https://economy2030.resolutionfoundation.org/wp-content/uploads/2023/06/Beyond-boosterism.pdf
65
https://economy2030.resolutionfoundation.org/wp-content/uploads/2023/06/Beyond-boosterism.pdf
66
DWP analysis of ASHE 2023
67
For example, Schroders recently announced using their DB surplus to support DC contributions.
https://www.schroders.com/en/global/individual/media-centre/schroders-uk-pension-scheme-commits-to-running-on-and-
harnessing-db-surplus-for-dc-contributions/
55.
55
87. To beconsistent with the Pensions Dashboard Impact Assessment68
, as well as with other
Pensions Scheme Bill Measures, Small and Micro businesses are defined as schemes
having fewer than 1,000 members (DC) and less than 100 members (DB). This is not a
perfect definition of a small/micro business as scheme size and employer size do not always
perfectly correlate, but best attempts to estimate the impact on smaller schemes.
88. Each IA has a SAMBA assessment and outlines, in detail, the impacts and reasons for
inclusion (or exclusion). Across the measures, 3 key areas have been considered in the
policy-making process:
▪ Exemptions – Should there be exemptions for small/micro schemes?
▪ Proportionality – Is the measure proportionate and not putting disproportionate
costs on business?
▪ Mitigations – What mitigations can be put in place to support small and micro
businesses.
Exemptions
89. Most measures include small and micro pension schemes. The exceptions to this are the
exclusion of DC micro schemes (those with less than 12 members) across the measures as
these are often unique arrangements and exempt from other pieces of legislation. The
exception is the DC Megafunds concept where no small/micro schemes are expected to be
impacted.
90. Consideration on the scope of the policies has been considered in detail. However, many of
the challenges and problems across the market apply to smaller schemes in the same way
as they apply to larger schemes. For example:
o Individuals are at risk of poor performance regardless of whether they are
working for a smaller or larger employer. It is therefore appropriate all pension
schemes are considered so individuals are not at risk of losing out given they do not
choose their scheme.
o Imperfect information means having consistent information across the market is
imperative. This should support and help smaller businesses as they can more
accurately assess their own performance against larger schemes to consider if they
are still able to deliver value for money.
91. In addition, a number of the measures are directly aimed at providing support to smaller
businesses, and therefore exclusion would mean they would lose out. This is particularly the
case for:
o DB surplus – The aim of the policy is to encourage, where appropriate, sharing of
the surplus between employers and members which has arisen in the scheme. This
could be a significant financial boost for smaller businesses. Therefore, excluding
these schemes from the potential benefit would not be appropriate.
o DB Superfunds – This creates a more permanent and regulated alternative for
businesses to consider passing on their DB scheme. Excluding smaller schemes
68
Pensions Dashboards Impact Assessment https://www.legislation.gov.uk/ukia/2022/81/pdfs/ukia_20220081_en.pdf
56.
56
from accessing thisalternative end game would not be appropriate, and result in
them missing out on a key benefit.
o DC Small Pots – These pots are loss-making for the industry; therefore, excluding
smaller schemes would mean they’d continue to make a loss whereas larger
schemes would be able to benefit through sending these to default consolidators.
Therefore it would not be appropriate to exclude smaller schemes.
Proportionality
92. As can be shown across the measures, the total cost on businesses is relatively low and in
some cases generates a net benefit (such as small pots). This should also be considered in
view of the potential indirect benefits estimated. For example, DB small schemes (those with
less than 1,000 members) have over £110bn in assets69
. Accessing just a small fraction of
the surplus could easily result in hundreds of millions becoming available for smaller
businesses. This could be a significant benefit to support smaller businesses.
93. The measures will also support small and micro businesses indirectly through the availability
of information, helping reduce search costs. For example, the Value for Money measure is a
cost for small/micro pension schemes. However, this delivers a benefit to all small and micro
businesses across the economy through providing more consistent and timely information on
the pension market. This creates benefits for employers when selecting or switching pension
schemes. These benefits are not captured but could be significant.
94. Additionally, as the VFM measure shows, there are large member benefits by including
smaller schemes (over the 10-year appraisal, there is £320m (£240m NPV) additional
money in these schemes compared to the counterfactual where performance does not
improve (sum of ‘VFM Benefit to members’ line). The vast majority of these benefits are
direct benefits for members (not to small schemes directly, but members in these schemes)
as they are the ultimate asset owner. However, smaller schemes will also see increased
charge revenue on these improved returns, estimated at around £1m over the appraisal
period (sum of VFM benefit to small schemes’ line).
Mitigations
95. A number of mitigations have been identified and put in place to best support smaller
schemes where appropriate. For example:
o Creating arrangements in guided retirement – Schemes can choose to create an
arrangement with a larger provider rather than needing to create and develop (at
significant expense) their own decumulation solution. This was developed to support
smaller schemes have a cheaper alternative to the legislation whilst still supporting
members within those schemes.
o Phasing in – Many of the measures may be phased in, such as guided retirement,
which will start with the larger providers. This gives smaller schemes greater time to
understand the legislation and spread costs over a longer period of time.
o Voluntary nature – Many of the measures, such as DB surplus and DB Superfunds
are, ultimately, voluntary. It is expected Trustees will need to familiarise themselves
with the legislation. However, they may choose not to or take a light touch approach
69
https://www.ppf.co.uk/-/media/PPF-Website/Public/Purple-Book-Data-2024/PPF-The-Purple-Book-2024.pdf
57.
57
if they haveno plans on taking action. This would bring down the costs.
Measures Exemptions EANDCB for
Small and
Micro
Businesses
(2024 prices)
Value for Money The policy proposes to exclude Small Self-
Administered Schemes (SSAS) and Executive
Pension Plans (EPP). The measure will also
exempt small arrangements (those with fewer than
1,000 members) unless this is their main default.
£31m
Small Pots The policy proposes to exclude Small Self-
Administered Schemes (SSAS) and Executive
Pension Plans (EPP). At this phase the Default
Consolidator framework would not be applied to
these micro schemes due to the cost they would
incur as a result.
-£0.7m
Guided
Retirement
The policy proposes to exclude Small Self-
Administered Schemes (SSAS) and Executive
Pension Plans (EPP). The policy has also been
adapted to allow schemes to create arrangements
with larger providers to offer products rather than
requiring smaller schemes to have to invest in
creating new products themselves.
£3.6m
DC Megafunds The policy is restricted to multi-employer DC
workplace pension schemes, none of which are
estimated to meet the definition of being a small or
micro business.
Nil
DB Superfunds All DB schemes, of all sizes, are able to access a
Superfund should they choose to.
£0.1m
DB Surplus All DB schemes, of all sizes, are able to access a
surplus should these choose to.
£0.1m
Monitoring & Evaluation
96. The Bill presents a significant change to the pensions landscape over a number of years.
Therefore, DWP are committed to putting in place a strong monitoring and evaluation plan to
ensure: the measures are meeting the objectives; learning takes place; and policies are
adapted as greater evidence emerges. Each measure has its own monitoring and evaluation
strand, but further information assessing how the overall Bill will be monitored is presented
here.
97. There are a wide range of existing sources which will provide key insights to monitor the
changes. These include:
▪ TPR Scheme Returns – TPR publish annual scheme returns from DC schemes,
providing a comprehensive overview of the DC trust landscape on assets,
memberships, and scheme numbers. This will be critical to monitor the rate of
consolidation happening across the market. In addition, an annual overview of DB
58.
58
schemes is provided(and publication of triennial valuations) to monitor the patterns
in the DB market.
▪ PPF’s Purple Book – PPF produce a thorough assessment of DB schemes each
year, looking at trends in DB schemes and the latest funding position. This will help
understand the movement into Superfunds market.
▪ FCA’s Retirement Income Market data – Every year the FCA publish information
on how people are accessing their pension in the contract-based market. This offers
in-depth information on the amount being accessed, the method this is being
accessed through (e.g. drawdown, annuity) and trends over time.
▪ Corporate Adviser GPP/MT Report – Corporate Adviser produce an in-depth
assessment of the multi-employer market each year, offering insights on
memberships, asset allocations, and returns. This will be essential in understanding
the changing market and growth of “megafunds”.
▪ DWP Employer Survey – DWP has regularly run a survey of employers with a
pensions module. This has regularly included questions around the types of factors
employers consider when choosing and switching pension schemes. This will be
important in understanding whether there is a trend towards greater value, over cost,
when choosing a scheme.
▪ FCA Financial Lives Survey – Every 2 years, the FCA publish a large-scale
quantitative survey covering all aspects of accumulation and decumulation. This will
help understand the trends and plans of people accessing a pension.
▪ HMRC RTI data – The Department currently receives monthly management
information from HMRC RTI on pension participation and how many people are
accessing a pension. This offers timely insights into trends, particularly around
decumulation, that will help understanding of the decisions individuals are taking.
▪ Wealth and Assets Survey – The ONS publish a household survey on wealth every
2 years. This has comprehensive information on pension wealth, particularly allowing
the number of pension pots (and the wealth in those pots) to be analysed in detail.
▪ TPR Trustee Surveys are regularly carried out across DC and DB schemes. This
will be a key source to understand take-up (such as accessing a DB surplus) and to
closely monitor how the benefits of a surplus are being shared between stakeholders.
▪ HMRC Tax data will allow timely monitoring of DB surpluses being accessed and the
number of schemes which are accessing this.
98. The reforms within the Bill themselves will further develop additional data and information to
understand the changing market landscape. Most notable, Value for Money requires
providers to provide historical data of their pension scheme. This will help assess the
performance across the market by provider. As part of regulators’ supervision of schemes,
this will be crucial to understand compliance, whether self-assessments are working, and the
level of detail is sufficient and transparent enough to support comparisons.
99. Further investment will be made in appropriate surveys and research to maximise the
understanding. Key considerations include:
o Employer Survey – The reforms are designed to have minimal impact on
employers. The reforms should make it easier for them to compare across providers,
ensure those providers offer good value for money, and have alternative options for
their DB scheme. To measure this it may be beneficial to have dedicated surveys
59.
59
(and potentially large-scalequalitative research) to explore employers’ understanding
of the measures, whether they have been impacted by the reforms, and assess if this
has encouraged greater switching of pension provider for their employees.
o Provider Survey (quantitative) – DWP has frequently conducted surveys with
providers to understand costs/charges. This has, in 2025, been extended to look at
investment returns. Alongside the existing surveys, a specific survey across the
industry may be beneficial to understand the emerging changes in performance and
asset allocation ahead of VFM being launched.
o Provider Survey (qualitative) – DWP are mindful of the large-scale reforms taking
place across the industry over a similar timeframe. Through qualitative research, the
capacity constraints and additional burdens/costs could be explored to ensure
policies seek to minimise these where possible.
o Member research (qualitative) – DWP have previously explored individual
decumulation journeys70
and views on small pension pot consolidation71
. Therefore
building on this work, it could be important to understand the views, attitudes, and
perspectives of individuals who may have (or will) be impacted by the measures. This
could help shape the policy design going forward and ensure there is no consumer
harm arising from the measures.
o Planning and Preparing for Later Life – DWP have run a large-scale quantitative
survey72
twice in the last 5 years. This offers vital information on views and attitudes
towards retirement and pension saving for those aged 40-75 years old. A further
wave could be important to understand the implications on individuals, how they are
responding to the reforms, and the impact on decision-making.
o Trustee survey to understand the impacts and decision-making process they have
gone through across a wide-range of reforms. For example: did they allow/stop a DB
surplus being accessed (and why) or how did they decide on their decumulation
arrangement.
100. This will all be supplemented by continuing to engage with industry, particularly
through further consultations once further policy detail is finalised. This will aim to minimise
the burden for schemes in scope. DWP do not want to create unnecessary administrative
burdens on schemes which will take resource away from their ability to provide good
outcomes for their members. Therefore, DWP are committed to keeping industry
communication open and learn from experience through different phases.
Equalities Analysis
101. This section records the analysis undertaken by the Department to enable Ministers
to fulfil the requirements placed on them by the Public Sector Equality Duty (PSED) as set
out under section 149 of the Equality Act 2010.
102. The PSED requires the Minister to pay due regard to the need to:
70
For example, https://www.gov.uk/government/publications/pension-freedoms-a-qualitative-research-study-of-individuals-
decumulation-journeys/pension-freedoms-a-qualitative-research-study-of-individuals-decumulation-journeys
71
For example, https://www.gov.uk/government/publications/understanding-member-engagement-with-workplace-
pensions/understanding-member-engagement-with-workplace-pensions
72
https://www.gov.uk/government/publications/planning-and-preparing-for-later-life/planning-and-preparing-for-later-life
60.
60
• Eliminate unlawfuldiscrimination, harassment and victimisation and other conduct
prohibited by the Act;
• Advance equality of opportunity between people who share a protected characteristic
and those who do not and;
• Foster good relations between people who share a protected characteristic and those
who do not.
103. There are nine protected characteristics according to the Equality Act 201073
:
• Age
• Disability
• Gender reassignment
• Marriage and civil partnership
• Pregnancy and maternity
• Race
• Religion or belief
• Sex
• Sexual orientation
104. This assessment considers equality impacts (with respect to the protected
characteristics) of the measures to be introduced in the 2025 Pension Schemes Bill. It aims
to ensure that:
• The Department’s strategies, policies and services are free from discrimination;
• The Department complies with current equality legislation;
• Due regard is given to equality in decision making and subsequent processes; and
opportunities for promoting equality are identified.
105. The Bill is a package of measures all designed to support a number of outcomes and
designed to complement each other in achieving this. The individual components of the 2025
Pension Schemes Bill are outlined in the introduction. The individual annexes include the
more extensive policy detail for each of these measures. This assessment considers how
these benefits could be distributed across different protected characteristics and across the
DB and DC markets.
106. It is important to note the Bill measures will apply to pension schemes generally
rather than being specifically targeted at certain subgroups of people. The affected
population is therefore all members of a workplace pension scheme with an active or
deferred private pension pot. Currently, around 88% of eligible employees are participating in
a workplace pension74
and around half of the working-age population75
are saving into a
pension. In total, around 70% of the working-age population have a private pension76
.
73
https://www.legislation.gov.uk/ukpga/2010/15/part/2/chapter/1
74
https://www.gov.uk/government/statistics/workplace-pension-participation-and-savings-trends-2009-to-2023
75
https://assets.publishing.service.gov.uk/media/65f84d59fc7fcf0011c64836/c6-pension-participation.xlsx
76
https://www.ons.gov.uk/peoplepopulationandcommunity/personalandhouseholdfinances/incomeandwealth/bulletins/totalwealthi
ngreatbritain/april2020tomarch2022
61.
61
107. Members mayhave multiple pots or entitlements across both DB and DC
landscapes, meaning they may be affected by multiple measures. Any identified equality
impacts are a result of the demography of active and deferred pension scheme members
rather than the policies targeting particular groups themselves. For this reason, the analysis
is split into two parts:
o Pension provision by protected characteristics to examine, across the nine
protected characteristics, which groups may be most impacted by the measures.
o Policy impacts which details each Bill measure to ascertain specific or potential
equality impacts; or indicate elements of measures more likely to affect certain
protected characteristics. It also references where equalities analysis has shaped
policy development.
108. The Equalities Analysis concludes no significant equality related concerns have
been identified. While certain protected characteristic groups may be more likely to benefit,
this is largely due to differences in pension provision rather than any wider equality issues
arising from the policy designs specifically. Any equality concerns identified have been
addressed either through specific exemption measures or through policy design elements to
ensure these characteristics are not discriminated against.
Summary of pension provision by protected characteristic
109. Analysis of pension provision by the different protected characteristics uses data
from the FCA’s Financial Lives Survey and the ONS Wealth and Assets survey77
. These are
reputable, representative, publicly available surveys with coverage of pensions, pension
wealth and pension types across the population; they also have a good pedigree of
supporting existing private pensions policy analysis – such as the Wealth and Assets Survey
supporting DWP’s gender pension gap publication78
. These surveys show which groups are
more likely to have pension provision and therefore making them more likely to benefit from
the Bill measures. The surveys also highlight whether pension provision is more likely to be
a DC or DB pension across these groups. This helps give a sense of which policies might
most impact certain groups. Analysis only considers active and deferred DB and DC pots
across the working-age UK population, pots which have been accessed are not included in
the analysis.
110. Overall, 31% of the working-age population of the UK do not have any private
pension coverage. 26% of the population have a DB pension and 48% have a DC pension –
some people may have both a DB and DC pension. This highlights there will be greater
numbers impacted by DC reforms compared to DB reforms. Across the measures, these
generate overall positive benefits to members. As a result, any group more/less likely to be
impacted would see a higher/lower benefit from the measures.
Age
77
https://www.fca.org.uk/publications/financial-lives/financial-lives-survey-2022-key-findings ;
https://www.ons.gov.uk/peoplepopulationandcommunity/personalandhouseholdfinances/incomeandwealth/bulletins/totalwealthi
ngreatbritain/april2020tomarch2022
78
https://www.gov.uk/government/statistics/gender-pensions-gap-in-private-pensions/the-gender-pensions-gap-in-private-
pensions
62.
62
111. There aredifferences in pension provision by age group. People aged 18-24 are
much less likely to have a pension. This is partly driven by lower employment levels due to
education (this group are less likely to be in full-time employment79
) and AE eligibility (those
aged under 22 are not automatically enrolled into a workplace pension). The proportion of
working-age people having ‘no pension’ declines with each age group, likely reflecting the
greater likelihood of having been in employment and accrued a pension during their career.
The proportion with a pension also drop-offs for those aged 55 to 65, reflecting many
members are likely to have accessed their pension by this point (pensions can currently be
accessed at 55 years old). The trend reflects the career journey’s of people; building up
pension entitlement over their career before then accessing in later life.
112. The likelihood of having a DB pension grows with age, many of which are now in
‘decumulation’, reflecting the historical popularity of DB pensions, which has declined over
the last 30 years. Only around 200 DB schemes remain fully open in the private sector80.
Age Group81
No Pension DC DB
18-24 68% 26% 6%
25-34 25% 56% 20%
35-44 24% 54% 25%
45-54 21% 54% 35%
55-64 20% 55% 48%
65-74 19% 24% 57%
75+ 28% 13% 44%
Source: Financial Lives Survey 2022
113. Although the evidence highlights older age groups are more likely to be impacted by
pension measures in the first instance, the greater impacts on the final pension may be more
likely to arise for younger cohorts. This is because pension reforms will take years to be
implemented, and the gains will compound over a working career. Evidence shows pension
provision has grown for all eligible age groups since the introduction of Automatic Enrolment,
and particularly younger people (see chart below)82. Therefore, there is a greater likelihood
this group will have greater DC pension provision, over time, compared to older age groups
who did not benefit from AE.
79
https://www.ons.gov.uk/employmentandlabourmarket/peopleinwork/employmentandemployeetypes/datasets/employmentunem
ploymentandeconomicinactivitybyagegroupseasonallyadjusteda05sa/current
80
https://www.ppf.co.uk/-/media/PPF-Website/Public/Purple-Book-Data-2024/PPF-The-Purple-Book-2024.pdf
81
Includes DB pensions in accumulation and decumulation as DB measures (e.g. surplus access) could deliver benefits to
pensions in both accrual and decumulation phases. The DC column includes pensions in accumulation and those decumulated
within last 4 years.
82
https://www.gov.uk/government/statistics/workplace-pension-participation-and-savings-trends-2009-to-2023
63.
63
Workplace pension participationof eligible employees by age groups
Sex
114. Women are less likely to have a pension compared to men. This may in part be
because women are less likely to be in employment and are more likely to earn less than
£10,00083
(the earnings threshold for being automatically enrolled into a workplace pension).
115. However, it is important to note, of those eligible for AE, women have a higher
pension participation rate (89%) compared to men (87%)84
. Yet, private pension wealth is not
equally distributed, and women have lower private pension wealth on average; the latest
published DWP analysis has estimated the ‘gender pension gap’ (the gap between median
male and female private pension wealth) at 35%84
, partly driven by the factors mentioned
above.
116. Women are more likely to have a Defined Benefit pension than men (28% vs 24%),
driven by a greater proportion of women working in the public sector where DB coverage
remains common. This highlights a greater likelihood of women who may be impacted from
the ‘LGPS Megafunds’ policy proposal. However, the LGPS proposals do not impact
individual pension entitlement.
Sex No Pension DC DB
Men 28% 54% 24%
Women 34% 42% 28%
83
Institute for Fiscal Studies (2023). https://ifs.org.uk/sites/default/files/2023-03/IFS-REPORT-R250-The-gender-gap-in-
pension-saving.pdf
84
https://www.gov.uk/government/statistics/gender-pensions-gap-in-private-pensions/the-gender-pensions-gap-in-private-
pensions
0%
10%
20%
30%
40%
50%
60%
70%
80%
90%
100%
2009 2010 2011 2012 2013 2014 2015 2016 2017 2018 2019 2020 2021 2022 2023
22 to 29 30 to 39 40 to 49 50 to SPa
64.
64
Source: Financial LivesSurvey 2022
Disability
117. People who have a severe disability85
are less likely to have a pension, with around
two-thirds of this group having no pension provision. This is likely driven by lower levels of
employment rates for those who are disabled86
. People with a less severe disability are more
likely to have a pension than people with a severe disability, although they are still less likely
to have a pension than people who are not disabled. This means any pension reforms will
have a greater impact on those without a disability.
Disability Status No Pension DC DB
No disability 26% 51% 27%
Non-severe disability 31% 48% 26%
Severe disability 65% 21% 15%
Source: Financial Lives Survey 2022
Ethnicity
118. There is significant variation in pension provision by different ethnic backgrounds. In
particular, people from a Bangladeshi or Pakistani background are significantly less likely to
have a pension compared to the rest of the population. This may be due to lower overall
employment rates for Bangladeshi and Pakistani ethnicities87
, lower eligibility for AE, as well
as being more likely to opt out of their pension (even if eligible)88
. People from a mixed
white/black background are also much less likely to have pension.
119. Of the different groups, people from an Irish, Chinese, or mixed Asian white
background are most likely to have a DB pension. People from other Asian background,
other white background and mixed Asian white background are most likely to have a DC
pension. As a result, the reforms are likely to have a lower impact on those from an ethnic
minority background.
Ethnicity No Pension DC DB
Black Caribbean, African or other Black
background
36% 45% 21%
White British 28% 49% 27%
Other White background 31% 52% 20%
Irish 34% 40% 31%
Mixed White Black background 55% 35% 11%
85
Using questions asked to respondents in the Financial Lives survey questionnaire, we classed people as being severely
disabled if they: Have a physical or mental health condition, or illness which has lasted or is expected to last for 12 month s or
more, and reduces ability to carry out day-to-day activities a lot.
Less severe disability: Have a physical or mental health condition, or illness which has lasted or is expected to last for 12
months or more, reduces ability to carry out day-to-day activities a little or not at all.
86
https://www.gov.uk/government/statistics/the-employment-of-disabled-people-2024/the-employment-of-disabled-people-
2024
87
https://www.ethnicity-facts-figures.service.gov.uk/work-pay-and-benefits/employment/employment/latest/#by-ethnicity-over-
time
88
https://ifs.org.uk/publications/ethnic-differences-private-pension-participation-after-automatic-
enrolment#:~:text=The%20ethnic%20gaps%20in%20pension,of%20Pakistani%20and%20Bangladeshi%20employees.
65.
65
Other Mixed background39% 43% 19%
Other ethnicity 56% 32% 20%
Indian 44% 38% 21%
Chinese 25% 46% 29%
Pakistani or Bangladeshi 63% 19% 18%
Other Asian Background 27% 57% 19%
Mixed White Asian background 26% 50% 29%
Source: Financial Lives Survey 2022
Marriage and civil partnership:
120. People who are married or in a civil partnership are more likely to have a DB or DC
pension than people who aren’t married or in a civil partnership. This is likely linked to age,
where older savers are more likely to be in a marriage or civil partnership89
.
Marriage Status No Pension DC DB
Not married or in civil
partnership
38% 44% 21%
Married or civil partnership 24% 51% 31%
Source: Financial Lives Survey 2022
Sexual orientation:
121. Financial Lives Survey data shows people who identify as heterosexual have very
similar pension provision as people who identify as gay or lesbian. However, people who
identify as bisexual are less likely to have a pension. This may be linked to age, as this
group are more likely to be in the 18-24 age group90
.
Sexual Orientation No Pension DC DB
Heterosexual 30% 48% 26%
Gay or lesbian 31% 50% 24%
Bisexual 49% 38% 15%
Source: Financial Lives Survey 2022
Gender reassignment:
122. Data and sample size is very limited, and was not covered in the Financial Lives
Survey 2022. Data was last collected in 2020. However, there is very limited data on pension
provision and people who consider themselves to be a transgender person. Based on this
latest data, people who identify as a transgender person were much less likely to have a
pension than people who don’t identify as a transgender person. However, it is important to
note AE has helped widen coverage pension coverage across the labour market, with nearly
89
Financial Lives Survey 2022 tables- volume 1 demographics. FCA (2023). Table 9.
https://view.officeapps.live.com/op/view.aspx?src=https%3A%2F%2Fwww.fca.org.uk%2Fpublication%2Ffinancial-
lives%2Ffinancial-lives-survey-2022-tables-volume-1-demographics.xlsx&wdOrigin=BROWSELINK
90
35% of people who thought of themselves as being bisexual are aged 18-24, compared to 20% who thought as themselves
as gay or lesbian, and 10% who identify as heterosexual. Financial Lives Survey 2020 tables- volume 1 demographics. FCA
(2020). Table 85.
https://view.officeapps.live.com/op/view.aspx?src=https%3A%2F%2Fwww.fca.org.uk%2Fpublication%2Fdata%2Ffinancial-
lives-survey-2020-tables-volume-1-demographics.xlsx&wdOrigin=BROWSELINK
66.
66
9-in-10 eligible employeessaving into a pension.
No Pension DC DB
Transgender 59% 27% 17%
Non-transgender 30% 48% 26%
Source: Financial Lives Survey 2020
Religion and belief:
123. People who are Muslim are much less likely to have a pension compared with all
other religious groups. This may be in part because of a lack of sharia compliant pensions
although these are increasingly offered by pension providers91,92
, and lower rates of
employment93
. On the other hand, people who are Christian, not religious or follow ‘any other
religion’ are most likely to have a DB pension. People who are Sikhs, not religious or
Christian are most likely to have a DC pension.
Religion No Pension DC DB
Christian 25% 47% 41%
Muslim 59% 24% 19%
Hindu 38% 34% 33%
Buddhist 40% 32% 38%
Sikh 33% 52% 28%
Jewish 40% 45% 20%
Any other religion 29% 45% 38%
No religion 27% 49% 37%
Source: Wealth and Assets Survey 2022
Summary of headline findings:
124. Overall, survey analysis has found protected characteristics which have an increased
chance of having no pension coverage include: younger workers, those with a severe
disability, women, bisexual and transexual people, and those of a Muslim religion. By being
less likely to have any type of pension coverage, this means some members of these groups
may not access the full benefits of the Pension Schemes Bill policy measures. However, this
is a reflection of employment and pension coverage, rather than the impacts of the Bill
measures themselves.
125. Groups more likely to have DC pension (and therefore more likely to benefit from the
DC measures in the Bill) include: men, workers between age 25-55, those of a white
ethnicity, and of Christian or Sikh religion.
91
For example, the Institute for Fiscal Studies show how lack of awareness and promotion of, and ease of switching to, Sharia
compliant workplace pension schemes explain lower levels of pension coverage among Muslims:
https://ifs.org.uk/publications/ethnic-differences-private-pension-participation-after-automatic-enrolment
92
For example, Nest and Aviva have each launched Sharia compliant funds either as part of, or aligned to, their current default
arrangements.
67.
67
126. Groups morelikely to have Defined Benefit pension membership (and therefore more
likely to benefit from the DB measures in the Bill) include: women, workers aged 45-54 and
those in a married or civil partnership.
127. Differences in levels, and types, of pension coverage largely relate to differences in
demographics, cultural norms and changing trends in pension types over type rather than
any wider equality issues arising from the policy designs specifically.
Policy analysis
128. Each of the Bill measures have also been considered individually to identify any
specific equality concerns that may arise.
Value for Money (VFM): A framework on metrics, standards and disclosures
129. Overall, the department does not consider that the proposals materially impact any of
the groups with protected characteristics under the Equality Act 2010 (in Northern Ireland,
the Equality Act is not enacted but other antidiscrimination legislation applies). However, this
will continue to be considered as final policy details emerge.
130. There is, however, a notable point on religion. The framework (at least initially) only
assesses default funds. This captures the vast majority of savers (over 90% of members
stay in the default fund). However, by only assessing default arrangements, this means that
some selected arrangements, such as those which are Sharia compliant94, may not
necessarily be assessed in the VFM framework. This means savers in Sharia compliant
funds which are not classified as a default fund will not be covered by the VFM framework.
This would therefore particularly impact those of a Muslim religion.
131. It is possible the VFM framework could be extended to non-defaults in the future,
though it is recognised that there are challenges, as individual saver needs and objectives
vary much more widely and products and arrangements are similarly varied. For any Sharia
compliant funds that are defaults and therefore in scope, when comparing VFM data metrics
to non-Sharia funds, schemes will be able to explain these wider factors that drive
differences in performance. Schemes with investment strategies consistent with religious
requirements can explain this in their assessment should this lead to differences in
performance compared to other arrangements.
132. Therefore, over the course of VFM policy development, the equality impact on
religion has been considered, with Sharia funds in particular warranting careful consideration
so as to best achieve the policy goals whilst protecting this characteristic and ensuring this
group can still reap the benefits of saving into a workplace pension aligned to their beliefs,
religion or faith.
94
Sharia compliant pension schemes are funds governed by the requirements of Sharia law and the principles of Islam. For
example, a Sharia compliant fund will not invest in any company that does not follow Sharia principles, such as companies in
the gambling, weapons and defence, and tobacco industries. This may lead to differences in investment return as these
companies are filtered out of Sharia portfolios.
68.
68
Guided retirement –decumulation options
133. Overall, the department does not consider that the proposals materially impact any of
the groups with protected characteristics under the Equality Act 2010 (in Northern Ireland,
the Equality Act is not enacted but other antidiscrimination legislation applies). However, this
will continue to be considered.
134. DC pension savers in general will benefit from this policy and any default retirement
product will still give savers the option not to participate in this and choose their own
preferred approach to retirement. Beyond the analysis above regarding groups which are
more likely to have a DC pension, it is not believed that there that are other equality issues
for consideration.
135. Decumulation defaults may have some interaction with gender, given that women on
average live slightly longer than men95
. This may mean schemes may need to account for
the additional longevity risks for women. However, any impacts along these lines would
ultimately be dependent on scheme behaviour and it is too early to properly assess the
possibility of this scenario.
136. In any case, the existence of decumulation defaults will improve outcomes for DC
savers compared to the counterfactual where these are not offered, and increase the choice
and availability of decumulation options across the market (meaning providers can be
switched if the offered default doesn’t suit the member).
Small pots
137. According to recent analysis from the Institute for Fiscal Studies – based on
longitudinal analysis of survey respondents using the Understanding Society dataset –
groups most likely to build up small pots over their working life were women, low earners,
and potentially younger employees96
. This means small pot policy may have some equality
impact consideration along sex and age dimensions.
138. AE-eligible private-sector employees aged 22–34 were twice as likely (22%) to have
joined their employer in the past year compared to those aged 50–65 (11%). Lower earners
and women are also more likely to have joined their employer recently than higher earners
and men, respectively. This suggests that women and younger employees could stand to
benefit most from an end to small pot proliferation. Analysis of the Wealth and Assets Survey
further supports these descriptive findings, showing that people aged 25-34 most commonly
have a small, deferred DC pot and that women are more likely to have a small pension pot
than men.
95
https://www.ons.gov.uk/peoplepopulationandcommunity/birthsdeathsandmarriages/lifeexpectancies/bulletins/pastandprojectedd
atafromtheperiodandcohortlifetables/2022baseduk1981to2072
shows that women born in 2023 could be expected to live 3.3 years longer on average than men born in the same year,
although this gap has narrowed over time.
96
https://ifs.org.uk/publications/small-pension-pots-problems-and-potential-policy-responses
69.
69
139. The Departmentrecognises that numbers of small pots do show variation between
protected characteristics; therefore, ending the proliferation of small pots may likely have
more effects on some groups than others. This suggests that women may benefit most from
the small pot legislation. The policy may also benefit younger AE eligible employees.
Importantly, the policy will however benefit any DC saver who has built up a small pot
through their AE contributions and chooses for this to be consolidated to their chosen or
allocated consolidator pot.
Superfunds
140. Overall, the Department does not consider that the proposals materially impact any
of the groups with protected characteristics under the Equality Act 2010 (in Northern Ireland,
the Equality Act is not enacted but other antidiscrimination legislation applies). However, this
will continue to be considered.
141. Private sector DB pension members in general will benefit from this policy. Beyond
the analysis above regarding groups which are more likely to have a DB pension (for
example, older workers as this is where DB pensions are more common – with 37% of 45-54
year olds having a DB pension compared to 21% of 25-34 year olds), it is not believed that
there that are other equality issues for consideration.
142. There may potentially be some groups of people who benefit more from the creation
of a DB superfunds vehicle, for example scheme members whose employer covenant is
weaker (such as low earners or groups disproportionately employed in sectors with weaker
DB schemes). However, there is not sufficient data to discern whether any protected
characteristics are disproportionately employed in specific sectors of the DB landscape or at
specific funding levels. Therefore, on balance, it is believed that all DB members should
benefit from this policy – with these benefits mostly accruing to the older members of the UK
workforce who are more likely to have a DB pension.
DB Surplus Extraction
143. Overall, the department does not consider that the proposals materially impact any of
the groups with protected characteristics under the Equality Act 2010 (in Northern Ireland,
the Equality Act is not enacted but other antidiscrimination legislation applies). However, this
will continue to be considered.
144. Members of private sector DB pension schemes that are eligible and able to access
surplus in general will benefit from this policy. Beyond the analysis above regarding groups
which are more likely to have a DB pension, it is not believed that there that are other
equality issues for consideration.
145. DB surplus extraction policy is being carefully designed so that it does not
discriminate by age (or inadvertently lead to cross-subsidies from deferred/pensioner to
active DB pension members). For example, current, older DB pensioners may see
decreased security in retirement if surplus extraction were set at too imprudent a level or
without appropriate guardrails. However, by applying and enforcing stringent guidelines and
funding requirements for surplus extraction – this equality risk has been mitigated. This
70.
70
prudency may benefityounger members further by reducing the risk of future scheme
underfunding.
146. If surplus extraction is used as direct reinvestment back into the employer’s
business, this could further benefit the specific groups highlighted above who are more likely
to have a DB pension. Equally, some employers have highlighted they will use the DB
surplus to support their DC schemes, meaning beneficiaries may be across all those with a
pension. However, this is unclear before the fact, and the impacts of surplus extraction will
depend on scheme behaviour, therefore the Department concludes that no specific equality
impacts have been identified at this stage.
DC Megafunds
147. Overall, the department does not consider that the proposals materially impact any of
the groups with protected characteristics under the Equality Act 2010 (in Northern Ireland,
the Equality Act is not enacted but other antidiscrimination legislation applies). However, this
will continue to be considered as final policy details emerge. The most direct link between
the policy proposal and protected characteristics is through religion – this is outlined further
below.
148. Religious providers are excluded from the legislation, ensuring employees with these
protected characteristics have suitable schemes for AE contributions. Religious funds that
are within provider arrangements would still be expected to benefit from the scale measures
in this policy; provided any consolidation activity protects the continued use of a religious
fund (such as Sharia97
or Brethren principles). The provider versus fund equality distinction
is summarised below.
149. Religious purpose providers: Providers set up wholly on religious (or protected
characteristic) grounds are exempt from the legislation. These providers may miss out on the
benefits of scale available to other schemes due to their smaller size. However, members
likely value their membership in these religious schemes over any potential scale benefits.
150. Religious funds within larger arrangements: Some larger pension providers, such as
Nest and Aviva, have specific Sharia funds within their overall arrangements. These
providers could use their overall arrangement-level scale (the level at which the policy
operates) to benefit these Sharia funds and fund members, allowing them to access the
scale benefits outlined in this Impact Assessment.
151. Evidence shows that Sharia compliant funds have achieved higher returns than many
default arrangements and are increasing in coverage. For example, Nest’s Sharia fund has
delivered 16.7% annualised returns over the last 5 years compared to the 7.1% annualised
returns delivered by Nest’s default target date fund98
. However, this has largely been driven
by a boom in US technology stocks and there may not be as much diversification across a
wider range of asset classes.
97
Sharia-compliant funds are governed by the requirements of Sharia law and the principles of Islam. For example, a Sharia
compliant fund will not invest in any company that does not follow Sharia principles, such as companies in the gambling,
weapons and defence, and tobacco industries.
98
https://www.nestpensions.org.uk/schemeweb/nest/investing-your-pension/fund-choices/compare-fund-performance.html
71.
71
152. Therefore, evidenceis mixed on how members belonging to religious funds or
religious providers might be impacted. For religious providers, these do not have to meet the
scale thresholds. Such protected characteristic providers tend to be small with specific
investment guidelines99
, meaning members may miss out on the scale benefits delivered
through the legislation. However, this ensures that these savers will continue to be able to
benefit from AE and workplace pension saving. For religious-focussed funds within in-scope
provider arrangements, these have been performing strongly for members and should stand
to benefit from their wider arrangement’s scale, albeit past performance does not guarantee
future returns.
153. Consultation responses, policy development and industry engagement has confirmed
that the proposed exemptions are a proportionate approach to balance protected
characteristics alongside the wider market reforms contained within this policy.
Annex: Individual Summary Impact Assessments
Value for Money Impact Assessment (from page 72)
Small Pots Impact Assessment (from page 126)
Guided Retirement Impact Assessment (from page 213)
DC Megafunds Impact Assessment (from page 265)
DB Superfunds Impact Assessment (from page 322)
DB Surplus Impact Assessment (from page 372)
99
For example, the Baptist Master Trust has around £75m assets under management meaning they would be significantly
below the proposed scale threshold of £25bn by 2030 and are also below the level at which many ‘scale economies’ are
reached as outlined in the ‘Achieving Scale in the Defined Contribution Market’ Impact Assessment
https://d3hgrlq6yacptf.cloudfront.net/5f169afae11ce/content/pages/documents/bps-trustee-report-and-accounts-2023.pdf
72.
Error! Unknown documentproperty name.
72
Title: Value for Money
IA No:
RPC Reference No: RPC-DWP-25032-IA(1)
Lead department or agency: DWP
Other departments or agencies:
ImpactAssessment(IA)
Date: May 2025
Stage: Final
Source of intervention: Domestic
Type of measure: Primary legislation
Contact for enquiries: Daniel.hatton@dwp.gov.uk
Summary: Intervention and Options RPCOpinion: Green(fitforpurpose)
Cost of Preferred (or more likely) Option (in 2024 prices100
)
Total Net Present Social
Value
Business Net Present
Value
Net cost to business per
year
Business Impact Target Status
Qualifying provision
£19,364m -£371m £43m
What is the problem under consideration? Why is government action or intervention necessary?
Automatic Enrolment (AE) has significantly increased workplace pension savers, with 88% of eligible employees (over 20m) participating
in a workplace pension. This has grown the Defined Contribution (DC) pension market significantly. However there are market
failures/challenges that justify intervention: a principal-agent problem where employers choose pension scheme based on cost, but
employees bear the risk of poor performance. This means the market competes on cost to employers, not value for members, risking a
race to the bottom. Information failures mean key performance indicators across schemes are non-existent or inconsistent, impacting
competition, comparability and member outcomes. The market is fragmented with around 900 smaller DC schemes potentially lacking
the scale to invest effectively.
What are the policy objectives of the action or intervention and the intended effects?
The Value For Money (VFM) framework aims for schemes to publish standardised performance metrics, enabling regulators to remove
poor-performing schemes from the market or require their improvement. By assessing investment, costs, and services holistically and
consistently, VFM policy aims to (i) reduce the number of savers in underperforming schemes; (ii) enhance transparency and
comparability of key performance indicators, allowing schemes to compete on overall value and not purely on cost; (iii) foster market
innovation and improvements through information transparency; and (iv) support UK growth by encouraging the consolidation of
smaller/poor value schemes into larger, better-performing ones that can invest effectively and productively.
What policy options have been considered, including any alternatives to regulation? Please justify preferred option (further
details in Evidence Base)
Policy option 0: Do nothing and let Financial Conduct Authority (FCA) use existing rule-making powers for the contract-based market
only. This would create inconsistencies with the DC Trust market.
Policy option 1 (preferred): Introduce primary legislation (Bill) to provide a holistic, consistent, cross-market approach for
implementing the VFM framework in full, with requisite expectations and powers delivered through legislation.
Policy option 2: Use existing powers/secondary legislation to address some elements of data disclosure, but this would fail to provide
the regulator with necessary new powers to regulate.
Policy option 3: Expand existing regulation by amending VFMa requirements to cover all DC Trust schemes. This would not have full
policy impact as it wouldn't cover the contract-based market nor grant sufficient new regulatory powers.
Policy option 4: Use statutory guidance in the absence of legislation. This would fail to have sufficient policy impact or provide TPR
with necessary powers to regulate effectively.
Will the policy be reviewed? It will be reviewed. If applicable, set review date: May 2030
Is this measure likely to impact on international trade and investment? No
Are any of these organisations in scope? Micro: No Small: Yes Medium: Yes Large: Yes
What is the CO2 equivalent change in greenhouse gas emissions?
(Million tonnes CO2 equivalent)
Traded:
N/A
Non-traded:
N/A
I have read the Impact Assessment and I am satisfied that, given the available evidence, it represents a
reasonable view of the likely costs, benefits and impact of the leading options.
Signed by the responsible Minister: Date:
100
The aggregated monetised impacts are calculated for a ten-year appraisal period and all costs are given in 2024 prices and use 2025 as the
base year for the present value calculation, as given in the RPC/DBT Impact Assessment Calculator. 2024 prices are sh own because this is
when the Department considered the policy evidence and 2025 is the present value base year as this is when the policy measures – and wider
Pension Schemes Bill – will be implemented or begin to impact the market
73.
Error! Unknown documentproperty name.
73
Summary: Analysis & Evidence Policy Option 1
Description: Pension Scheme Bill – Primary Legislation to introduce VFM framework
FULL ECONOMIC ASSESSMENT
Price Base Year
2024
PV Base
Year 2025
Time Period
Years 10
Net Benefit (Present Value (PV)) (£m)
Low: £6,014m High: £29,669m Best Estimate: £19,364m
COSTS (£m) Total Transition
(Constant Price)Years
Average Annual
(excl. Transition) (Constant
Price)
Total Cost
(Present Value)
Low £90m £29m £340m
High £151m £48m £567m
Best Estimate £138m 1 £38m £471m
Description and scale of key monetised costs by ‘main affected groups’
Pension Schemes (one-off, £138m): Familiarise with the requirements and implement relevant metrics, teams
and software. Pension Schemes (ongoing, £33m annual): Complete and report on the annual VFM assessment.
This involves storing and collecting data as well as comparing to other providers. Costs are estimated to fall over time
as fewer schemes remain in market. Cost estimates are direct from an FCA survey of providers with 25% optimism bias
is applied and responses are weighted by size to reflect the trust-based market.
Other key non-monetised costs by ‘main affected groups’
Members: May face indirect costs passed on from increased costs to schemes. However, this is unlikely given the
0.75% cap on charges. Instead, the expectation is additional costs will fall over time and as market competition on cost
remains strong. Regulators: May see additional costs of removing underperformers or closing schemes to new
members.
BENEFITS (£m) Total Transition
(Constant Price)
Years
Average Annual
(excl. Transition) (Constant
Price)
Total Benefit
(Present Value)
Low N/A
N/A
£865m £6,581m
High N/A N/A £3,943m £30,009m
Best Estimate N/A N/A £2,606m £19,835m
Description and scale of key monetised benefits by ‘main affected groups’
Members: See higher investment returns on their contributions. This could lead to £20bn of increased, ‘additional’
returns across the £600bn+ workplace DC market over the 10-year appraisal period, equivalent to £2bn annually.
These benefits are assumed to accrue directly to members (as principals, asset owners) and pass through schemes
(agents) who invest on their behalf. Schemes: As members are charged based on a percentage of pot value, higher
returns and larger DC pots will benefit schemes with an estimated £10m increase in charge revenue per year
compared to if performance did not increase.
Other key non-monetised benefits by ‘main affected groups’
Employers: Should find it easier to select, or switch, a good value pension scheme for their employees, as only good
schemes remain in the market. However the scale of this is unknown as are interactions with other Pension Schemes
Bill measures. Economy: A market of larger, better-performing pension schemes could benefit the UK macroeconomy
by increasing investment in productive domestic assets.
Key assumptions/sensitivities/risks
Dis
count rate (%)
3.5%
Analytical Assumption (Green, low impact): Costs are from a representative survey of the contract-based market; the IA
assumes trust and contract schemes will face similar costs (given many schemes operate in both markets and have similar
business models).
Analytical Risk (Amber): Schemes may overestimate costs to influence policy development. The IA has used sensitivity analysis
to account for this; and even in a higher cost/lower benefit scenario, large net policy benefits remain.
Analytical Risk/Assumption (Red, high impact): Investment performance benefits are monetised based on a range of evidence
(current and past UK market data and from Australia’s equivalent policy). This is the driving IA assumption. Small changes in
returns would significantly impact monetisation (due to compounding) and future returns are highly uncertain. Sensitivity shows
large policy benefits remain even in conservative return scenarios.
Policy Risk (Red): Schemes may ‘herd’ following VFM, where the framework’s increased focus on performance leads schemes
to invest safely in similar assets to avoid underperformance or being an outlier. This may stifle innovations/high performers.
BUSINESS ASSESSMENT (Option 1)
Direct impact on business (Equivalent Annual) £m: Score for Business Impact Target (qualifying provisions
only) £m:
Costs: £55m Benefits: £12m Net: £43m
74.
Error! Unknown documentproperty name.
74
Evidence base
Policy Background:
Automatic Enrolment has led to a large increase in workplace pension participation
1. Automatic Enrolment (AE) was first introduced in 2012 and has led to a huge increase in the
number of workplace pension savers, with 88% of eligible employees (over 20m)
participating in a workplace pension.. A DC pension is a pot of money for retirement which
depends upon factors including the amount the individual and employer pay in, the fund’s
investment performance and costs/charges.
2. The workplace pensions market is split into three markets:
a. Defined Benefit (DB) – This is a type of pension which pays a retirement income based
on earnings, accrual rate, and length of service rather than the amount of money an
individual has contributed to the pension. Of which, the market is further split into:
b. Public sector DB, where the main funded scheme is the Local Government
Pension Scheme in England and Wales (LGPS) which is made up of 86
Administering Authorities which operate 87 individual funds in 2023/24.
c. Private sector DB where there were around 5,000 pension schemes in 2024
d. Defined Contribution (DC) – This is a type of pension whereby pension contributions
are made by employees/employers and are invested to create a pension pot at
retirement. The DC market is further split into:
e. Trust-based market - A pension scheme governed by a board of trustees who have
a fiduciary duty towards scheme members. The board of trustees manage
investments on the members’ behalf. This is regulated by the Pensions Regulator
(TPR). In 2025, there were around 920 pension schemes with 12 or more members.
f. Contract-based market - A pension scheme governed by a provider and an
independent governance committee (IGC) where a contract exists between the
individual scheme member and the provider. This is regulated by the Financial
Conduct Authority (FCA). In 2023, there were estimated to be around 30 firms with
an authorised DC workplace pension business
g. Collective Defined Contribution (CDC) – these schemes are an emerging type of
pension scheme based on risk sharing between pension savers. CDCs aim to move the
risk away from the individual (as is the case under Defined Contribution schemes) and
away from the employer (as is the case under Defined Benefit schemes). The only CDC
arrangement in the UK so far is a scheme by the Royal Mail.
3. The vast majority of AE-eligible employees are saving into a Defined Contribution (DC)
workplace pension101
and this market is the focus of this Impact Assessment given this is
where the policy applies. After the Impact Assessments were completed, more recent
information on the DC landscape became available. The contextual and background
information within the IA has been updated to reflect the latest information. However, it is
important to note the calculations are using the previous years’ worth of data. The changes
in the landscape are in line with expectations and therefore it would not materially change
the cost or benefits of the policies.
101
https://www.gov.uk/government/collections/workplace-pension-participation-and-savings-trends
75.
Error! Unknown documentproperty name.
75
4. Overall, it is estimated there are around £300bn and 5m active savers in the contract-based
DC market102
, and £200bn and 11m active savers in the DC trust-based market103
. Data is
more readily available on trust side, which has a much greater number of schemes104
.
5. The DC-trust landscape is growing in scale and maturing quickly with 30.6 million DC
memberships105
in 2025, an increase of 6% since 2024. DC trust workplace pension assets
have grown to £205 billion, increasing from only £22 billion in 2012106
.
6. There are three main types of pension schemes in the DC market:
• Master Trusts – an occupational pension scheme that provides DC pensions for two or
more unconnected employers (though often a lot more).
• Single Employer Trusts (SETs) – pension schemes which are managed for and on
behalf of a single employer.
• Group Personal Pensions (GPPs) – DC contract-based schemes which are regulated
by the FCA.
Type Number Assets Active Members
Master Trust 30 £166bn 10m
Single Employer Trust 890 £39bn 1m
GPP 30 £300bn 5m
7. The DC market has been consolidating, with the number of pension schemes reducing from
around 3,700 in 2012 to around 950 schemes now. Close to 900 of these schemes are
single-employer trusts, traditionally set-up by employers to support their workforce. However,
as AE resulted in all employers needing to enrol their employees (where eligible) into a
workplace pension, there has been a rise in Master Trusts (multi-employer pension
schemes). Across around 30 schemes, these now account for over 91% of total - and 90%
of active memberships - and 80% of assets in the DC trust market. In addition, there are
around 30 GPPs, which operate in the DC contract market. Across those two markets, there
are now 7 DC schemes managing over £25bn worth of bundled assets, where economies of
scale are most apparent enabling schemes to access a wider range of asset classes,
negotiate lower fees and improve their governance107
.
8. AE has led to more people saving into a pension. However, inertia is strong and
engagement is low. For example, 47% have not reviewed how much their pension is worth in
last 12 months108
and over 94% of pension savers are invested in a pension scheme’s
default investment strategy109
. This highlights the importance of government intervention,
where appropriate, to deliver outcomes for members who may not otherwise engage with
their pension.
Regulation and types of DC pensions
102
https://www.fca.org.uk/publication/consultation/cp24-16.pdf
103
https://www.thepensionsregulator.gov.uk/en/document-library/research-and-analysis/occupational-defined-contribution-
landscape-2024
104
https://www.gov.uk/government/publications/trends-in-the-defined-contribution-trust-based-pensions-market/trends-in-the-
defined-contribution-trust-based-pensions-market
105
‘Memberships’ is used throughout this IA. This more closely represents the number of DC pots - the number of
members/savers is not knowable given an individual may have multiple pots with different providers.
106
https://www.thepensionsregulator.gov.uk/en/document-library/research-and-analysis/occupational-defined-contribution-
landscape-2024
107
Corporate Adviser 2024 MT GPP Default Report (https://corporate-adviser.com/research/)
108
https://www.fca.org.uk/publication/financial-lives/fls-2022-pensions.pdf
109
https://www.thepensionsregulator.gov.uk/en/document-library/research-and-analysis/occupational-defined-contribution-
landscape-2024
76.
Error! Unknown documentproperty name.
76
9. DC pension schemes are either personal or stakeholder pensions. They can be workplace
pensions arranged by an employer or private pensions arranged by an individual; the
legislation focuses on workplace pension schemes. Regulation of the pensions industry in
the UK is split between the FCA and TPR:
c) Financial Conduct Authority (FCA) regulates personal pensions, including workplace
personal pensions (contract-based pension schemes).
d) The Pension Regulator (TPR) regulates occupational pensions (trust-based pension
schemes).
The VFM framework will cover all non-micro (schemes with 12 or more members) DC
pension schemes when fully enforced (see Paragraph 68-74 for full outline of the policy
scope). Operation and enforcement of these new requirements will therefore be split
between the two regulators.
The Value for Money (VFM) framework has engaged with industry throughout its
development
10. The previous government announced on 4 July 2022 that DWP, the FCA and TPR would
work together to develop a VFM framework and regulatory regime for DC pension
schemes. This framework builds on preliminary work by TPR and FCA110
.
11. A joint policy consultation ‘Value for Money: A Framework on metrics, standards and
disclosures’ was launched on 30 January 2023 and closed on 27 March 2023111
. This sought
views on policy proposals to require trustees and managers of relevant DC occupational
pension schemes and the providers and Independent Governance Committees (IGCs) of
workplace personal pensions schemes to disclose data, assess and compare the value for
money that their workplace pension schemes provide.
12. There was broad support for the goals of the policy across all stakeholder responses,
although there were mixed views over the detail of the proposals. The government-
regulators response, including next steps and policy direction was published on 11th
July
2023, responding to industry feedback112
.
13. The FCA published a Consultation Paper on 8th
August 2024113
setting out the updated
policy position of the proposed VFM framework. This closed on 17th
October 2024 and built
on the joint response published in July 2023; FCA are analysing consultation responses
closely with TPR and DWP to inform further joint framework developments. It also built on
the subsequent industry engagement held since through a series of industry working groups.
In this engagement, DC stakeholders (asset managers and trustees) provided technical
insights and feedback to our policy proposals to ensure they aligned with industry best
practice whilst minimising burden. TPR, FCA and DWP have continued to work jointly as a
tripartite to develop the policy further based on this industry feedback. This consultation
paper sought views on detailed policy proposals across the four pillars of VFM (investments,
costs, services, assessments) as well as views on asset allocation disclosure, and how
these would work in practice.
The current workings of the DC market shows the need for VFM
14. The DC market prioritises competition on costs rather than on the overall provision of
value. This is a particular risk for pensions as investment returns are a much greater driver
of the final pension pot compared to costs/charges (investment returns can account for
around 60% of the overall pot – see figure 1). Industry feedback has suggested among
110
https://webarchive.nationalarchives.gov.uk/ukgwa/20230703102958/https://www.thepensionsregulator.gov.uk/en/document-
library/consultations/value-for-money-discussion-paper/driving-value-for-money-in-defined-contribution-pensions
111
https://www.gov.uk/government/consultations/value-for-money-a-framework-on-metrics-standards-and-disclosures/value-
for-money-a-framework-on-metrics-standards-and-disclosures
112
https://assets.publishing.service.gov.uk/media/64c25790331a650014934cc5/value-for-money-a-framework-on-metrics-
standards-and-disclosures.pdf
113
https://www.fca.org.uk/publications/consultation-papers/cp24-16-value-for-money-framework
77.
Error! Unknown documentproperty name.
77
Master Trusts that contracts have been won and lost over a few basis point cost
differentials114
.
Figure 1: Illustrative case study of a median male earner’s pension pot at retirement
made-up of different components (assuming saves at AE minimum levels over a full
career history)
15. Engagement with stakeholders and responses to DWP’s 2020 Pension Charges Survey
shows considerations of cost can dominate decision-making in many pension schemes,
often being at the forefront of employers’ minds when enrolling their employees115
. This is
significant given the principal-agent problem in workplace pensions:
o Employers choose the pension scheme on their workers’ behalf – DWP employer
surveys show a large percentage of employers prioritise ease and convenience for
themselves (64%) or on low costs (49%) to them116
. Though it is important to note, 49%
of employers offering DC provision considered member value and some employers do
look at a wider range of factors beyond cost.
o However, the pension is for the benefit of the worker, where investment returns play a
greater role on outcomes over costs.
o Although a worker can ask to switch pension scheme, they may not have the
information to make the decision and the employer does not have to contribute to an
employee’s pension if they choose to switch scheme.
o As a result, employees may end up in underperforming schemes and be unaware or
unable to easily change (employers do not have to pay contributions into another
provider an individual selects).
16. By shifting the focus from cost towards a holistic focus on value, the VFM framework will
protect savers from becoming stuck in underperforming arrangements for extended periods.
A robust regulatory regime aims to ensure appropriate oversight and enforcement to deliver
this.
17. The framework also aims to shift the focus from costs to value by requiring consideration of
other factors, alongside costs, critical to longer-term saver outcomes such as investment
114
https://corporate-adviser.com/wp-content/uploads/2022/06/CA-Supplement-Master-Trust-GPP-House-of-Lords-Round-
Table-2022.pdf
115
https://www.gov.uk/government/publications/pension-charges-survey-2020-charges-in-defined-contribution-pension-
schemes/pension-charges-survey-2020-charges-in-defined-contribution-pension-schemes
116
https://assets.publishing.service.gov.uk/media/6501971439d9f1000d3d3a37/dwp-employer-survey-2022-report.pdf
£29,620
£7,405
£22,215
£105,260
-£15,095
Individual Tax Relief Employer Investment Charges
£0
£20,000
£40,000
£60,000
£80,000
£100,000
£120,000
£140,000
£160,000
£180,000
78.
Error! Unknown documentproperty name.
78
performance. The Pension Charges Survey found the DC market is already operating
significantly below the 0.75% charge cap (the maximum schemes can charge members),
with an average charge of 0.5% (of assets under management). This has continued to fall
over time and is lower among larger Master Trusts (around 0.4%). Too great a focus on cost
risks a race to the bottom and can preclude investment in a broader range of asset classes
(including listed and unlisted assets) that may offer diversification benefits and potentially
improved risk-adjusted returns but are often more expensive to invest in (for example, they
may require more active management).
18. The overall VFM framework proposals aim to deliver the best possible value and long-term
retirement outcomes for DC pensions savers by helping schemes shift their focus from cost
to a more holistic assessment of value for money. This assesses 3 broad areas in a step-by-
step assessment process.
• Investment performance - The VFM framework will provide a range of
comparable data metrics which would help schemes effectively compare their
performance against the market. This will be achieved by requiring schemes to
disclose their historic investment returns to demonstrate the outcomes of their
investment strategy. The actual experience of members, measured by backward-
looking investment performance, is critical to assessing the overall VFM a scheme
provides and has a much greater impact on final pot value than charges, as
illustrated in Figure 1. However, it is recognised that past performance may not
necessarily result in future performance.
• Services – Alongside costs and investment performance, the overall value of a
scheme is dependent on how well it provides information and support to its
members – its ‘quality of service’. DWP, TPR and FCA have worked with industry
to develop quantifiable metrics around complaints data which, along with the other
service metrics, will show the relative strength of schemes’ quality of service.
• Costs and Charges - Standardised disclosure of costs and charges is essential to
scheme comparability; and, understanding what is provided by a scheme for the
price paid is a vital tool to drive competition and engagement. Costs and charges
would be disclosed as an annual percentage charge to enable market-wide
comparison and show how investment and service costs differ to increase focus on
how different elements of cost impact on saver outcomes.
19. Schemes will be required to publicly disclose metrics across these three components of
value and use these disclosures to inform a holistic assessment of VFM with each ‘pillar’
(investment, services, costs) having equal weight. Net investment performance will be the
first pillar considered at the VFM assessment process – given its importance in determining
the size of member pots at retirement and its quantifiable nature, the investment
performance figure is where the Impact Assessment focuses on (See ‘Benefits for Members’
section).
20. The VFM assessment approach will require schemes to follow a step-by-step process,
which will include comparing their performance metrics against those of at least three other
schemes. When conducting an assessment, at least two of these comparisons will be
required to be against schemes of ‘scale’. The two ‘at scale’ schemes must manage assets
in excess of £10 billion which is envisaged to increase over time as the DC market grows.
This means schemes below this threshold can evaluate whether they can access the same
scale benefits that these larger schemes have access to (such as improved governance and
greater ability to invest in a wider range of asset classes117
), and if they can’t, whether their
wider VFM offer compensates for this. At future stages of the VFM assessment process,
regulator-defined benchmarks may be set/used to assess performance levels in place of the
step-by-step comparison against a selection of chosen schemes.
117
https://www.imcoinvest.com/pdf/research/CEM-Benchmarking-Report_A-Case-For-Scale-February-2022.pdf ;
https://papers.ssrn.com/sol3/papers.cfm?abstract_id=4406642
79.
Error! Unknown documentproperty name.
79
21. Following these comparisons, the assessment will be RAG (Red, Amber, Green) rated on
the overall VFM offer. This represents the proposed VFM assessment process as detailed in
the FCA’s August 2024 consultation paper102
. Detail on the proposed RAG assessment and
categorisation may subsequently change or update following consultation feedback.
• A Green-rated scheme compares favourably against its chosen comparators and is
deemed as providing value for its members.
• An Amber-rated scheme is not currently delivering value for its members but has
achievable and identifiable plans to do so in the near future by implementing either, or
both, an improvement plan or an action plan.
• A Red-rated scheme is not providing value for its members and has no credible plans to
do so.
Regulators will monitor plans to ensure their credibility and progress. VFM results will also
be communicated to employers, increasing transparency and may lead to employers
reconsidering their pension scheme if they are part of an underperforming scheme or
consolidating their own single-employer trust into a Master Trust.
22. Underperforming schemes will be required to take action to improve the value they provide
to savers. Or, they will have to consolidate (merging/transferring their scheme to another
scheme) where this is in savers’ best interest. The VFM framework will give regulators the
necessary powers to enable the identification and removal of persistently poor performing
schemes from the market.
• This could include new powers to enforce wind-up and consolidation of schemes that are
identified as consistently underperforming and unable to improve their VFM result.
• The Government intends to consider legislative changes to enable contract-based
providers to transfer savers in underperforming arrangements to better-performing
arrangements without having to obtain the individual consent, with appropriate protections
of all affected savers, for the purpose of the VFM framework and the wider Pension
Schemes Bill. The FCA may also need new powers to regulate this action where
necessary. The government is currently consulting on these proposals as part of the
consultation for the Pensions Investment Review issued on 15 November 2024118
.
Wider economic benefits
23. Driving a long-term focus on VFM across the DC market could encourage schemes to
invest more in productive assets, such as private infrastructure, where it is in the member’s
interest to do so. These assets tend to have higher costs but have the potential for higher
risk-adjusted returns for savers through diversification benefits. Analysis from Government
Actuary’s Department showed that increasing allocations to private markets could be
expected to translate into a 2% (net) larger pension pot at retirement for a median earner
after 30 years of saving compared to a traditional, lower cost portfolio made up of listed
equities and bonds119
.
24. Further investment in productive asset classes can also benefit economic growth, a key
Government priority, by deepening capital markets and helping early-stage companies
receive UK-based risk capital120
. The policy objective of fewer, larger, and better-performing
schemes could further accelerate investments into these asset classes as larger schemes
are better able to access these diverse opportunities through negotiation power, in-house
expertise and good governance structures.
VFM will replace the Value for Members assessment which currently covers small DC
schemes
118
https://www.gov.uk/government/consultations/pensions-investment-review-unlocking-the-uk-pensions-market-for-
growth/pensions-investment-review-unlocking-the-uk-pensions-market-for-growth
119
See Table 5: https://assets.publishing.service.gov.uk/media/673f3ca459aab43310b95a8d/pension-fund-investment-uk-
economy.pdf
120
https://assets.publishing.service.gov.uk/media/673f3ca459aab43310b95a8d/pension-fund-investment-uk-economy.pdf
80.
Error! Unknown documentproperty name.
80
25. Smaller trust-based schemes with assets under management (AUM) of under £100m are
already in scope of a current “value for members” regulation (VFMa) which came into force
in October 2021. DWP, TPR and FCA have aimed to increase this scope to all non-micro
trust-based and contract-based DC schemes121
and learn the lessons from this policy to
improve compliance and effectiveness:
• Findings from a TPR regulatory initiative pilot to monitor compliance with the VFMa
requirements found some early signs that these were helping to drive consolidation, with
16% of schemes, having concluded their schemes do not offer good value, have opted to
be wound up122
. However, some issues remained with the framework’s operation and
scope:
• TPR’s 2022 DC survey found that only around a third of schemes with assets under £100
million were aware they are now required to carry out more detailed VFM assessments.
The survey also revealed only 24% of DC schemes met the key governance requirement
on assessing value for money set out in the Occupational Pension Schemes (Scheme
Administration) Regulations 1996123
. 84% of smaller schemes did not meet the key
governance requirement compared with just 22% of Master Trusts.
• DWP, FCA and TPR are developing the VFM framework across the whole DC market
using the lessons learnt from the VFMa rollout among smaller schemes. There will be a
strengthened role of the regulator toward non-complying schemes – a URL hosting will
clearly identify those who do not submit their VFM assessment/data. Schemes will also
be subject to penalty, business closure, and an immediate ‘RED’ VFM rating in the event
of non-compliance.
Rationale for intervention and intended effects
The overall aim of the VFM framework is to drive improvements in the value DC pension
schemes provide to savers to ensure they receive better retirement outcomes. Many industry
participants (including pension providers, employee benefit consultants and trade bodies)
have welcomed the desire and intent of legislating for a VFM framework124
. There are a
number of market failures and key issues that this framework aims to address:
Market failure: Principal-agent problem
26. A principal-agent problem in the DC market whereby the controllers of DC assets may
be incentivised to prioritise low costs at the expense of higher returns, which may not be in
the best interests of owners of the assets:
• The principal-agent problem may exist in the market whereby investment managers
disregard better/more diverse investment opportunities due to higher costs. Employers
who enrol their employees into a pension scheme choose the scheme into which their
employees are enrolled, however employers do not gain from the investment growth of
contributions.
• This risks a principal-agent problem as employees would like to maximise investment
gains whereas employers might prefer a scheme with lower advertised costs and / or
which is convenient to set up. Employees themselves are often not incentivised to
switch the scheme chosen by their employer due to low engagement and information;
121
Non-micro defined as 12+ members.
122
https://www.thepensionsregulator.gov.uk/en/media-hub/press-releases/2024-press-releases/poor-value-schemes-are-
wound-up-as-tpr-takes-tough-action
123
https://www.thepensionsregulator.gov.uk/en/media-hub/press-releases/2023-press-releases/too-many-small-dc-schemes-
failing-to-meet-expectations-on-value This key governance requirement refers to the legal requirement for trustee boards to
assess the extent to which member-borne charges and transaction costs provide good VFM.
(https://www.legislation.gov.uk/uksi/1996/1715/regulation/25)
124
https://assets.publishing.service.gov.uk/media/64c25790331a650014934cc5/value-for-money-a-framework-on-metrics-
standards-and-disclosures.pdf
81.
Error! Unknown documentproperty name.
81
they may also risk losing employer contributions if they do so (as the employer does not
have to contribute to a pension they have not enrolled their employee into).
• This means the DC market is fiercely competitive on cost (cost marketed to employers)
rather than value delivered to members, with reports of lucrative contracts won and lost
over a few basis points of cost differentials. This risks a race to the bottom on costs,
distorting and limiting investment capabilities which is detrimental to member outcomes
(the ultimate asset owner). As Figure 1 shows, around 60% of a DC pot is accounted for
by investment returns. This means the current workings of the market, focused on low
cost, stifle the ability for net investment returns to be maximised for members (as assets
which may cost more but deliver improved net returns are ignored as this would
increase the cost offered to employers).
• Employers are also unlikely to switch or change schemes. Evidence from the DWP
employer survey showed only 5% of employers with a DC pension scheme had
switched to a different scheme and employers’ main focus when selecting scheme was
on convenience of enrolment and cost, not on overall VFM. Additionally, only 2% of
people with a non-workplace pension switched pension schemes in the last 12 months
highlighting the strong inertia in place once a scheme is selected.
• The proposed VFM framework aims to mitigate the current principal-agent problem by
increasing transparency of available information and removing underperformers from
the market (so employees cannot be stuck, indefinitely, in underperforming schemes). It
would also be beneficial for those high-performing pension schemes offering best value
as more business would flow to them allowing them to gain market share and grow
revenues.
Market failure: Information failures
27. The inconsistent approach and imperfect information to assessing value in the DC
market means savers/employers are not able to compare which scheme is the best for
them and their needs. The absence of a consistent framework and standardised,
accessible data means there are a wide variety of definitions, methodologies and metrics
used to determine value. This data is hosted on thousands of different scheme websites and
some schemes do not publish this data at all. This makes it difficult for both employees and
employers to objectively compare the VFM provided by schemes and means some schemes
may have lower standards or different definitions in assessing value. The proposed VFM
framework aims to address these issues to promote consistent, accessible comparisons of
value and drive competition on this basis. Transparency, standardised price and value
comparison, and competitive pressures have improved outcomes in other markets, such as
energy markets, that it is hoped to be emulated in the DC market through the VFM
framework125
.
Key issue: Wide range in performance risks significant difference in pension
outcomes
28. The significant and persistent range in performance between different schemes
leads to large differences in member outcomes. Annualised 5-year returns for younger
savers range from 5.1%, to 12.9% across a sample of large pension schemes (see Figure
2). This means for a pot of £10,000, assuming no further contributions and annual charge of
0.5%, the pot size would differ by more than £5,000 depending on the scheme after 5 years
of saving126
(see Figure 3).
125
https://publications.parliament.uk/pa/cm201415/cmselect/cmenergy/899/899.pdf / Protecting consumers: Making energy
price comparison websites transparent
126
https://capa-data.com/younger-saver-30-years-to-retirement-5-year-annualised-line/
82.
Error! Unknown documentproperty name.
82
Figure 2: 5-year annualised investment returns for younger savers vary among the
large DC schemes across the trust-based and contract-based market
Figure 3: The range in returns across the DC market means a £10,000 investment
would be worth over £5,000 less in the worst-performing scheme after 5 years
compared to being in the best-performing scheme
29. The VFM framework intends to narrow and improve the range in investment
performance by removing schemes that consistently fail to provide value from the
market. It is also envisaged there will be further improvements as schemes learn from each
other and increasingly adopt best practice. Based on the latest data from the largest DC
schemes, there are nearly 6m pots at risk of significantly poor returns, with an
investment return at least 2ppts below the market average127
. This could lead to savers
with the same contribution levels entering retirement with significantly different incomes in
retirement due to saving, and remaining, in a poorly performing scheme. This is a particular
risk given how rare the ‘switching’ of pension schemes’ is, meaning employees often remain
in poor value schemes, often without sufficient information they are in such a scheme.
127
https://corporate-adviser.com/research/ ; Corporate Adviser 2024 Annual MT and GPP Default Report
0%
2%
4%
6%
8%
10%
12%
14%
Master Trust/GPPProvider
Lowest: 5.1%
Highest: 12.9%
Average: 8.7%
Annualised investment
return (younger saver)
£0
£5,000
£10,000
£15,000
£20,000
Year 0 Year 1 Year 2 Year 3 Year 4 Year 5
Nominal pot value
Top performer (£18k)
Bottom performer (£12.5k)
Average (£15k)
83.
Error! Unknown documentproperty name.
83
Key issue: The fragmented DC market is not meeting current requirements and may
not be delivering value for their members
30. Large numbers of Trust-based DC schemes are not meeting current requirements
and many have low governance standards:
• As per Paragraph 25, the VFM framework will replace the Value for Members
assessment (VFMa) where many small schemes are not meeting existing requirements
and just 16% were meeting key governance requirements of ensuring member-borne
costs and charges represented value for money128
.
• Links to schemes’ VFM assessments and VFM data will be hosted on regulator
websites making it easy to identify non-compliance and schemes will not want to be
publicly singled out as not complying. Those not complying with the new requirements
may be subject to a regulator penalty in line with the number of savers they have and be
immediately rated as not providing value in their assessment. The figure below presents
the causal chain underpinning the VFM framework129
.
Figure 4: Requirements and potential outcomes of the VFM framework
31. Figure 4 shows the targeted actions the VFM framework proposes across the DC market
taken from the August 2024 FCA consultation paper129
– for example by requiring key
disclosures of value and requiring schemes to publish the outcome of their assessment
under a Red-Amber-Green (RAG) rating (which will evolve over time). In addition, the
framework also seeks to drive behavioural change in the DC market. The main behavioural
change among schemes is expected to be an increased focus on value rather than a focus
on low cost. As DC products will be better regulated to provide VFM, more employees will be
saving into a value-offering scheme as poor-performing schemes improve or exit the market.
This should reduce the principal-agent problem (where the employer selects the scheme on
behalf of the employee) as only good VFM schemes will remain in the market, and
128
https://www.thepensionsregulator.gov.uk/en/media-hub/press-releases/2024-press-releases/poor-value-schemes-are-
wound-up-as-tpr-takes-tough-action
129
https://www.fca.org.uk/publication/consultation/cp24-16.pdf
84.
Error! Unknown documentproperty name.
84
employers can use VFM scores to switch to better arrangements or negotiate better terms
for their members.
32. Where the existing Value for Members statutory guidance asks schemes to consider
winding up and consolidating their members into better performing schemes, the proposed
VFM framework intends to place a statutory requirement on trust-based schemes to wind up
and consolidate if they consistently fail to improve the value they provide for members.
Evidence from Australia
33. This section outlines evidence from the Australian superannuation system. Australia’s DC
market is approximately 20 years ahead of the UK – introducing its equivalent of Automatic
Enrolment in 1992 and now holds $A3.5tn (£1.8tn) in assets130
- and is often used as a
comparator for the UK given some similarities.
34. Australia introduced an annual ‘Performance Test’ in 2021 across its Superannuation
(workplace pension) system. This is operationally similar to the proposed Value for Money
framework and shares many of the same objectives in improving the value received by
savers. However, the policy places a greater emphasis on net investment returns with
scheme performance compared against a benchmark designed by the regulator.
35. After the first few years of the policy, key findings are emerging from the system which we
are using to inform VFM policy development. Emerging evidence, presented in Figure 5,
finds an overall improvement in the value offered. After implementation in 2021, average
investment returns by 2023 were 0.4ppts higher than they were at the start of the policy
initiative (defined as distance above benchmark)131
. This is likely as a result of the removal
and/or merging of poor performing schemes (for example, in 2021 75 products were tested
and this had fallen to 58 by 2023 as underperforming products had exited the industry;
though other factors may be contributors too).
Figure 5: Since the annual performance test was introduced in 2021, Australian
schemes have increased their margin of benchmark outperformance from 0.03ppts to
0.41ppts over a three-year period
36. The UK DC market already performs just as well, on average, as the Australian
Superannuation DC sector with both markets earning around 6% annualised returns for
younger savers. However, UK performance is much more dispersed; good UK schemes do
better than good Australian schemes but poor performing UK funds do worse than poor
performing Australian funds12
. This carries a high risk of UK members seeing significantly
poor returns over long periods.
130
https://assets.kpmg.com/content/dam/kpmg/au/pdf/2024/super-insights-2024-report.pdf
131
https://www.apra.gov.au/insights-paper-2023-performance-test
0
0.1
0.2
0.3
0.4
0.5
2021 2022 2023
Average ppt
outperformance
85.
Error! Unknown documentproperty name.
85
Figure 6: The range in investment performance for savers in the growth phase is
around twice as large in the UK than it is in Australia despite similar average
performance levels
37. The proposed VFM framework intends to learn from Australia in narrowing the performance
gap. This minimises the risk of significant underperformance by improving the value offered
by DC schemes, especially at the bottom of the market. For example, the gap in Australia
between the highest and lowest performing scheme is twice as narrow as it is in the UK.
38.However, there are also lessons learnt from the Australian system designed to mitigate the
downsides in the UK. Herding around investment benchmarks (where schemes invest in the
index they are assessed against, meaning all invest in a similar way) has been a recognised
risk and the Australian regulators are currently exploring options to respond to this. This is
helping to inform the UK’s VFM assessment framework to ensure performance at the low
end of the market is driven up without disincentivising innovation among existing high
performing schemes.
39.The Performance Test in Australia has also resulted in fewer, larger, and better-performing
schemes. For example, there are several examples of poor-performing, small-scale
schemes failing the Test and then merging with better-performing, larger schemes. On
average, affected members moved to schemes whose returns were over 1 percentage point
larger – this gives confidence to our return improvement assumption outlined in the Benefits
section. A selection of these examples is provided in Table 1 below. DWP will continue to
observe the Australian model as the VFM framework is developed and have met with
Australian counterparts to discuss elements of VFM/Performance Test policy in greater
detail.
10.6%
7.8%
2.8%
4.0%
5.8% 5.7%
0%
2%
4%
6%
8%
10%
12%
UK Australia
Median
Lowest
Highest
86.
Error! Unknown documentproperty name.
86
Table 1 – Data on the 12 funds who merged into another Super after failing the Annual Performance Test132
(*Using APRA 10-year average investment returns (%))
23
https://view.officeapps.live.com/op/view.aspx?src=https%3A%2F%2Fwww.apra.gov.au%2Fsites%2Fdefault%2Ffiles%2F2023-12%2FAnnual%2520fund-
level%2520superannuation%2520statistics%2520back%2520series%2520June%25202004%2520to%2520June%25202023.xlsx&wdOrigin=BROWSELINK
Fund Name Years
failed
Action Returns Assets (Aus$) Members
Pre-
merge
Post-
merge
Pre-
merge
Post-
merge
Pre-
merge
Post-
merge
Retirement Wrap - BT Super MySuper 2 years Merged with Mercer Super in April 2023 5.9% 6.5% 17.2bn 420bn 540,000 843,000
Retirement Wrap - Westpac Group Plan
MySuper
2 years Merged with Mercer Super in 2023 n/a 6.5% 3.2bn 66bn 782,000 843,000
Labour Union Co-Operative Retirement Fund -
MySuper Balanced
1 year Merged with Australian Super n/a 8.0% 7.4bn 317bn 133,000 2.4m
Commonwealth Bank Group Super -
Accumulate Plus Balanced
1 year Phased merger with Australian
Retirement Trust began in late 2023
6.0% 6.6% 12.3bn 280bn 65,000 2.3m
AvSuper Fund - AvSuper Growth (MySuper) 1 year Merged with Australian Retirement
Trust in 2023
5.9% 6.6% 2.43bn 280bn 5,600 2.3m
The Victorian Independent Schools
Superannuation Fund - VISSF Balanced
Option (MySuper Product)
2 years Merged with Aware Super end of 2021 7.3% 8.0% 0.9bn 154bn 200,000 1.1m
ASGARD Independence Plan Division Two -
ASGARD Employee MySuper
1 year Merged with BT super in 2021 5.2% n/a 67bn 131bn 160,000 n/a
Australian Catholic Superannuation and
Retirement Fund - LifetimeOne
2 years Merged with UniSuper at the end of
2022
6.7% 8.7% 10bn 105bn 85,000 526,000
Maritime Super - MySuper Investment Option 1 year Merged with Hostplus 7.2% 9.1% 6bn 100bn 23,000 1.6m
Energy Industries Superannuation Scheme-
Pool A - Balanced (MySuper)
2 years Transferred members from EISS to
Cbus Q2 2023
5.5% 7.6% 5.3bn 70bn 17,000 875,000
BOC Gases Superannuation Fund - BOC
MySuper
1 year Merged with Equipsuper in 2021 n/a 7.7% 0.7bn 30bn 3,000 148,000
Christian Super - My Ethical Super 1 year
(later
passed)
Transferred funds to Australian Ethical
in November 2022
7.0% 7.8% 2.1bn 9bn 30,000 72,000
87.
Error! Unknown documentproperty name.
87
Justification for the level of analysis used in the IA (proportionality
approach)
40. The VFM framework is a large policy initiative, affecting hundreds of billions of market
assets and tens of millions of savers. Costs and benefits are therefore expected to be
large. DWP have therefore, alongside TPR and FCA, engaged in multiple consultation
documents as the policy detail has been developed and continued to engage closely with
industry at various stages of the policy development process133,134
and received 100s of
consultation responses. Steps taken include:
• Following a joint FCA / TPR September 2021 Discussion Paper, ‘Driving Value for Money
in defined contribution pensions, the DWP, TPR and FCA carried out a consultation on
the proposed Value for Money framework in January 2023. This consultation asked for
feedback on how the policy should develop across the trust and contract-based market to
reflect industry best practice and meet the aims of the framework whilst minimising
industry burden. Responses were broadly supportive of the policy objectives and DWP,
FCA and TPR released the Joint Response to this consultation in July 2023.
• Following the Joint Response, DWP, TPR and FCA have continued to work as a tripartite
and undertaken a series of industry engagements involving four industry working groups
to further develop the proposals. This engagement sought to flesh out the detail on
specific policy proposals in line with industry best practice and minimise the burden to
firms.
41. The FCA have since written their own Consultation Paper on the detailed rules and
guidance following these recent policy developments and engagement with industry134
.
This was published on 8 August 2024 and asked for further feedback on the design of the
framework and the extent to which it is burdensome to firms against its proposed benefits.
Industry engagement was carried out prior to the consultation closing on 17 October, since
when analysis of responses has been undertaken.
42. Alongside the Consultation Paper, the FCA ran a comprehensive survey across 20
contract-based providers asking them to estimate their one-off and ongoing costs of
complying with the VFM framework. This survey is used to inform the cost analysis used
throughout this Impact Assessment. This is considered proportionate and robust as the
survey covers the vast majority of the contract-based market therefore can be treated as
representative. Although the survey focused on the contract-based market; it is reasonable
to expect a similar level of business impact to both contract-based and trust-based
schemes given both will be subject to similar regulations and requirements, and many firms
operate in both markets. Therefore, it is considered a robust survey to understand the
potential costs and implications. Further trust-based engagement is expected ahead of,
and during, the Pension Schemes Bill.
43. In addition to years of industry engagement, the IA uses a wide range of data sources to
further support the available evidence. This includes:
• Industry performance data from important and highly reputable sources such as
Corporate Adviser.
• International evidence and engagement, particularly on Australia, to understand the
potential impacts following their robust assessment and analysis.
• Scheme survey data on costs/charges faced by members externally commissioned by
DWP.
• Evidence from similar initiatives undertaken by the regulators and scheme returns to
regulators to understand the DC landscape.
133
https://www.gov.uk/government/consultations/value-for-money-a-framework-on-metrics-standards-and-disclosures/value-
for-money-a-framework-on-metrics-standards-and-disclosures
134
https://www.fca.org.uk/publication/consultation/cp24-16.pdf
88.
Error! Unknown documentproperty name.
88
• Annual Survey of Hours and Earnings (ASHE) to understand the pension landscape.
• FCA’s cost-benefit analysis of the proposed VFM published in the FCA’s consultation.
44. It is important to recognise that at Primary Legislation stage, policy details are still being
finalised and developed. As a result, the Impact Assessment presents the best available
evidence on the potential benefits and costs of the reforms, but these will be refined as more
evidence is gathered and policy details are finalised at secondary legislation stage.
45. DWP aims to consult again once at the secondary legislation stage to gather the views of
trust-based schemes especially. This will be an opportunity to enhance our understanding of
the potential costs to business and benefits of the policy, particularly as the policy is closer to
being finalised. FCA also intend to consult further with published feedback, refinements and
improvements to their policy proposals from their August 2024 consultation135
.
46. To further support the evidence, DWP are running a Pensions Scheme Survey which will
survey a representative sample of the workplace DC market over the course of late
2024/early2025, with findings due by Summer 2025. This will include many of the proposed
data points that will be required under the VFM framework which will allow early insight into
the range in value and performance across the DC market for the first time. This will further
allow for the improvement and refinement of policy proposals based on this data at the
secondary legislation stage.
Description of options considered
Policy Option 0: Do Nothing
47. Under a do nothing scenario, DWP/TPR would not be able take forward the policy without
legislative changes. FCA are able to proceed with the proposed VFM framework utilising
their existing rule making powers. However, this risks market-wide confusion and an
inconsistent approach across the workplace pension market placing greater burdens on only
a selection of schemes which would fail to meet the policy objective of transparent,
comparable value metrics.
48. Without joined-up policy change, the focus of industry will remain on costs and charges,
especially as the trust-based market has a significantly greater number of employers and
savers, rather than holistic value and the best interests of savers in retirement. Although
some policies have been introduced to help shift the cost-focused culture, such as excluding
some performance fees from the charge cap to decrease barriers to more diverse asset
class investment, a strong focus on cost continues. Therefore without VFM, the majority of
the market will continue to compete on costs and the wide range in investment outcomes will
continue.
49. Underperforming schemes not providing value will continue to operate in the DC pensions
market, detrimentally affecting the retirement outcomes of millions of savers.
50. Smaller schemes (under £100m in AUM) will continue to be required to provide value for
members assessments and underperforming schemes will be encouraged to wind up or
consolidate, although Regulators will still not be able to enforce this.
51. Some schemes will continue to publish their own value assessments, although it will be on
a voluntary basis, the schemes will select the level of transparency of the assessments, and
the data provided will not be comparable across industry.
52. This policy option would result in no additional costs or burdens on schemes but also no
benefits to members and potential significant harm to their retirement outcomes.
135
https://www.fca.org.uk/publications/consultation-papers/cp24-16-value-for-money-framework
89.
Error! Unknown documentproperty name.
89
Policy Option 1: Primary legislation– Preferred option
53. The proposed VFM framework requires primary legislation, as existing powers are not wide
enough to require the detailed levels of public disclosure of information envisaged by the
VFM regime. This option would provide a holistic approach for delivering the VFM framework
in full. It would set clear expectations and direction of travel for all schemes who would know
what will be delivered through legislation.
54. The VFM framework provides standard and comparable metrics on investment
performance, costs and charges and services to inform a holistic assessment of VFM. This
will allow for transparent comparisons to be made between pension schemes which will help
drive more effective competition and identify underperforming schemes. Schemes will be
required to take immediate action regarding underperforming arrangements to improve the
value they provide to savers or wind up and consolidate where this is in savers best
interests, to ensure pension savers can be protected from remaining in underperforming
schemes for long periods of time.
55. To ensure the conclusion of the VFM assessment is clear, it is proposed schemes should
fall into one of three RAG categories:
• Delivering VFM (Green)
• Not delivering VFM but has identified actions to improve performance and deliver VFM
(Amber)
• Not VFM - no credible actions to achieve VFM (Red)
This represents the proposed VFM assessment process as detailed in the FCA’s August
2024 consultation paper102
. Detail on the proposed RAG assessment and categorisation
may subsequently change or update following consultation feedback.
56. VFM assessment outcomes will set clear expectations as to what actions must be
undertaken by schemes in respect of their arrangements to improve their VFM offering and
identify the underperforming arrangements within schemes that need to wind up and
consolidate as they are unable to improve their VFM offering.
57. The VFM framework would supersede some existing regulatory requirements, such as the
Value for Members assessment and requirements for relevant schemes to assess the extent
to which their charges, transaction costs and specified performance-based fees represent
good value for members.
58. This approach would ensure consistency across the entire DC market, ensuring all savers
can benefit from the changes and employers can assess across all schemes, not just from a
sub-section of the market. Therefore, this is the preferred option.
Policy option 2: Utilising existing powers / secondary legislation – to address the
elements of data disclosure.
59. Utilising the Pensions Act 2014, Schedule 18, paragraph 2 – the Secretary of State may,
by regulations, impose requirements relating to administration and governance on pension
schemes: in relation to improving governance only. This could allow DWP to make
regulations requiring scheme trustees to assess their scheme against various metrics
(investment returns, costs and charges, service metrics) and make an overall assessment of
the value that the scheme provides. Although this power could require publication of some of
the VFM information, this would not be for the full suite of data required within the VFM
regime and this would carry both legal and handling risks.
60. Similarly, within the Pension Schemes Act 1993, section 113 – the Secretary of State must
by regulations make provision requiring publication of some of the transaction costs of an
occupational DC scheme and may require publication of “other relevant information” that
would or may assist with comparing costs and charges between schemes. While this could
be wide enough to regulate to require publication of some of the VFM material, where it
90.
Error! Unknown documentproperty name.
90
relates to costs and charges, it would not meet the aims of the VFM framework which is to
shift the focus to the value schemes offer and away from costs, therefore the risk of relying
on this power is higher.
Policy option 3: Utilising existing powers / secondary legislation – to expand the
existing VFMa.
61. Amending the requirements of the existing “value for members” assessment (VFMa) in the
Scheme Admin regs and impose new administration requirements on certain schemes which
come under the Pensions Act 2014. Use of these powers is subject to the affirmative
procedure and there is a statutory requirement to consult before any regulations are made
under Schedule 18 (para 8 of the Schedule). As detailed in Option 4, this option would fail to
provide TPR with the sufficient monitoring and enforcement powers.
Policy option 4: Absence of legislation – utilising statutory guidance to introduce
elements of the VFM framework
62. DWP could introduce some elements of VFM framework, using existing powers and
imposing new administration requirements on certain schemes which comes under the
Pensions Act 2014.
63. This option would not achieve the desired outcomes as statutory guidance would be
advisory and not mandatory, meaning schemes may not comply with VFM requirements.
Moreover, elements of the regime requiring primary legislation would not be enforceable until
there is legislative backing, e.g., TPR could not enforce wind up and consolidation, DWP
could not mandate schemes to disclose their data into a centralised repository or publicly on
their website. As a result, this would not solve the problem of trust-based schemes not
meeting current requirements as there would be no incentive for schemes to comply with the
regulations due to lack of enforcement.
64. This option would also not allow us to deliver the desired outcomes of standardisation,
transparency and comparability across the DC pensions market as schemes would not be
required to disclose standard value metrics in full and would not be required to follow a
consistent VFM assessment approach.
Summary and preferred option with description of implementation plan
65. The preferred option (1) will be implemented through primary and secondary legislation as
a result of the Pensions Scheme Bill. Primary legislation will set out broad powers to
ensure the VFM Framework and regulator enforcement of it remains responsive to an
evolving market. Further details on the policy will be set out in secondary legislation,
following consultations on regulations and FCA rules.
66. Primary legislation will allow for the implementation of the VFM framework in full, which
means all DC schemes would be required to report on the same value metrics at the same
level to enable consistent comparison of VFM across DC schemes. The legislation will
ensure:
▪ Publication of VFM metrics using a standard template including on past
performance, costs and charges, and a standardised member satisfaction survey.
▪ Publication of the VFM assessment and outcome. TPR will monitor adequate
completion of the VFM assessment by trustees. If trustees fail to publish the VFM
assessment outcome, TPR may issue them with a penalty notice / compliance notice.
Regulations will create a simple three tier-rating system of Green, Amber and Red, for
use in the VFM assessment. If TPR is not satisfied that trustees have accurately
completed the VFM assessment, or that its outcome does not represent an accurate
summary of the performance of an arrangement against the prescribed metrics, TPR
91.
Error! Unknown documentproperty name.
91
may issue a compliance notice which will require trustees to fulfil their duties / penalty
notices as appropriate.
▪ New powers for TPR to regulate compliance with requirements, including new
powers to enforce wind-up and consolidation of pension schemes identified as
consistently underperforming and unable to improve their VFM results (as long as in the
best financial interests of savers).
▪ New powers to enable contract-based providers to transfer savers in
underperforming arrangements to other arrangements or schemes providing VFM
without having to obtain individual consent of all affected savers (where this is in the
best interest of the saver).
67. This preferred option has many similarities with international VFM policies. DWP aim to
learn from the successes of the Australian model whereby the Australian Treasury
announced an implementation of net returns benchmarking as a two-part performance test
to impact all Supers by 2022. There is an assessment of 5-year investment performance
relative to a benchmark portfolio and an assessment of administration fees charged in the
last financial year relative to the median fee charged for the category of the product. If the
product underperforms the combined test by more than 0.5%, the product is deemed to have
failed the test. This performance test analyses quarterly returns on investment performance
and fees.
Expected level of business impact, policy scope and IA coverage
The scope of the VFM framework:
68. The VFM framework is initially aimed at the professional audience and will evolve over
time. This will apply to all non-micro DC schemes in the accumulation phase. Non-Micro
schemes are defined as those schemes where there are at least 12 members in the pension
scheme. This means around 950 schemes are in scope: 920 trust-based schemes and
around 30 contract-based providers.
69. Schemes will need to disclose their VFM assessments and data across their default
arrangements. A default arrangement is a fund where contributions are invested without the
employee having expressed an active choice. 94% of DC Trust pension savers use the
default arrangement of the scheme chosen by their employer for the purposes of AE.
70. As some larger schemes may have multiple default arrangements, a scheme may need to
undertake several VFM assessments. However, to minimise the business impact, where a
scheme has multiple default arrangements, arrangements with under 1,000 members are
out of scope of the framework unless this is the firm’s largest arrangement. This means
every scheme with a workplace pension will have at least 1 arrangement in-scope of VFM
which was reached on proportionality grounds following engagement with industry (as some
firms have multiple small defaults). This will be explicitly kept under review in light of the
November 2024 Pensions Investment Review consultation which proposed to increase scale
provision in relation to default funds (which itself may reduce the number of default
arrangements at scale).
71. Additionally, to reduce business costs, most of the 24,680 micro schemes (those with less
than 12 members) are excluded from the VFM framework. The majority of these are
classified as Executive Pension Plans (EPPs) or Relevant Small Schemes (RSSs) and are
subject to different reporting requirements to non-micro schemes136
. This is detailed further
in the SAMBA.
72. The VFM framework will initially only apply to savers in the accumulation phase (i.e. where
individuals are saving and growing their pension pot). Future stages of VFM legislation are
envisaged to extend to decumulation (where savers are withdrawing and accessing their
136
Of those not classified as EPPs or RSSs, a decision will be made at the Secondary Legislation stage as to whether these
(around 3,000) ‘Other’ micro schemes remain in scope of VFM requirements (as they are currently captured by VFMa
regulations) or not.
92.
Error! Unknown documentproperty name.
92
pension pot) and also to non-workplace pension assets and self-select options. These are
currently not in scope of the framework as the initial focus is on savers in the accumulation
phase of default arrangements, capturing most savers. As the DC market is relatively young,
the majority of savers are in the accumulation phase of saving and over 90% of savers
remain in the default arrangement. It is estimated between £50-100bn worth of total
workplace DC assets (currently worth around £600bn) are in decumulation137
.
73. The framework will therefore apply to all in-scope default arrangements across the 950 DC
schemes. However, this number is expected to decline over time. The number of DC trust-
based schemes has steadily declined since 2012 (over 2,700 schemes have exited the
market since 2012), with an average of 12% per year for the last three years138
. When
modelling ongoing costs, it is projected that this rate of decline will continue throughout the
appraisal period.
74. The VFM framework may itself increase consolidation rates. Alongside the framework,
there may be other pension reforms (for example on Guided Retirement) which interact with
the VFM framework. This could further reduce the number of DC schemes in the market. At
this point, the interactions across the measures cannot be known and is highly dependent on
pension scheme behaviour, sequencing and timings of implementation, and final policy
details (at secondary legislation). Therefore, at this point, there are no estimates of the
interactions within each individual IA or on the additional consolidation rates VFM may cause
(this will be considered in the overarching Pension Schemes Bill). Importantly, the modelling
of benefits (where underperformers either exit the market or improve to match the market
average) is robust to different potential paces of consolidation.
Explanation of coverage of the analysis in the Impact Assessment
75. As outlined at the start, there are two-types of workplace pensions (trust-based and
contract-based). The VFM framework requires primary legislation to be implemented in full:
• For trust-based schemes, primary legislation will enable full delivery of the VFM
framework and provide TPR with new powers to enforce wind up and consolidation
measures. DWP aims to use secondary legislation where necessary to ensure key
disclosures are in place by 2026.
• For contract-based schemes, FCA already have the necessary powers to implement
the proposed rules in the current policy framework and do not need DWP legislation.
However, wider legislation may assess the required vehicle(s) needed to transfer
members out of poorly performing contract-based arrangements. It is currently not
possible to ‘bulk transfer’ members out of contract-based arrangements into better
performing arrangements without written consent from each member (which may be time-
consuming and be met with a disengaged membership) even though doing so may be in
the best interests of members. This will form part of this Pension Schemes Bill to provide
the power to do this139
.
76. DWP, TPR and FCA have worked collectively on developing the framework. The overall
aim is to have the framework working consistently across the entire DC workplace market to
help deliver better outcomes for members. Although the vast majority of the legislation is
focused on providing the appropriate powers for the DC trust-based market, the IA assess
the impacts across the entire DC market. This is because:
▪ This is consistent with the intended scope of the VFM framework – it will cover all non-
micro DC schemes in the accumulation phase.
137
Estimates based on 2018-20 Wealth and Assets Survey and ABI Research.
138
DWP analysis of TPR data:
https://webarchive.nationalarchives.gov.uk/ukgwa/20250115145526/https://www.thepensionsregulator.gov.uk/en/document-
library/research-and-analysis/occupational-defined-contribution-landscape-2023
139
https://www.gov.uk/government/consultations/pensions-investment-review-unlocking-the-uk-pensions-market-for-
growth/pensions-investment-review-unlocking-the-uk-pensions-market-for-growth
93.
Error! Unknown documentproperty name.
93
▪ This decision reflects the view that the VFM framework will be member-focussed when
fully implemented. Members are mostly disengaged and often do not know whether they
are in a trust-based or contract-based arrangement.
▪ Employers and members could move from one part of the market to another in response
to the framework – this behavioural effect cannot be known in advance of the policy
▪ Increases transparency by outlining the overall assessment of the intended framework
This approach was taken on Pensions Dashboards to provide the best available information
for Parliamentary scrutiny140
.
Monetising the preferred policy option: Costs and Benefits
77. The Value for Money framework covers a large, growing market. Currently, the workplace
DC market is worth ~£600bn141
. When applied in full in 2027, the VFM framework will cover
over £700bn in DC assets which will continue to grow through further returns and
contributions. As a result, even small impacts could have large monetary implications. The
key costs and benefits, covered across the IA, are summarised in Table 2a. Table 2b
details specifically the specific costs/benefits that impact the £43m EANDCB figure.
78. Costs and benefits are modelled over the standard Green Book 10-year appraisal period –
while pension schemes work to long-term horizons, policy uncertainty and the uncertainty
over scheme behaviour supports the use of a 10-year appraisal as opposed to any longer
periods; especially as investment return benefits could lead to significant compounding over
time.
Table 2a: Summary of costs and benefits of VFM framework
Impact Summary Direct or
Indirect
Net Present
Value (over 10-
year
appraisal)142
Costs
One-off costs (for
pension schemes)
The costs for scheme trustees
and IGCs to familiarise and
implement the new
regulations
Direct – impacts
are immediate
and
unavoidable;
schemes are
accountable for
compliance and
the first step in
the supply/logic
chain.
£138m
Ongoing costs (for
pension schemes)
The ongoing cost of VFM
compliance e.g. writing and
conducting annual
assessments,
storing/collecting data.
£333m (£64m in
2026 falling to
£18m by 2034
as fewer
schemes remain
in market)
Costs to members Most members should not
face an increase in costs; but
there is a risk some costs may
be passed on or indirect
impacts (such as wage
impacts or contributions)
N/A Non-monetised
Costs to employers Employers should not face
any immediate or direct costs
from the VFM framework.
N/A Not monetised
Cost to Pension
Providers/Schemes
See ‘one-off’ and ‘ongoing’
costs.
Direct – as
above.
See ‘one-off’
and ‘ongoing’
costs.
140
https://www.legislation.gov.uk/ukia/2022/81/pdfs/ukia_20220081_en.pdf
141
https://www.pensionspolicyinstitute.org.uk/media/xfybvxtq/20230926-the-dc-future-book-9-2023.pdf
142
2024 prices 2025 base year. Total cost presented across both trust and contract-based sides of the market; as outlined in
Paragraph 77.
94.
Error! Unknown documentproperty name.
94
Costs to the
Pensions
Regulator (TPR)
TPR may experience added
costs when they need to issue
schemes to wind up if they
are providing poor VFM over
a sustained period.
N/A Non-monetised
Benefits
Benefits to savers With better VFM, savers can
potentially receive greater
investment returns which will
grow their pension pots,
contributing to more income in
retirement.
Direct –
improved
value/returns is
the prime policy
aim in the
regulated
market. Classed
as a direct
member benefit
(not business,
so does not
enter EANDCB
figure) as the
member
(principal/asset
owner) sees the
benefit pass
through the
scheme (agent,
see footnote)143
without having
to take action.
£20bn gross
benefits, £2bn
per year of
appraisal.
Benefits to Pension
Schemes
Pension schemes benefit from
improved performance due to
charging structures
(monetised) and have more
availability of information
(non-monetised)
Direct – follows
automatically
and immediately
from the above
(schemes will
keep a small %
of the overall
benefit from
improved
returns through
charges) and
involves no
additional steps
in the chain of
events.
£99m benefits to
schemes, £10m
per year.
Benefits to
Employers
Employers will find it easier to
choose pension scheme, will
be able to see if their chosen
scheme offers the best VFM
and can switch to better
arrangements.
N/A Non-monetised
143
See ‘exceptions to the normal application of pass-through’ section -
https://assets.publishing.service.gov.uk/media/5c9b7ccde5274a52811778f2/RPC_case_histories_-
_direct_and_indirect_impacts__March_2019__1_.pdf ; the ‘agent’ (scheme) invests on behalf of the ‘principal’ (the saver, asset
owner) – therefore the benefit ultimately (and entirely, except for a small % of charge revenue which is separated out in Table
2a) passes through to the saver and is classified here as direct given this is the first step in the logic chain, a partial equilibrium
effect on the regulated DC pensions market, and the primary aim of the policy.
95.
Error! Unknown documentproperty name.
95
Table 2b: Drivers of the EANDCB figure
Direct Costs to Business Monetary Value (NPV) Explanation – why this is
direct to business
One-off costs (familiarisation
and implementation)
£138m Direct business cost (to
pension providers) as this
is an immediate and
unavoidable cost burden
of the policy all schemes
must do.
Ongoing costs (complying with
VFM requirements annually)
£333m (cumulative NPV
over 10-year appraisal)
Direct business cost (to
pension schemes) as all
schemes in the market will
be required to comply with
the VFM regulations each
year so costs are
unavoidable and
immediately felt by
businesses.
Direct Benefit to Business:
Extra charge revenue received
on improved investment returns
£99m (cumulative NPV
over 10-year period)
Direct benefit to business
(pension schemes) as
improved fund
performance is the main
policy aim; improved
performance directly and
automatically translates
into higher charge revenue
for schemes.
This means businesses (pension providers) are directly impacted by the cost
burdens of the policy. Businesses (pension providers) do also directly benefit from
the additional charge revenue of improved investment returns as a direct benefit to
partially offset this.
This means the EANDCB is a £43m annual direct cost to business. This is because
the main direct benefit of the policy accrues to members, not to businesses, as
members are the ultimate owners of the pension investments that now receive better
value (hence the high ‘NPSV’ figure on Page 1, £19,364m).
Costs to businesses – one-off and ongoing costs
79. Cost estimates to schemes are based on an FCA survey from December 2023 across 20
contract-based providers and 1 Master Trust specifically to identify the potential costs of the
policy. This covers the vast majority of savers in the contract-based market (and many
schemes operate in both the trust and contract-based market).
80. It is expected the large schemes across both the Contract and Trust based markets would
have similar costs, and therefore the survey is considered robust in applying across the
market. Although the survey did not cover single-employer trusts, costs have been adapted
based on assets under management to reflect there may be cost differences by size of
scheme. Estimates were wide-ranging given the range of scheme sizes within the market,
however estimates for schemes within similar size asset bands were more consistent with
one another which gave us greater confidence in the accuracy of the survey and in our
weighted average approach.
96.
Error! Unknown documentproperty name.
96
81. To further improve robustness of the survey, further steps were taken:
▪ Respondents estimated their one-off and ongoing costs of the proposed VFM framework
as set out in the July 2023 Joint Response Paper.
▪ Given policy developments made from the initial consultation, the survey was re-
commissioned and more policy detail was provided to respondents, so estimates were
more informed.
▪ Survey results were cross-checked with initial consultation feedback DWP received in
January 2023, showing consistency in estimates.
▪ Further industry engagement is planned to further improve the cost estimates.
82. Using the survey, average costs were determined by:
▪ Splitting survey responses into AUM bands reflecting larger and smaller schemes will
likely face different costs.
▪ The average total one-off cost is taken for each of the four AUM bands.
▪ These averages are then weighted based on how prevalent the AUM band size is in
each of the contract-based and trust-based markets respectively144
.
▪ The result of this weighting gives the total one-off cost of the VFM framework across
both the contract-based and trust-based markets.
83. The contract-based weighted average (£470,000 per scheme) is higher than that of the
trust-based (£90,000) because a much greater proportion of the contract-based market are
large schemes managing more than £2.5bn in assets. Additionally, contract-based schemes
may be more likely to have multiple default arrangements (increasing costs) and have a
wider range of defaults, funds, and charges to consider.
Table 3: Weighted average one-off costs of VFM for contract and trust-based schemes
Contract-Based
AUM band (£) Average VFM cost
(per
provider/scheme)
Weight of
scheme size
in market145
Weighted
Average
Adjusted Average
(with 25%
optimism bias)
£0-£100m £68,000 20%
£ 470,000 £588,000
£100m - £1bn £113,000 25%
£1bn - £2.5bn £166,000 10%
>£2.5bn £910,000 45%
Trust-Based
AUM band (£) Avg VFM cost
(per
provider/scheme)
Weight of
scheme size
in market146
Weighted
Average
Adjusted Average
(with 25%
optimism bias)
£0-£100m £68,000 86%
£ 89,000 £111,000
£100m - £1bn £113,000 8%
144
An alternative method that arrives at the same answer would be to simply multiply the average VFM cost by size column by
the distribution of providers within each AUM band, rather than weight to a single estimate.
145
Based on reported AUM to FCA survey
146
https://webarchive.nationalarchives.gov.uk/ukgwa/20250115145526/https://www.thepensionsregulator.gov.uk/en/document-
library/research-and-analysis/occupational-defined-contribution-landscape-2023
97.
Error! Unknown documentproperty name.
97
£1bn - £2.5bn £166,000 3%
>£2.5bn £910,000 2%
84. “Optimism Bias” has been applied in line with Green Book standards; this is estimated at
around 25%. This reflects the uncertainty on the final policy details, that schemes may
underestimate some of the costs as VFM is a large policy initiative, and because survey
estimates are based on a non-final policy position.
85. In Annex D, sensitivity analysis on costs is presented. For one-off costs,
implementation costs are increased/decreased by 50%. This is so that the range and
distribution in estimates received by survey respondents is mostly reflected. ‘Implementation
costs’ varied across respondents as some schemes may already have their internal value for
money metrics set up and already be monitoring the proposed policy metrics, especially
given the proposed Value for Money metrics have been publicised and consulted on
numerous times over the last few years. Other schemes may not have this data monitoring
to hand or already implemented and will therefore need to implement new systems to collect
this data and implement it within their business. Putting sensitivity around this therefore
captures the range of survey responses received and covers the pure ‘additionality’ the
proposed Value for Money framework will impose on scheme costs (e.g. ‘low’ additionality
where schemes already have this data/monitoring and ‘high’ additionality where schemes do
not already have this).
86. The remaining sources of one-off costs (e.g. familiarisation costs) are not subject to
sensitivity analysis given these displayed more consistency in responses and also aligned
with past consultation response estimates from pension schemes. However in the low
scenario, ‘Other’ costs are also reduced by 50% due to the range in responses received
(due to difficulty in being able to split out VFM requirements from wider regulatory
requirements) and the potential for pessimism bias.
87. For ongoing costs, all line-items are increased/decreased by 25% in both low and high
scenarios in order to ensure the broad range in survey estimates are covered. This also
broadly reflects the potential for biases either side of the central scenario (e.g. final policy
detail may push up ongoing costs or pessimism bias may mean ongoing costs are lower as
schemes overestimate costs in surveys to minimise the burden on them). Ongoing costs are
estimated to be lower than one-off costs, and had a tighter range, hence the smaller
sensitivity ranges applied to ensure the broad range in survey estimates are captured.
One-off costs of the VFM framework
Familiarisation Costs
88. Familiarisation costs come directly from the FCA survey but are adjusted slightly. As the
survey was done in two iterations to help improve the accuracy of the estimates from
providers, information from both returns are used:
o The first survey covered total costs and how this was made-up of familiarisation and
one-off costs.
o The second survey sought clarification on overall total costs based on new, emerging,
policy details.
89. As a result, the proportion of total one-off costs that were familiarisation costs from the first
survey have been applied to the new total one-off costs reported in the second survey. For
example, if a provider estimated in the first survey their total one-off costs for the VFM
framework would be £100,000 and £20,000 would be via familiarisation costs, the 20%
assumption is applied to the new estimate of total costs from the second survey. That means
if costs were revised down to £50,000, it is assumed familiarisation costs for that provider
would be £10,000 (i.e. 20%). This is repeated with all itemised one-off and ongoing cost
breakdowns throughout the rest of this section.
98.
Error! Unknown documentproperty name.
98
90. This results in a total familiarisation cost of £21.4m. This is based on the FCA survey
estimating a £138m total one-off costs of VFM and the initial survey suggesting 15% of these
costs would familiarisation. This reflects the costs involving all trustees and IGCs
familiarising themselves with the new requirements.
Implementation Costs
91. Implementation costs were split out in the FCA survey into four sub-categories: Learning
costs, developing metrics, implementing the data framework and other. These are presented
and apportioned in Table 4 below.
Table 4: Estimated itemised one-off costs of the VFM framework across the trust-
based and contract-based DC market
Total one-off VFM
cost
Whether familiarisation
or implementation costs
Proportion attributable to
each line-item
Itemised one-
off costs
£138m total one-off
VFM cost
Familiarisation … of which familiarisation:
16%
£21.4m
Implementation … of which implementing
data template: 19%
£26.4m
… of which developing
metrics: 11%
£15.1m
… of which learning costs:
5%
£6.3m
… of which other: 50% £68.6m
Total one-off costs £138m
92. The key implementation costs identified by the department, regulators, and in consultation
with industry were:
a) Implementation of the data template: Schemes may incur one-off costs in relation to
the implementation of data reporting templates and may need to build VFM specific
software and teams to deliver this. Based on FCA responses, this is estimated at around
£26m in year one across the whole market (around 19% of total costs).
b) Developing metrics: Most schemes already calculate metrics to measure investment
performance, assess costs and monitor quality of governance. However, the metrics
required for the VFM framework may be slightly different to the metrics already
produced by schemes. To comply with, or develop, the metrics required for the VFM
framework, schemes may face additional costs. Based on FCA responses, this is
estimated to be £15m in year one (around 11% of total costs).
c) Learning costs: It is expected there may be added learning costs, over and above
familiarisation costs, for schemes/trustees/IGCs, as a result of the VFM framework and
learning how to comply with the new regulations. Based on FCA responses, it is
estimated to be £6m in year one (around 5% of total costs).
d) Other: Schemes and/or asset managers may incur added costs if they need to respond
to data requests from trustees/IGCs. Schemes and trustees may incur additional costs
to liaise with external stakeholders or upgrade current systems to collect and store more
information. Some respondents also added high amounts in ‘other’ due to the policy
detail not yet being finalised. Based on FCA responses, these miscellaneous other costs
are estimated to be £69m (around 50% of total costs).
99.
Error! Unknown documentproperty name.
99
93. These cost estimates have been broadly consistent across surveys and consultation
responses, giving some reassurance to the estimates. Though it is recognised this may vary
scheme-to-scheme.
94. Underperforming arrangements may face the one-off cost of looking to consolidate their
scheme with a value-providing arrangement. This has not been monetised at this stage.
Consolidation and/or wind-up costs as a result of VFM are assumed to be a transfer of costs
and benefits. The consolidating/winding up scheme may lose their assets (a cost) but this
represents a benefit to the consolidating vehicle/wider market. Despite consolidation and
winding up being clear and significant potential outcomes of our proposed VFM framework, it
has not been modelled to schemes as the costs and benefits are expected to offset one
another at the whole-market level.
95. The costs will continue to be improved at the secondary legislation stage where firms will
be able to more accurately estimate their expected costs of the framework based on more
detailed information. It is also important to note there may be some savings to schemes
which offset some of the costs helping to reduce the additional regulatory burden. For
example, the VFM assessment report will replace some existing regulatory duties placed on
schemes (e.g. Chair’s Statements, Value for Members assessments).
Ongoing costs of the VFM framework
96. Total ongoing costs of the VFM framework are taken from the same FCA survey described
above and follow the same method of a weighted average approach.
• The annual weighted average ongoing cost in the contract-based market is £190,000 per
scheme per year. Multiplied by the 30 in-scope contract-based providers results in £6m
of ongoing costs across contract-based providers.
• The annual weighted average ongoing cost in the trust-based market is £55,000 per
scheme per year. Multiplied by the 845 trust-based schemes projected to be in-scope by
2026 results in £47m of ongoing costs across all in-scope trust-based schemes.
97. Accounting for optimism bias, this gives a total ongoing cost of £66m in 2026 (constant
prices), the first year in which ongoing costs will be felt. As expected, this is lower than that
provided for one-off costs as systems will already be in place across firms and staff will be
familiar with the requirements of the framework.
98. The DC market is expected to continue to consolidate (around 12% fall in the number of
schemes per year). Using the past trend, it is estimated the DC market could have around
350 schemes by the end of the 10-year appraisal period (see Figure 7). Given the large
number of smaller pension schemes in the trust-based market, this is expected to be the
area consolidation occurs with the contract-based market stays at around 30 providers. This
also reflects the lack of readily available information on contract-based schemes.
99. It is noted that VFM, or other Pension Schemes Bill measures, may speed up or interact
with further consolidation but the scale of this is uncertain. It is therefore assumed to
continue at a 12% annual consolidation rate. Although it is reasonable to expect VFM to
consolidate the market further, and this could accelerate the current consolidation level, this
effect cannot be known in advance and the VFM provides the opportunity for poorer
performing schemes to improve (rather than just exit the market). On balance, continuing
existing trends and the benefit modelling methodology shows the potential benefits of VFM
both through the consolidation and/or improvement of poor-performing schemes into
higher performing ones.
100.
Error! Unknown documentproperty name.
100
Figure 7: Projected number of DC schemes in scope over the 10-year appraisal period
100. Continued consolidation means ongoing costs, shown in Table 5, are projected to fall
over the appraisal period from £66m to £25m by 2034 (constant prices). This is against the
backdrop of average DC wealth being in the £10,000s, and rising. This reinforces the
likelihood that members may not see increased costs or any increase would be negligible
relative to the pot size.
101. Given the AUM bands used are fairly large and consolidation is happening across the
entire market, average ongoing costs are not adjusted by AUM (for example, as schemes
get larger) in this analysis.
Table 5: As the DC market continues to consolidate, ongoing costs are projected to
decrease (constant prices)
2025 2026 2027 2028 2029 2030 2031 2032 2033 2034
Total ongoing (£m) £0 £66 £59 £52 £46 £41 £36 £32 £28 £25
Itemised ongoing costs
102. Within total ongoing costs, schemes will be subject to annual compliance costs (the
proportions of which are assumed to remain constant over the appraisal period) in the
form of:
a) Conducting the VFM assessment and writing the VFM report: As IGCs/Trustees will
need to produce an annual VFM report; including gathering the data, comparing against
chosen comparators, and conducting the RAG rating. Based on FCA responses, this is
estimated to account for around 27% of total ongoing costs.
b) Collecting and storing VFM data: Schemes will have to collect and store the VFM data
points on their systems on an ongoing basis. Based on FCA responses, this is
estimated to account for around 21% of total ongoing costs.
c) Data framework reporting: Schemes will have to report on the VFM data points which
will be costly to extract and may require liaising with asset managers in some cases.
Based on FCA responses, this is estimated to account for around 12% of total ongoing
costs.
d) Additional meetings/time: Schemes may have to hold additional meetings to comply
with VFM regulations and ensure the VFM report and assessment is completed
accurately. There may also be increased staff costs to monitor and complete VFM
assessments. Based on FCA responses, this is estimated the ongoing cost of additional
meetings to account for around 10% of total ongoing costs.
0
200
400
600
800
1,000
1,200
2024 2025 2026 2027 2028 2029 2030 2031 2032 2033 2034
101.
Error! Unknown documentproperty name.
101
e) Providing data at request: Schemes will have to provide and submit the framework
data points to complete the VFM assessment and monitor metric performance. Based
on FCA responses, this is estimated to account for around 8% of ongoing costs.
f) Other: Schemes may face wider additional costs such as further developing VFM
metrics in line with the proposed framework. Based on FCA responses, it is estimated
these miscellaneous other costs would account for around 22% of total ongoing costs.
Schemes may also face ongoing costs of VFM outcome and compliance actions, such
as communicating to regulators/employers, improving their VFM metrics and/or the
costs of consolidating their scheme.
Table 6: Itemised ongoing VFM costs over the appraisal period (£m, constant prices)
Item (% of total) 2025 2026 2027 2028 2029 2030 2031 2032 2033 2034
Assessment
reporting (27%)
£0 £18 £16 £14 £13 £11 £10 £9 £8 £7
Data collection and
storage (21%)
£0 £14 £12 £11 £10 £9 £8 £7 £6 £5
Framework data
reporting (12%)
£0 £8 £7 £6 £6 £5 £4 £4 £3 £3
Additional
meetings/time (10%)
£0 £7 £6 £5 £5 £4 £4 £3 £3 £2
Providing data at
request (8%)
£0 £5 £4 £4 £3 £3 £3 £2 £2 £2
Other (22%) £0 £15 £13 £11 £10 £9 £8 £7 £6 £5
Total ongoing
(100%)
£0 £66 £59 £52 £46 £41 £36 £32 £28 £25
103. The majority of ongoing costs are through schemes having to conduct and produce
the VFM assessment report on an annual basis, as well as extracting and storing the
required data. This has followed extensive industry engagement to ensure this process is
balanced against the burden to schemes and schemes will have 7 months after the
publication of VFM data to compile the report. Ongoing costs are modelled to decline over
the appraisal period as fewer schemes remain in the market due to consolidation; the
proportion of total ongoing costs attributable to each line item is assumed to remain constant
over time as it cannot be estimated how or if these may change over time
Cost to members
104. As schemes face additional costs from the VFM framework, they may look to pass this
onto members. This is possible given the low profitability in the current Master Trust market
(though this is expected to increase significantly as pot sizes continue to grow)147
.
105. However, costs being passed on to members should be mitigated by the charge cap (set
at a limit of 0.75% of assets under management meaning firms cannot charge more than
this) which applies to the default arrangements in schemes offering money purchase
benefits for the purposes of automatic enrolment – the majority of whom are in-scope of our
proposed VFM framework.
106. Additionally, the market is competitive on cost, meaning schemes may not pass on these
added costs. Evidence from employers also shows that cost remains the dominating factor
when selecting (or considering switching) pension schemes under their automatic enrolment
duties.148
Even though the VFM framework is intended to shift focus away from purely
147
https://www.gov.uk/government/publications/evolving-the-regulatory-approach-to-master-trusts/evolving-the-regulatory-
approach-to-master-trusts#fnref:17
148
https://www.gov.uk/government/publications/workplace-pensions-and-automatic-enrolment-employers-perspectives-
2022/workplace-pensions-and-automatic-enrolment-employers-perspectives-2022
102.
Error! Unknown documentproperty name.
102
centring on costs, it is still a vital component of a scheme’s wider VFM offering and thus will
remain a driver of competition.
107. To support the judgement, the ‘Evidence from Australia’ section showed that the rollout of
the annual Performance Test coincided with a decrease in reported member-borne fees due
to economies of scale which may arise as schemes become larger in size. This feels less
likely to materialise in the UK market as this is starting from a much lower cost basis leaving
less room to decrease further (many schemes are already well below the charge cap and the
average charge is 0.5%).
108. Therefore, it is not assumed that members will see increased costs as a result of the
framework.
Cost to The Pensions Regulator
109. Any related costs to the regulator from the developing, implementing, and undertaking
ongoing regulatory activity under the VFM framework would be drawn from TPR’s existing
budget. Further detail will be provided once the compliance regime and policy position has
been finalised.
Costs to the Financial Conduct Authority
110. It is not expected the proposed measures will lead to any significant direct costs to the
FCA, as supervision and enforcement of the proposed rules will be undertaken using
existing resources, though this may indirectly result in costs related to opportunity
costs/prioritisation costs. Further detail will be provided once the compliance regime and
policy position has been finalised.
Benefits
Benefits to Savers
111. The main beneficiary of the VFM framework is expected to be pension savers as their
long-term retirement outcomes will be improved through being in better-performing DC
arrangements than they would have been without the VFM intervention. Given the size of the
DC market (£600bn and growing), even just small differences in performance may have a
material impact on the market and individuals.
Performance
112. The largest quantifiable benefit to savers of the VFM framework is the improved
investment performance delivered on their pots and contributions. This has the potential to
deliver large benefits over a saver journey due to compound interest (as previously
mentioned, investment returns can account for around 60% of final DC pot value). The
benefit can arise through two impacts:
a) Removal of underperforming schemes as those schemes who are
underperforming on investment returns and across services and costs/charges may
be removed from the market.
b) Improvement of investment by schemes through putting an improvement plan in
place to avoid being wound up alongside learning from best practise across the
industry to be able to replicate asset allocations of schemes that have delivered good
VFM.
113. The wide inequality in returns that currently exists in the market means that there is a
high amount of upside potential in average investment performance levels if
underperforming schemes were to improve or exit the market. Especially given switch rates
by individuals and employers, as previously mentioned, are incredibly low at just a few
percent.
103.
Error! Unknown documentproperty name.
103
114. As set out in the FCA consultation document, assessing investment performance is the
first step in the assessment process given it is “is critical to long term outcomes149
”. The gap
between the highest and lowest performing scheme has been 55% over the last 5 years,
closing even part of this gap would deliver large saver benefits. This means that a saver with
a pot of £10,000 would have notionally lost around £5,000 over a 5-year period from being in
the lowest performing scheme compared to if they were in the highest.
115. Using industry data (Corporate Adviser) which captures the performance across the
largest pension schemes in the contract and trust market (which is also where the majority of
assets and savers are), an indication of the likely impact can be estimated. Data shows a
wide, and persistent, variation in gross investment performance. Table 7 below
demonstrates how wide ranges in performance outcomes between the highest and lowest
performing schemes have persisted over the past 5 years.
Table 7: The range in 5-year annualised investment returns for younger savers is
large and persistent indicating pockets of significant underperformance in the DC
market150
5-year annualised gross returns for
younger savers
Q3
2018
Q3
2019
Q3
2020
Q3
2021
Q3
2022
Q3
2023
Highest Performing Scheme 12% 10% 12% 12% 10% 9%
Market Average 10% 10% 9% 9% 5% 5%
Lowest Performing Scheme 7% 5% 5% 6% 1% 0%
116. The table also shows persistent clusters of underperformance compared to the market
average (for example, in most of the years above in Table 7, the average has been closer to
the highest performer than the lowest performer indicating that a small proportion of
schemes are significantly below the market average).
117. As a proxy for the policy intent of VFM, removing (or improving) those schemes identified
as significantly underperforming (2 percentage points or below average) would have pushed
up market-wide average returns by 0.4 percentage points per year on average over the last
5 years (see Figure 8). This is a weighted market average by the number of savers with
each scheme.
Figure 8: Weighted average gross investment returns would increase from 7.7% to
8.1% if significantly underperforming schemes were removed from the market151
149
https://www.fca.org.uk/publication/consultation/cp24-16.pdf
150
https://capa-data.com/younger-saver-30-years-to-retirement-5-year-annualised-line/
151
https://capa-data.com/younger-saver-30-years-to-retirement-5-year-annualised-line / Q4 2023 CAPA data
0.0%
1.0%
2.0%
3.0%
4.0%
5.0%
6.0%
7.0%
8.0%
9.0%
Average Return (weighted) Average Return with VFM (weighted)
104.
Error! Unknown documentproperty name.
104
118. This 0.4 percentage point improvement becomes the key assumption in this Impact
Assessment’s monetisation of benefits. For this reason, it has been strengthened
through a variety of sources:
• As above, a 0.4ppt performance uplift would be achieved in the current DC market if
schemes flagged as underperforming (defined as being 2ppts below the market
average) were consolidated from the market or improved their performance to
match the current average. While 2ppts is a somewhat arbitrary definition of
‘underperforming’, this is sufficiently below average performance levels to warrant
attention, especially as UK and Australian schemes show persistence in their
investment performance. This definition would lead to a similar proportion of
schemes ‘underperforming’ as was observed in year one of Australia’s
performance test.
• The scale of this performance uplift by removing/improving underperformers has
changed over time but has persisted. As outlined in Annex B, the average uplift
could have been as high as 0.6ppts in 2021 or as low as 0.1 percentage points in
2018. However, on average since 2018, this policy simulation has resulted in a
0.4ppt performance improvement at the market-wide level. Therefore both the
current and 5-year average exercise of removing/improving underperformers
results in a 0.4ppt uplift to average market performance on average.
• Removing those flagged as underperforming would also correspond to around 13%
of schemes in the Corporate Adviser dataset of the largest UK Master Trust and
Group Personal Pension schemes (or 15% of savers) failing the proxy ‘test’ applied
here. This is similar to the proportion of Australian schemes that failed the Annual
Performance Test in its first year (16%) giving further confidence in potential size of
policy impact.
• As outlined in Paragraph 35, key emerging findings from Australia finds an overall
improvement in performance after the first few years of its policy. Average
investment returns by 2023 were 0.4ppts higher than they were at the start of the
policy initiative (defined as distance above benchmark, see Figure 5)152
. This is
likely as a result of the removal and/or merging of poor performing schemes (for
example, in 2021 75 products were tested and this had fallen to 58 by 2023 as
underperforming products had exited the industry; though other factors may be
contributors too). No Australian schemes failed the performance test in its latest
round, suggesting a new higher steady state has been established in the market
that is around 0.4ppts higher than it was at the start of the policy initiative.
o Australian members also benefitted from fees falling, with members of
products that failed the test paying fees 20% lower than before. Whilst there
may be less scope for charges to fall in the UK, due to them already being
low because of competition and the charge cap, it is further evidence of
potential of net investment returns to increase due to the policy.
• Therefore, numerous sources (such as proxying VFM policy intent using the
latest industry data, average industry data over the last 5 years, and
evidence from a similar policy in Australia whose pensions market is most
similar to the UK) suggest that an incremental improvement of 0.4ppts to
current average market performance is an appropriate central assumption
upon which to monetise benefits. That is to say, 0.4ppts is a reasonable,
evidenced expectation of how much higher the new ‘steady state’ levels of
returns could be through promoting better value for money on pension
savings.
• Given the importance of this assumption, sensitivity analysis is applied in Annex B.
Market impacts will depend on scheme behaviour, wider market performance, final
policy details and potentially interactions with other Bill measures. This could mean
152
https://www.apra.gov.au/insights-paper-2023-performance-test
105.
Error! Unknown documentproperty name.
105
the final impact is lower than 0.4ppts. Importantly, even in the ‘low’ scenario (where
perhaps not all underperforming schemes ‘fail’ their VFM assessment initially, the
policy creates herding which might counteract performance improvements, or there
is a market-wide downturn), VFM policy is projected to deliver significant net
benefits (£6.5bn, 2024 prices).
Setting up the calculation:
119. DWP stock-flow forecasts of the DC market suggest the market being worth around
£715bn in 2027. This is consistent with forecasts from external sources such as the PPI’s
2023 DC Future Book153
.
o Decumulation assets are subtracted - £75bn is estimated to be in decumulation
(outside the scope of the framework) by 2027. This is based on ABI estimates of £94bn
worth of assets crystalised (but this also covers personal pensions which are out of
scope)154
. The Wealth and Assets Survey shows £50bn of workplace DC assets in
decumulation as of 2018-20. Therefore, an approximate midpoint of £75bn is taken
giving a starting market size of £640bn by 2027.
o No VFM benefits arise from 2025-2026 as the policy is not yet live and would be still
undergoing the legislative process.
o No VFM benefits arise in 2027 as this will be the first year of the policy so schemes will
not have had chance to improve their VFM.
▪ Only those in growth phase of saving benefit - Using ASHE data, the proportion of
DC savers are modelled who are in the growth phase of saving. The 0.4ppts improved
returns assumption applies only to growth phase assets. In 2022, 82% of active DC
savers were in the growth phase (defined as savers being aged 22-54). DC schemes
commonly apply “lifestyling” whereby assets for older savers are moved into safer
assets, such as government bonds, at the expense of riskier assets, such as equities.
Although VFM could support and increase investment returns for older savers too, as
investment differences appear for this cohort too, a conversative approach is taken by
focusing on younger savers where investment returns are of greater focus for schemes
and where investment performance varies much more substantially.
▪ Decline in growth phase savers is projected as the DC market matures and the
average age of a DC saver increases. The share of savers in the growth phase of DC is
projected to decrease in line with the average rate of decline over the past 4 years
(0.5% per year).
▪ These restrictions (80% of savers) are then multiplied by the assumed DC market size
(£640bn) to have a starting in-scope market size of around £510bn, as outlined in the
flow diagram below.
Figure 9: Flow diagram showing the derivation of the VFM framework starting ‘in
scope’ market size
153
https://www.pensionspolicyinstitute.org.uk/events/2023-the-dc-future-book-2023/
154
ABI Retirement Income Data H1 January 2024 (https://www.abi.org.uk/data/data-packages/)
106.
Error! Unknown documentproperty name.
106
120. To account for improved investment performance as a result of VFM, from 2028-2031,
average investment performance is estimated to increase equally over a 3-year period by
around 0.13ppts per year (summing to 0.4ppts after 3 years). This means average
investment returns increase incrementally from 7.7% in 2027 (the current market weighted
average) to 8.1% by 2031. In line with DWP Pension Charges Survey, charges are
estimated at 0.5% and subtracted from the gross returns calculated above. This ensures
benefits for members are calculated on a net basis.
121. With an assumed market size of £512bn by 2027, the DC market is modelled as growing
under two scenarios, each presented in Table 8 below:
a) Counterfactual: This is defined as current market performance continuing; there is no
VFM framework and nominal, net investment returns remain constant over the appraisal
period, at 7.2%155
. This is then converted to ‘real’ growth by subtracting off OBR’s
forecast of average earnings. The DC market asset base is then uprated on this basis;
averaging a 3.7% real return per year.
b) VFM Scenario: With VFM, performance is projected to improve. This assumes net
returns rise incrementally from their current 7.7% levels by 0.4ppts over a 3-year period
to a new higher baseline over the remainder of the appraisal period. The incremental
rise is supported by evidence from Australia; where performance gradually improved to
a new steady state as opposed to a one-off step change. The same OBR average
earnings forecast is netted off and the DC market uprated on this basis; averaging a
4.1% real return per year, 0.4ppts higher than in the counterfactual scenario.
155
This is based on the 5-year annualised investment return for younger savers being 7.7% in Q32023 from Corporate Adviser
data. Adjusting for charges (0.5% based on DWP Pension Charges Survey), this means net returns have averaged 7.2%
across the DC market over the last 5 years. https://capa-data.com/younger-saver-30-years-to-retirement-5-year-annualised-
line/
£715bn DC market
forcast for 2027 (DWP
and PPIforecasts).
£75bn of this is
decumulation (WAS,
ABI data).
£715bn - £75bn =
£640bn DC
accumualtion market
in 2027
80% of the remaining
£640bn comprises
'growth phase savers',
the focus of benefit
monetisation here.
80% * £640bn = £512bn
starting market size in
2027.
107.
Error! Unknown documentproperty name.
107
Table 8: Calculating the benefits of VFM through net investment return improvements
(all £ in bns) 2025 2026 2027 2028 2029 2030 2031 2032 2033 2034
Net Nominal
Return (with VFM)
No VFM benefits
over this period (see
sub-bullet Paragraph
119)
7.2% 7.3% 7.5% 7.6% 7.6% 7.6% 7.6%
Net Nominal Return
(Counterfactual)
7.2% 7.2% 7.2% 7.2% 7.2% 7.2% 7.2%
Real VFM Returns 4.9% 4.7% 3.9% 4.0% 4.0% 3.9% 3.9%
Real Counterfactual
Returns
4.9% 4.6% 3.7% 3.6% 3.6% 3.5% 3.5%
DC Growth market
with VFM
£535 £562 £588 £611 £636 £661 £687
Counterfactual DC
Market
£535 £562 £587 £609 £631 £653 £676
Difference (VFM
impact)
- - £1 £2 £5 £8 £10
Cumulative Total Total of £26bn greater investment returns via VFM
… of which
additional charges
revenue to
schemes
£0.01 £0.02 £0.04 £0.05
… of which £130m is additional charge revenue to schemes
(0.5%)
122. Comparing the size of the DC market under the VFM proposals against the counterfactual
shows the extent of potential benefits available through improved investment performance:
Benefits compound over time and sum to £26bn (£20bn NPV) over the 10-year appraisal
period. That is, the DC market could be £26bn (£20bn NPV) greater under the framework
compared to the counterfactual where performance is constant and does not improve. As
explained in table 2a, this is categorised as a direct benefit to members.
While a very large figure, this is against a backdrop of a £700bn projected DC growth phase
market by 2034. The assumed investment return improvements of just 0.4ppts over 3 years
results in a growth phase market that is £11bn larger by 2034 (cash terms) – this is under
2% of the entire assumed market size. This simple stock-flow analysis also does not account
for additional contributions or within-market acquisitions, which may further affect future
market growth, therefore overall benefits may be underestimated. The above approach is
similar to that taken by FCA analysts in their published cost-benefit analysis of their August
2024 consultation document156
.
123. In Annex A, an alternative ‘bottom-up’ methodology is estimated to validate the central
estimates, which arrives at a similar cumulative benefit figure.
124. In Annex B, sensitivity analysis is presented around this key investment return
assumptions, presenting a VFM upside and downside depending upon the ultimate impact
on returns (which cannot be known in advance). In particular, even a ‘downside’ scenario
where returns are not improved by 0.4ppts (for example if the policy leads to herding, there
is a market downturn or not all underperforming schemes are captured by VFM
assessments), large net policy benefits remain as standards should still be driven up to
some extent which outweighs the cost burdens of the policy.
125. In Annex C, a case study using the DWP’s iPen model is presented. This models how a
median earner’s DC pot would result in just under £1,300 more to spend in retirement each
year as a result of a saving into a better performing DC market over their working life (by
improving the ‘baseline’ return assumption by 0.4ppts, as per this Impact Assessment’s
central assumption).
156
https://www.fca.org.uk/publication/consultation/cp24-16.pdf
108.
Error! Unknown documentproperty name.
108
126. Each of these robustness checks confirm the potential for VFM to deliver large net
benefits to members.
Benefits to Pension Schemes
127. Pension schemes will also benefit from this improvement due to the way fees are
structured in the market.
o Members are charged an ‘annual management charge (AMC)’ on their investments that
covers the cost of the pension scheme investing member contributions.
o AMCs are set at a % of pot value. As pot sizes increase through improved investment
returns, this would mean that pension schemes extract a higher amount of revenue from
member contributions as a result of improved performance compared to if schemes did
not improve performance (the counterfactual).
o The benefit to pension schemes is classified as a direct benefit to schemes, since
increased charge revenue would be early in the logic chain of policy impact and a first-
order effect of improved performance across the DC market (as higher charge revenue
would automatically and immediately stem from improved performance).
o Using Table 8 above, despite being on a net returns basis, calculating 0.5% (the
average charge in the DC market) of the difference in annual market size between the
VFM and counterfactual scenarios would result in £130 million (£100m NPV) higher
charge revenue in the VFM scenario. This is a rough proxy of additional charges
revenue schemes may see in a VFM world. It also shows the benefits of aligning
interests and overcoming potential principal-agent problems – focussing on improved
value and improved returns brings benefits both to savers and to schemes offering good
value.
o This means the majority of VFM improvements will benefit members directly – through
larger pots earning greater returns. However schemes will also benefit through a larger
market meaning more member-borne charge revenue. These benefits will continue to
increase over time as pensions are a long-term saving vehicle and the compounding
effect will mean revenues could increase significantly beyond the 10-year period
assessed.
o The crossover/breakeven point - where the direct annual ongoing costs to
pension schemes are superseded by the additional charge revenue benefit
pension schemes are estimated to receive - comes in Year 9 of the appraisal
period (i.e. 2033 is where the framework is estimated to become a direct net benefit to
pension schemes, see Table 9). This is due to ongoing costs falling (as fewer schemes
remain in the market and the framework becomes embedded) and charge revenue
increasing (due to the compounding of improved performance). This shows the
importance of aligning incentives between principal and agent and that it is in pension
schemes’ long-term interests to improve performance, allowing both schemes and
members to reap net benefits from the VFM framework.
Table 9: The annual direct benefits to schemes (of higher charge revenue as
performance improves) are estimated to supersede annual direct ongoing costs to
schemes by the penultimate year of the appraisal period
(£m,
constant
prices)
2026 2027 2028 2029 2030 2031 2032 2033 2034
Direct
ongoing
costs to
schemes
(£m)
£66 £59 £52 £46 £41 £36 £38 £28 £25
Direct
charge
£0 £0 £0 £0 £4 £12 £24 £38 £53
109.
Error! Unknown documentproperty name.
109
revenue
benefits to
schemes
(£m)
Reduced Costs to members
128. As in the ‘costs to members’ point, any direct impact on costs due to potentially offsetting
factors of fee-reducing (such as consolidation, market developing scale) versus fee-
increasing (such as pursuing more diverse investments) impacts are not monetised. In
addition, as previously outlined, the UK currently has very low pension fees that already
operate significantly below the 0.75% charge cap. It is therefore reasonable to expect there
may be no further reductions in charges and the main policy benefit for members will come
through higher returns as the market focus is shifted away from low cost and onto value.
Benefits to Employers
129. Benefits may accrue to employers through the VFM framework’s impact on the switching
of pension schemes and by facilitating comparisons.
o Current evidence finds very low instances of employers actively considering their DC
pension scheme and switching to a better performing one – only 5% of employers
offering a DC pension had done so157
.
o The transparency and availability of information regarding pension schemes as a result
of the VFM framework will increase competition across DC and may increase the rate
(or threat) of employer switching as they become notified that they are enrolling their
employees into a poor-performing, low value scheme. This could further deliver
improvements on investment (and wider services) to members.
o Currently, cost and convenience of scheme dominate employer decision-making. The
transparent and potentially high profile nature of the VFM framework may help decision-
making for employers place a greater weight towards VFM assessments, further
increasing switching rates.
o Switching, or threatening to switch, could mean employers find a better deal on charges
and/or are able to give greater benefits to employees as a result of doing so, such as
higher contributions.
o The increase in transparency of information should make finding comparisons across
schemes much easier, saving search times/costs for employers.
130. However, given the absence of available evidence to assess this and it being highly
dependent on behaviour change, this is not monetised.
Services
131. The VFM framework aims to improve services offered by pension schemes, especially in
the longer term, by encouraging greater engagement with savers. If the VFM framework
increases the rate of consolidation then schemes may increase their service provision to
provide better VFM for their members.
132. For the VFM framework service outcomes will be measured by a series of metrics aiming
to measure how schemes offer value against five outcomes:
▪ Savers can be confident that transactions are secure, prompt, and accurate.
▪ Savers are satisfied with the service they receive.
157
https://assets.publishing.service.gov.uk/media/6501971439d9f1000d3d3a37/dwp-employer-survey-2022-report.pdf
110.
Error! Unknown documentproperty name.
110
▪ Savers are supported to make plans and decisions as they near retirement158
.
▪ Savers can amend their pension with ease.
▪ Savers are supported to engage with their pension.
133. These metrics were developed working with industry, through consultation and working
groups, using the valuable feedback provided on how these metrics matter to saver
outcomes. Each of the five outcomes are important to savers, through ensuring that their
pension can be transferred securely and promptly when needed, that savers are satisfied
when dealing with their scheme, that savers are supported to make informed decisions when
planning for their retirement, that information about their pension is easy to access, engage
with, and make changes to where appropriate.
134. VFM assessments and reports should ensure schemes pay greater attention to their
service quality as each of services, investments, and costs will receive equal weighting in the
assessment process with data on each of these metrics behind centrally available and
accessible via a URL hosting.
Engagement
135. Greater transparency and improved governance may help increase engagement and
consumer value understanding of both already and newly engaged savers. This may, in turn,
help reduce the risk of being invested in poor VFM or underperforming schemes. The policy
goal of fewer, larger, and better-performing schemes (where in the members best interest)
will also mean an improvement in scheme governance and scheme service quality which
should help improve service design and delivery for scheme members, in addition to the
experience of engaged savers through the availability of better-quality pension information.
136. In the longer term, it is envisaged the VFM framework being increasingly member-
focussed such that VFM results will feature on pensions dashboards. The policy intent to
become more member-focussed over time could further increase engagement by being
easily accessible at one point of contact together with all other private and state pension
information.
Risks and assumptions
137. Key risks and assumptions have been covered throughout the IA. The main areas of risk
are listed and RAG-rated below (Red = significant analytical/policy risk or significant driver of
IA modelling ; Green = low impact risk or assumption and/or unlikely to significantly impact
IA modelling):
Analytical risks/assumptions:
• Investment Returns (Red): A 0.4ppt improvement in performance is the key driver of
benefit monetisation. Multiple sources verify this estimate (current and past UK industry
performance ranges, impacts from the equivalent policy impact in Australia) and show
clear evidence of underperformance in the DC market. While investment returns are
uncertain and market-dependent, Australia's performance test framework suggests this
should help remove or improve low-returning schemes, suggesting a performance uplift
around this magnitude is a reasonable assumption. Sensitivity analysis confirms
significant net benefits remain robust to different levels of investment returns impact, for
example if the market-wide performance uplift were lower.
• Data and data assumptions (Amber): Industry costs in this Impact Assessment are
extrapolated from a representative FCA-led survey of contract-based providers. Due to
evidence gaps, it is assumed these costs are similar to those faced by Trust-based
schemes. Many schemes operate in both markets with similar structures and business
158
As outlined in, https://www.fca.org.uk/publication/consultation/cp24-16.pdf , “we may in the future extend the Framework,
for example to decumulation. The proposed inclusion of a decumulation-related metric here does not imply we consider it
appropriate for a Framework extended to decumulation. A different set of metrics would need to be considered and consulted
on.”
111.
Error! Unknown documentproperty name.
111
models, making this a reasonable assumption. This data, directly from schemes, gives
added confidence in the cost estimates, which will be further refined at the secondary
legislation stage as the policy is finalised.
• Pessimism Bias (Amber): There is a risk that schemes have overestimated their costs
due to uncertainty about final policy details or a desire to reduce regulatory burdens.
Consequently, cost estimations may be higher than what schemes will actually face. Each
of these two ‘Amber’ risks are tackled using cost sensitivity analysis in Annex D.
Policy risks/assumptions:
• Herding (Red): In Australia's DC market, a similar Value for Money (Performance Test)
framework led to 'herding,' where schemes invest in similar, safer assets to be guarantee
being assessed as "performing." This reduces innovation and dynamism, potentially
dragging high-performing schemes closer to average levels and creating systemic risks
as investments gather in similar assets. Herding would cluster performance around
average levels; while this may uplift low performers, if it stifles otherwise high performing
schemes, then this would reduce the net benefits on offer from VFM.
To mitigate this, VFM policy development has learned from engagement with Australian
counterparts. VFM currently includes no benchmark index against which schemes are
assessed and a 'forward-looking metric' is also in development so schemes can
demonstrate expected future performance from recent strategy changes and
innovations, rather than the VFM assessment being purely backwards-looking. Schemes
can also contextualise their investment strategy and present risk-based metrics, further
promoting and protecting innovation and risk-taking. Each of these should mitigate a
material risk of market herding but this remains a red risk given its potential impact.
• Self-assessment does not work (Amber/Green): Asking schemes to assess their own
performance may lead to self-interest and underperformance not always being captured.
However, strong regulatory powers and close monitoring of data/assessments should
minimise this risk. As VFM data becomes live and accessible, defined benchmark
performance criteria are expected to be introduced to reduce the subjectivity in
assessments, mitigating this as a long-term policy risk. Any introduction of benchmarking
would be applied to avoid herding as much as possible, having spoken to and learned
from Australian policymakers (as above).
• Final policy details (Green): The full impacts of VFM are uncertain as policy details are
yet to be finalised. The FCA’s August 2024 Consultation Paper gathered feedback to
refine the policy framework and its metrics. Any changes are unlikely to alter the
overarching agreed policy objectives or the potential benefits for a better-performing DC
market. Full policy details will be specified at the secondary legislation stage to maintain
flexibility.
SaMBA (small and micro business assessment)
138. This SaMBA is laid out as follows: context, exemptions, proportionality and mitigations.
This helps to best understand the impact on small and micro businesses in relation to the
VFM policy proposals.
Context
139. The VFM framework is focused on pension schemes (rather than on wider businesses
and employers). The costs of the framework accrue to pension schemes, while benefits
largely go to individual savers within these schemes. Pension schemes differ from many
businesses as they may hold significant assets but not necessarily employ many people.
Policy development has considered the impact on small and micro pension schemes
throughout.
112.
Error! Unknown documentproperty name.
112
140. To be consistent with the Pensions Dashboard Impact Assessment159
, and with other
Pensions Scheme Bill Measures, Small and Micro businesses are defined as DC
schemes with fewer than 1,000 members, though this definition isn't perfect as scheme
size and employer size don't always correlate. Importantly, trust-based schemes can be set
up by both smaller and larger employers, with a trend of smaller employers using Master
Trusts for workplace pensions to minimise costs and improve governance.
Exemptions
141. Micro schemes, those with fewer than 12 members, are proposed to be exempt from the
VFM framework due to their operational differences and existing requirements (which
already differ to non-micro schemes). This exemption aims to reduce burden on these
schemes and is based on proportionality grounds.
142. Further exemptions, on proportionality grounds, have been applied within schemes. For
example, VFM assessments will be required to be completed for all default arrangements
that a pension scheme has (a scheme can have more than one arrangement and it is
important each of these provide value). However, policy design has exempted smaller
default arrangements with fewer than 1,000 members in them where this is not the schemes’
main arrangement. This exemption is on proportionality grounds given the cost evidence of
VFM compliance and is consistent with the SAMBA definition (fewer than 1,000 members)
adopted in this and other Pension Schemes Bill impact assessments. This ensures the vast
majority (over 80%) of members in pension schemes’ main default arrangements are
captured by the policy objectives of the VFM framework102102
.
Proportionality
143. Small schemes, defined as having between 12 and 999 members, are in-scope of
the VFM requirements. This is because:
• Around 71% of non-micro pension schemes are ‘small schemes’ with fewer
than 1,000 members. Given their significant presence in the market, it is
proportionate to include these small schemes in the VFM requirements to ensure
they are providing value to the members within these schemes and deliver
consistency across the market.
• As detailed below, small schemes were found to have lower one-off and
ongoing costs of complying with the policy framework compared to larger
schemes. This is because they are often less complicated products with fewer
default arrangements than larger schemes. Therefore, it is unlikely that small
schemes should face disproportionate cost compliance burdens from the policy.
• It is important that members within these smaller schemes receive value for
money on their pensions savings. The VFM framework aims to identify
underperforming schemes and drive up performance levels across all scheme
sizes. As detailed in Table 11 below, large benefits exist for members in these
smaller schemes. More widely, small schemes themselves can benefit from
inclusion in the VFM framework by learning from best practice, competition and
improved performance levels generating higher charge revenue for them. Indirect
benefits available to small schemes and businesses from the VFM requirement
(reduced search costs, improved transparency, better functioning market) further
justifies their inclusion within the legislation.
Understanding the cost and benefit impacts to small schemes
144. The same monetisation method as in the main Impact Assessment has been applied to
understand the impact on small schemes.
145. Small schemes have an estimated £80,000 one-off costs, leading to an estimated
£60m in SAMBA one-off costs (£80,000 multiplied by the 700 estimated number of small
159
Pensions Dashboards Impact Assessment https://www.legislation.gov.uk/ukia/2022/81/pdfs/ukia_20220081_en.pdf
113.
Error! Unknown documentproperty name.
113
schemes by 2025). This is a lower per scheme cost than was found for larger schemes in
the main body (Table 3).
146. Small schemes accounting for 71% of the total number of schemes in the market is
maintained over the modelled appraisal period as market consolidation is occurring at all
scheme sizes. While VFM/other Bill measures may lead to different consolidation rates by
scheme size, the extent of this cannot be known in advance, so the 71% is maintained.
147. Small schemes that provide value will remain in-scope of the VFM framework over time
and therefore be face ongoing costs of complying with VFM policy proposals. These
ongoing costs are estimated to be around £65,000 per scheme per year.
148. As the DC market is projected to consolidate over the 10-year appraisal period, total
ongoing costs for small schemes are projected to decline as fewer remain in the market
(rounded to the nearest 10). Ongoing SAMBA costs are projected to fall from £40m to under
£20m over the appraisal period (constant prices).
Table 10: SaMBA – ongoing costs:
Year Total schemes estimated
to be in scope
…of which
small
Estimated costs to
small schemes (£m,
constant prices)
2026 880 620 40
2027 780 550 40
2028 690 490 30
2029 620 440 30
2030 550 390 30
2031 490 350 20
2032 440 310 20
2033 390 280 20
2034 350 250 20
149. The inclusion of smaller schemes in the policy can be expected to benefit them as
best practice is shared across the market and overall performance is driven up at all
scheme sizes, benefiting members.
150. Smaller schemes (defined those with fewer than 999 members) accounted for 1.2% of
DC trust market assets in 2024160
. This had fallen from 8% of assets in 2018 as trust-based
assets have become more concentrated in larger, Master Trust schemes.
• Assuming that the proportion of DC assets held by smaller schemes falls to 1% (as
future paces of consolidation at different scheme sizes are not known and there
may be some diminishing of consolidation at the smallest scheme sizes), the same
benefit monetisation can be carried out as in the main body.
• This is presented in Table 11 below where the ‘Assets in small schemes’ market
grows by 0.4ppts per year faster than it does in the counterfactual scenario where
these smaller schemes do not improve their performance (the same performance
uplift as explored in the main body as improvement should occur across all scheme
sizes).
• Over the 10-year appraisal, this means there is £320m (£240m NPV)
additional money in these schemes compared to the counterfactual where
performance does not improve (sum of ‘VFM Benefit to members’ line).
• The vast majority of these benefits are direct benefits for members (not to
small schemes directly, but members in these schemes) as they are the ultimate
160
https://www.thepensionsregulator.gov.uk/en/document-library/research-and-analysis/occupational-defined-contribution-
landscape-2023#4eeb8459a6f04b9e9aa502cd925009e7
114.
Error! Unknown documentproperty name.
114
asset owner. However, smaller schemes will also see increased charge revenue
on these improved returns, estimated at around £1m over the appraisal period
(sum of VFM benefit to small schemes’ line).
• This SAMBA has used the RPC/DBT Impact Assessment calculators to assess a
SAMBA-specific EANDCB in Table 12. This shows a £31m equivalent annual net
direct cost to [small] businesses. Importantly, as with the wider impact assessment,
it is the members within these small schemes who benefit most from the VFM
framework, justifying the inclusion of small schemes within the framework.
Table 11: SAMBA - Benefits of improved returns to smaller schemes sees assets grow
faster with VFM compared to the counterfactual where returns do not improve from
current levels
(£mn, constant
prices)
2028 2029 2030 2031 2032 2033 2034 Total
Benefit
VFM: Assets in
small schemes
£6,500 £6,800 £7,200 £7,500 £7,800 £8,200 £8,500
Counterfactual:
Assets in small
schemes
£6,500 £6,800 £7,100 £7,400 £7,800 £8,100 £8,400
VFM Direct
benefit to
members in
small schemes
(£mn)
£- £- £- £- £100 £100 £100 £320m
benefit
to
members
in small
schemes
VFM Direct
Benefit to
small schemes
(£mn)
£- £- £- £- £- £- £1 £1m
benefit
to small
schemes
Table 12: SAMBA EANDCB – direct costs and benefits to small businesses
Impact Overview Cost/Benefit to small
businesses (2024 prices
summed over appraisal
period)
One-off costs Small schemes familiarise
with legislation and
implement systems
£70m
Ongoing costs Small schemes comply with
the annual VFM
requirements
£240m
Total direct costs to small business are £310m (£31m per year)
Higher charge revenue Small schemes see higher
charge revenue from
improved returns on
member pots.
£1m
Total direct benefits to small businesses are £1m (£0.1m per year)
EANDCB to small schemes = £30m cost per year (2024 prices)
151. The measures can also be expected to support small and micro businesses indirectly
through the availability of information, helping reduce search costs. For example, the
115.
Error! Unknown documentproperty name.
115
measure represents a £31m annual cost (in EANDCB terms) for small/micro pension
schemes. However, this delivers a benefit to all members of small schemes as well as to
small and micro businesses across the economy through providing more consistent and
timely information on the pension market. This creates benefits for employers when selecting
or switching pension schemes. These benefits are not captured but could be significant;
therefore, making the measures proportionate.
Mitigations
152. Given the policy detail and cost estimates received from schemes, it is not believed that
smaller schemes should face disproportionate costs as a result of the VFM framework and
they (and their members) should still stand to benefit from the policy. Nevertheless, several
mitigations have been put in place to ensure that both small and micro pension schemes are
considered appropriately in the policy development process:
153. DWP has worked closely with industry to balance the framework's requirements with the
additional burdens it may generate. Industry feedback indicates that pension schemes,
including small schemes, will be able to comply with the VFM data metric requirements
without undue burden. Smaller schemes are also often less complex than larger ones (for
example, with fewer default arrangements and/or less complicated products), making it
easier and more cost-effective for them to comply with the regulations.
154. To further minimise the burden on smaller schemes, the VFM framework will in time
replace elements of other existing regulations, such as the Value for Members assessment
and Disclose and Explain. This means that although the framework may generate additional
costs, these should be partially offset by reductions in costs and regulatory requirements
elsewhere.
155. The VFM framework aims to help smaller schemes understand their value more
transparently. This transparency allows them to assess whether consolidating into a
GPP/Master Trust would be more cost-effective than running their own scheme in the
medium term. Currently, this information is either unavailable or not in a standardised format
for employers to make accurate assessments
156. The policy has also been adapted to exempt micro pension schemes from the
requirements on proportionality grounds and in line with standard policy practice, given their
operational differences and existing requirements. However, it is also appropriate for
members to benefit from the inclusion of smaller pension schemes. Where smaller schemes
may be underperforming (and there is a strong link between size of pension scheme and
costs/charges and governance), it is appropriate for VFM to capture any underperforming
smaller schemes to drive improved performance.
157. Smaller schemes could choose to consolidate their pension scheme into a Master Trust,
avoiding the cost, if they deemed this to be of greater value. This would reduce the cost on
smaller schemes.
158. Overall, given their significance in the market, the evidence on cost burdens and the
importance to deliver consistency across the DC pensions market, it is proportionate that
small schemes be included in the VFM framework requirements. This ensures that members
at all scheme sizes benefit from receiving better value on their pension savings and that
small schemes benefit from the promotion of transparency, knowledge sharing and
competition that the VFM framework seeks to engender.
Wider impacts
159. The VFM framework is expected to have a material difference on the DC workplace
pension market and expected to support the wider Government’s aims to support economic
growth and investment in the UK. These impacts are discussed in more detail below.
Better investments, higher growth and deeper markets.
116.
Error! Unknown documentproperty name.
116
160. By promoting a greater focus on investment classes and investment performance, savers
may benefit through improved returns. A greater focus on investment returns may lead to a
wider set of asset classes being sought after by pension funds, including infrastructure and
other private market investments. As a result, capital markets and private companies may
benefit through larger pools of capital becoming available. Although these investments could
be global, schemes will also need to disclose their asset allocations by geography. This may
nudge schemes to increase scheme allocations to UK markets. This could further help UK
capital markets see greater liquidity, help UK start-up companies receive UK-based risk
financing and see pension funds becoming key owners of critical infrastructures and assets.
Consolidation
161. The DC Trust market has been consolidating over time with the number of schemes
falling by around 10% each year since 2012161
. This has resulted in a fall from around 3,660
schemes in 2012 to 920 in 2025. Over the same period, the assets held, driven by the rollout
of Automatic Enrolment, has been rapidly rising (a nominal increase of more than 825%
since 2012 to £205bn). VFM will help contribute to consolidation in the DC pensions market
as it will give the Pensions Regulator new powers to wind up schemes which are not taking
adequate steps to achieve value for money – a measure which should accelerate
consolidation. This has been notable in Australia which has continued to see consolidation
into a small number of pension schemes.
162. There are a number of ways in which consolidation in the pension market could have
wider impacts and benefits. Evidence shows:
• Governance: There is a positive relationship between size and governance, such as
research by TPR showing larger pension schemes are more likely to meet key
governance requirements162
. DWP analysis has shown that an average earner could
have £3,000 more in their pension pot as a result of moving into a large master trust
scheme due to lower costs163
.
• Charges: DWP research has shown the larger the pension scheme the lower the
charges, on average164
. This is further supported by PPI analysis showing lower expense
ratios in Master Trusts (compared with single employer trusts) due to economies of
scale165
.
• Investment opportunities: There is some evidence better value, larger schemes may
increase their investment in productive assets given they will have more expertise and
can afford the higher fees compared to smaller schemes or negotiate better terms. This
can lead to more investment in productive finance166
.
Cultural shifts
163. Cultural shifts in the workplace DC pension market may arise as a result of publishing
and highlighting a more holistic approach around pension saving. This is aimed to
encourage employers and industry to move away from a pure cost-driven approach and
instead place a greater focus on investment returns (which make a greater difference to
member outcomes) and overall value for money being delivered. As a result, there may be
161
https://webarchive.nationalarchives.gov.uk/ukgwa/20250115145526/https://www.thepensionsregulator.gov.uk/en/document-
library/research-and-analysis/occupational-defined-contribution-landscape-2023
162
https://webarchive.nationalarchives.gov.uk/ukgwa/20200102111009mp_/https:/www.thepensionsregulator.gov.uk/-
/media/thepensionsregulator/files/import/pdf/dc-research-summary-report-2019.ashx; and
Defined Contribution trust-based pension schemes research 2022
163
https://www.gov.uk/government/publications/trends-in-the-defined-contribution-trust-based-pensions-market/trends-in-the-
defined-contribution-trust-based-pensions-market#fnref:27
164
https://www.gov.uk/government/publications/pension-charges-survey-2020-charges-in-defined-contribution-pension-
schemes/pension-charges-survey-2020-charges-in-defined-contribution-pension-schemes
165
https://www.pensionspolicyinstitute.org.uk/media/xfybvxtq/20230926-the-dc-future-book-9-2023.pdf
166
https://www.plsa.co.uk/Policy-and-Research/Document-library/PLSA-policy-position-on-pensions-and-growth-October-2023
117.
Error! Unknown documentproperty name.
117
greater competition amongst DC schemes when looking to secure new employer business to
increasingly revolve around VFM scores over and above just the costs.
164. Additionally, the extra transparency may lead to greater numbers of employers switching
pension scheme recognising the wider VFM benefits they may be able to achieve from
moving. This may also be encouraged by engaged employees who will have more
information to understand how their pension scheme compares.
165. This may also lead to greater diversification of investments made by pension funds.
Currently, a large majority of the DC market invests passively in pooled global listed equity
tracking indexes. A wider effect of the comparative nature of the VFM framework is that it
may promote more innovative, direct and productive investment strategies that could
improve member outcomes (through greater performance and diversification), result in
greater scheme revenues (by how fees are structured) and benefit the UK economy (through
UK companies receiving more domestically sourced risk capital).
Innovation
166. The VFM framework will increase transparency and competition across the market. As a
result of this, best practice can be shared among schemes (for example on asset allocation)
and greater innovation in the market should follow. By driving a focus away from purely cost
and onto overall value, this should allow innovation to be more freely pursued as this may be
costly in the short-run but ultimately improve overall value. The VFM framework has also
been carefully designed to not stifle the pursuit of new, innovative strategies by DC
schemes. For example, investment performance and ‘J-curve’ effects can be contextualised
in VFM reports where innovative strategies may take time to show through in performance
figures.
Economic Growth
167. A DC market competing on value and investing more productively in certain asset classes
(such as infrastructure and other private market investments) may help wider UK economic
growth167
. Improved risk-adjusted returns compound over time which could mean leaving
members with larger pots at retirement to spend in the economy (estimated at just under
£1,300 extra per year in retirement, see Annex C). Better, more diversified investment
strategies can target high-potential growth companies to access domestic risk capital to
scale-up and become key players, employers and contributors to the UK economy and
financial markets. Deeper capital markets, improved returns and a changed focus from cost
to value may help grow the overall size of the economy and can help establish a virtuous
circle that increases the UK’s national investment levels.
Wider impacts - equality impacts with respect to the protected characteristics
168. The characteristics that are protected by the Equality Act 2010 are age, disability, gender
and gender reassignment, ethnicity, marriage or civil partnership, pregnancy and maternity,
religion or belief, sexual orientation. A more complete equality impact assessment is
contained within the overarching Impact Assessment, but VFM impacts are briefly
summarised here.
169. Overall, the department does not consider that the proposals materially impact any of the
groups with protected characteristics under the Equality Act 2010 (in Northern Ireland, the
Equality Act is not enacted but other antidiscrimination legislation applies). However, this will
continue to be considered as final policy details emerge.
170. There is, however, a notable point on religion. The framework (at least initially) only
examines default funds, given the vast majority of savers do not make an active decision on
investment. This means some selected schemes, such as those which are Shariah
167
https://www.gov.uk/government/publications/pension-fund-investment-and-the-uk-economy/pension-fund-investment-and-
the-uk-economy
118.
Error! Unknown documentproperty name.
118
compliant, may not necessarily be assessed in the VFM framework. Sharia compliant
pension schemes are funds governed by the requirements of Shariah law and the principles
of Islam. For example, a Shariah compliant fund will not invest in any company that does not
follow Shariah principles, such as companies in the gambling, weapons and defence, and
tobacco industries. This may lead to differences in investment return as these companies
are filtered out of Shariah portfolios.
171. This means that savers in Shariah compliant funds which are not a default fund will miss
out on the VFM framework. It is possible the VFM framework could be extended to non-
defaults in the future, though it is recognised that there are challenges, as individual saver
needs and objectives vary much more widely and products and arrangements are similarly
varied.
172. For any Shariah compliant funds that are defaults and therefore in scope, when
comparing VFM data metrics to non-Shariah funds, schemes will be able to explain these
wider factors that drive differences in performance. Schemes with investment strategies
consistent with religious requirements can explain this in their assessment should this lead
to differences in performance compared to other arrangements.
Monitoring and Evaluation
173. Given the significant changes the regulations may result in for some schemes, it is
recognised the importance of a strong monitoring and evaluation plan. DWP are committed
to evaluating the VFM framework once it has come into legislation. The first review would be
undertaken within 5 years of implementation, with implementation in this case being defined
as publication of scheme assessments
174. TPR will continue to monitor the performance and regulatory compliance of trust-based
DC pension schemes and the FCA will continue to monitor the performance and regulatory
compliance of contract-based DC pensions schemes. This will be done in a number of ways,
including:
o Analysing the VFM returns which schemes must provide to understand historical data
and help assess the performance of the market. DWP, FCA and TPR are working
together to ensure that these data disclosures can be easily accessed and monitored.
As part of regulators’ supervision of schemes, this will be crucial to understand
compliance, whether self-assessments are working, and the level of detail is sufficient
and transparent enough to support comparisons. This will also be critical in monitoring
and evaluating policy detail (e.g. whether thresholds are set at appropriate levels) and
policy objectives (are members getting better value for money), which DWP are
committed to do. Returns can also help monitor whether policy specific thresholds
remain appropriate or if they require review.
o Monitoring interactions with other Pensions Schemes Bill measures – VFM is a
large policy initiative that will be legislated for as part of the 2025 Pension Schemes Bill.
The Bill has a wide scope of measures with several DC policies that may interact when
in operation and impact the market or on other policy areas (for example on DC
megafunds, guided retirement and small pots). The analysis for these impact
assessments has assumed no cross-policy interactions due to uncertainty however
continual data monitoring and industry engagement will help make clear whether and
how policies are interacting and impacting, and whether specific policy details need to
be amended on the back of that.
o Use existing surveys such as TPR DC Scheme Survey to check understanding and
compliance levels across the DC market.
o Monitoring investment performance across the industry through using key existing
sources, such as Corporate Adviser.
o Potential quantitative surveys and qualitative research with schemes and employers
to understand the impact on their business and members, whether it has encouraged
119.
Error! Unknown documentproperty name.
119
switching in the market, whether it has changed behaviour and how members have
been impacted. For example, DWP regularly asks via the DWP Employer Survey about
pension switching; future questions in this survey could be an option alongside bespoke,
standalone surveys.
o Qualitative research with members to understand their awareness of VFM and any
experiences of being switched pension fund as a result of their scheme failing a VFM
test. This will be important to ensure schemes are appropriately transferring members
and they are being communicated with and receiving greater performance and services
as a result of the change.
o Stakeholder roundtables and engagement to hear feedback from industry and help
adapt the policy as DWP continue to develop the details.
175. This will all be supplemented by continuing to engage with industry, particularly through a
second consultation once further policy detail is finalised. This will aim to minimise the
burden for schemes in scope. DWP do not want to create unnecessary administrative
burdens on schemes which will take resource away from their ability to provide good VFM
for their members. Therefore, DWP are committed to keeping industry communication open
and learn from experience through different phases.
176. Once the regulatory regime has been implemented, any work conducted will form part of
the regulators’ ‘business as usual’. It is expected that the regulators will seek to take a risk-
based and sectoral approach, in addition to scheme level oversight, setting appropriate
internal thresholds to target non-compliance of schemes under the framework. This will
ensure that TPR and FCA are able to maintain an appropriate level of regulation across its
other ongoing duties as well as upon the newly established VFM framework.
177. Discussions across TPC, FCA and DWP continue on the involvement in the processing of
data metrics and VFM assessment publications, as well as ensuring automated penalty fines
are issued for non-compliance. This is not an exhaustive list however are initial
considerations which would include: Customer Services, Front Line Support, Regulatory
Transactions, Relationship Supervision (Master Trusts) and Frontline MI and Analysis.
178. Where VFM assessments are submitted and meet internal risk criteria, it is expected a
form of internal escalation will begin to investigate and, if necessary, escalated onto an
enforcement journey. Due to the nature of the various forms of investigative and
enforcement action that TPR takes, an additional layer of risk appetite will likely be required
to assess the identified concerns and determine if there is justification to utilise internal
resource to address those concerns at this time. Assessing cases in this manner ensures
that we prioritise the more serious breaches and instances where we can have the most
impact and reduce more harm.
Annex A: Alternative ways of modelling VFM return benefits
The proposed modelling approach set out in the ‘benefits’ section made use of clear, data-
backed assumptions to model what a DC market could look like in the future through the
benefits of higher average investment returns. This took the latest, and best available,
evidence from the largest UK DC schemes and from the Australian DC market to decide
what a plausible scale of return improvement might look like through the removal or
improvement of poor performing schemes.
To validate the IA findings of £26bn cumulative benefits over the 10-year appraisal period,
an alternative “bottom-up” approach is used to confirm the magnitude of the potential
benefits. This approach takes the average DC pot size in 2024 and the current total number
of DC pots in the market. These are £5,800 and 28.8m respectively:
i. Multiplying these two numbers together gives an indicative DC trust-based market size
of £168bn.
120.
Error! Unknown documentproperty name.
120
ii. Assuming the average DC pot (£5,800) grows by current weighted average net
investment return levels calculated in the benefits section (7.2%) for 5 years and
compare this to an average pot of the same size that grew by 7.6% as a result of VFM.
iii. This results in an average pot over £100 larger after 5 years in the VFM scenario.
iv. Multiplying this improvement by the projected number of DC pots in 2025 (based on
past growth rates of 11% per year) would result in £5bn worth of VFM benefits over the
modelled period.
To compare the methodologies like-with-like, the current pot number and value is
uprated using historical growth levels (increasing average pot size by 8% and total
memberships by 11% based on their 5-year growth rates168
). This results in an average
DC pot of £12,800 in 2034 and 85m pots.
v. Assuming the £12,800 earns 7.2% investment returns for 5 years, this would result in
£16,800 worth of investment returns compounded over 5 years. With 7.6% returns,
investment returns would be £17,100, over £300 higher.
vi. The impact of this extra £300 return spread across the projected number of pots would
be £26.8bn. This is close to the main estimate of £26bn in the main body of the Impact
Assessment (this estimate is slightly higher by not making allowances for assets in
decumulation or in the de-risking stage).
This highlights a bottom-up approach and top-down approach both estimate similar level of
overall benefits.
Annex B: Sensitivity analysis around the extent of improved investment
performance
The investment returns assumptions are highly uncertain and makes a significant impact to
the result. Although based on a wide-range of evidence, further work has been undertaken
168
https://webarchive.nationalarchives.gov.uk/ukgwa/20250115145526/https://www.thepensionsregulator.gov.uk/en/document-
library/research-and-analysis/occupational-defined-contribution-landscape-2023
121.
Error! Unknown documentproperty name.
121
to explore the sensitivity around this. For example, using the last 5 years’ worth of CAPA
data on 5-year annualised investment returns for younger savers allows comparison across
the largest pension schemes. The biggest underperformers (defined as being 2 percentage
points below average) are then removed from the calculation to model improved DC market
performance as a result of poor performing schemes exiting the market (or improving their
offer to match the wider market). This is the ‘post VFM’ average presented in Figure 10
below.
This approach yields an average uplift to investment returns of 0.4 percentage points. This is
an effect size consistent with evidence from Australia therefore appears a reasonable
estimate upon which to model potential VFM benefits across the UK DC market.
However, variation remains and the final impacts of the policy cannot be known in advance:
▪ In a low VFM impact scenario, average returns improve only by 0.13ppts (as
occurred in 2018)
▪ In a high VFM scenario average returns improve by 0.59ppts (as occurred in 2021).
Both low and high scenarios may be equally likely. If the market was to “herd” to avoid
downside risks, this may stifle high performers and lower overall market returns. Equally,
there may be innovation with schemes learning from improved transparency and greater
competition for employers based on investment returns, leading to greater market
performance.
Figure 10: The increase in 5-year annualised investment returns for younger savers
before and after the removal of underperforming schemes
In a low VFM impact scenario – where returns improve by just 0.13ppts over a 4-year
period – total cash benefits sum to £8bn over the appraisal period (2025-2034). This is
roughly one-third of the central estimate and still represents a large benefit against the
estimated policy costs. A low VFM impact might arise due to performance herding, gaming
or wider factors such as poor overall market returns. Importantly, schemes would still gain
additional charge revenue on these higher returns.
This extra charge revenue to schemes would amount to £40m over the appraisal period
(assuming 0.5% charges are paid on these £8bn additional returns).
0.0
2.0
4.0
6.0
8.0
10.0
12.0
2018 2019 2020 2021 2022 2023
Average Post VFM Average
+0.13ppts +0.51ppts
+0.53ppts
+0.59ppts
+0.20ppts
+0.48ppts
5-year annualised
returns (%)
Source: CAPAdata, 5-year
annualised younger saver returns
122.
Error! Unknown documentproperty name.
122
Figure 11: Sensitivity Analysis – a low VFM impact scenario presents £8bn worth of
potential benefits (constant prices)
In a high VFM impact scenario – where returns improve by 0.59 ppts over a 4-year period
– total cash benefits sum to £39bn over the appraisal period (2025-2034). This is
roughly 50% larger than the central estimate due to higher modelled returns. Such a high
impact might arise if the policy generates broad-based improvements in market
performance, further incentivising innovation and improvements even among schemes
already found to be delivering value. Importantly, schemes would still gain additional charge
revenue on these higher returns.
This extra charge revenue to schemes would amount to £193m over the appraisal
period (assuming 0.5% charges are paid on these £39bn additional returns).
Figure 12: Sensitivity Analysis – a high VFM impact scenario presents £39bn worth of
potential benefits (constant prices)
2028 2029 2030 2031 2032 2033 2034
Return (with VFM) 7.2% 7.4% 7.6% 7.8% 7.8% 7.8% 7.8%
Return (Counterfactual) 7.2% 7.2% 7.2% 7.2% 7.2% 7.2% 7.2%
Real VFM Returns 4.9% 4.8% 4.1% 4.2% 4.1% 4.1% 4.1%
Real Counterfactual Returns 4.9% 4.6% 3.7% 3.6% 3.6% 3.5% 3.5%
DC Market (with VFM) £535 £562 £588 £612 £638 £664 £692
DC Market (Counterfactual) £535 £562 £587 £609 £631 £653 £676
VFM impact - - £1 £3 £7 £11 £16
Total of £39bn greater investment returns via VFM
Charge Revenue to Schemes … of which £194m is additional charge revenue to schemes
(0.5%)
In Net Present Value terms (2024 prices; 2025 present value, summed over the appraisal
period) this indicates a sensitivity range of between £7bn - £30bn of VFM benefits delivered
through improved returns, with a central estimate of £20bn. Between £33m-£159m of these
additional returns could be expected to accrue to pension schemes through higher charges.
This shows the potential scale of benefits on offer to both members and pension schemes
through the Value for Money framework; with benefits mostly accruing directly to members
as the ultimate asset owners.
These estimates are significantly higher than the estimated policy costs, even where
sensitivity is presented around these (Annex D).
2028 2029 2030 2031 2032 2033 2034
Nominal Return (with VFM) 7.2% 7.2% 7.3% 7.3% 7.3% 7.3% 7.3%
Nominal Return (Counterfactual) 7.2% 7.2% 7.2% 7.2% 7.2% 7.2% 7.2%
Real VFM Returns 4.9% 4.6% 3.7% 3.7% 3.7% 3.6% 3.6%
Real Counterfactual Returns 4.9% 4.6% 3.7% 3.6% 3.6% 3.5% 3.5%
DC Market (with VFM) £535 £562 £588 £610 £632 £656 £680
DC Market (Counterfactual) £535 £562 £587 £609 £631 £653 £676
VFM impact (£bn) - - £0 £1 £2 £2 £3
Total of £8bn greater investment returns via VFM
Charge Revenue to Schemes … … of which £40m is additional charge revenue to
schemes (0.5%)
123.
Error! Unknown documentproperty name.
123
Annex C: iPen case studies
A median male earner saving at the AE minimum levels of their working life would see
their DC pot increase by over £17,000 as a result of higher investment performance
(2024 prices).
Using DWP’s iPen case study model, a median male earner saving at the AE minimum
levels over the course of their working life would amass a DC pension pot worth £164,000
using the model’s default values in current earnings terms. Adjusting the returns assumption
in the model by +0.4ppts (consistent with the benefit for member calculations above) would
result in a DC pot worth £181,000 at retirement. This is equivalent to an increase of just
under £1,300 to spend each year in retirement when the difference is converted to March
2025 annuity rates169
.
For a low earning female, a career of saving with improved returns as a result of VFM leads
to a pension pot that is 11% greater at retirement compared to the model’s default values
where returns do not improve. This equates to around an additional £700 in annual
retirement income when annuitized169
.
179. The following key assumptions have been made when calculating these case studies.
The modelling is known to be sensitive to assumptions made about future economic
determinants and the methodology used. The baseline assumptions are:
a) Each individual saves into a defined contribution scheme with an annual
management charge of 0.3% and a contribution charge of 1.8%.
b) Each individual contributes 5% and their employer contributes 3%.
c) Each individual’s fund is invested in 88% equities and 12% bonds with real
fund growth of 4.07% and 2.39% respectively.
d) Each individual retires at State Pension age of 68.
e) The automatic enrolment earnings trigger, lower earnings limit and upper
earnings limit are frozen until 2028 and then increase in line with earnings
over the long-term.
f) Each individual does not opt-out of pension saving.
g) For NMW/NLW earners the individual continues to make pension
contributions whilst working part time, even though their earnings drop below
the £10,000 earnings trigger. This is in line with the AE framework, assuming
they continue to work for the same employer.
169
https://www.hl.co.uk/retirement/annuities/best-buy-rates
£0
£20,000
£40,000
£60,000
£80,000
£100,000
£120,000
£140,000
£160,000
£180,000
£200,000
No VFM With VFM - 0.4ppts improved returns
124.
Error! Unknown documentproperty name.
124
h) Full time employees work 37 hours per week whilst part-time employees work
18.5 hours per week
i) Each individuals’ earnings increase in-line with average earnings growth. The
final pension pot size is reported in 2024/25 earnings using the Average
Weekly Earnings growth deflator.
j) Where earnings have been reported, these are the current (2024/25) values.
For the NLW/NMW earner aged 40 years, earnings in previous years were
decreased in-line with average earnings. This means that income in previous
years may not match the NLW/NMW figure for that year.
k) Earnings in the first-year employment are increased in line with average
earnings growth.
l) The median annual salary for a female working full-time is £31,672 (Source:
ASHE 2024)
m) The median annual salary for a male working full-time is £37,382 (Source:
ASHE 2024)
n) Salaries for individuals on NMW/NLW are calculated by hourly rate x weekly
hours worked x 52. The individual is born in 2002; they start contributing at
age 22, as per AE defaults.
Annex D: Cost Sensitivities
Data on costs is sourced from the FCA’s survey outlined in Paragraph 42 and 79-81. In this
Annex, sensitivity analysis is applied around these estimates given the uncertain/non-final
policy detail at the time of survey, the time lag between cost estimation and policy
implementation, and the potential for survey respondents (pension schemes) to provide
inaccurate cost estimates in order to reduce their policy burden.
For one-off costs, sensitivity analysis is applied by increasing/decreasing ‘implementation’
costs by 50%. This is so that the range and distribution in estimates received by survey
respondents is mostly reflected. ‘Implementation costs’ varied across respondents as some
schemes may already have their internal value for money metrics set up and already be
monitoring the proposed policy metrics, especially given the proposed Value for Money
metrics have been publicised and consulted on numerous times over the last few years.
Other schemes may not have this data monitoring to hand or already implemented and will
therefore need to implement new systems to collect this data and implement it within their
business. Putting sensitivity around this therefore captures the range of survey responses
received and covers the pure ‘additionality’ the proposed Value for Money framework will
impose on scheme costs (e.g. ‘low’ additionality where schemes already have this
data/monitoring and ‘high’ additionality where schemes do not already have this).
The other sources of one-off costs (e.g. familiarisation costs) are not subject to sensitivity
analysis given these displayed more consistency in responses and also aligned with past
consultation response estimates from pension schemes.
In the low scenario, ‘Other’ costs are also reduced by 50% due to the range in responses
received and the potential for pessimism bias in estimates as a) it is expected that many
schemes are already internally reporting on the proposed VFM metrics, potentially reducing
the ‘additionality’ of the regulation and b) respondents include wider regulatory requirements
in this VFM cost estimate.
This means the one-off costs of the VFM framework could reasonably be expected to fall
between £90 million and £151 million depending on the final policy detail and the degree of
new implementation measures required by firms.
(£m) Familiarisation Learning Developing metrics Implementation Other Total
Low £21 £6 £15 £13 £34 £90
125.
Error! Unknown documentproperty name.
125
High £21 £6 £15 £40 £69 £151
Central £21 £6 £15 £26 £69 £138
For ongoing costs, all line-items are increased/decreased by 25% in both low and high
scenarios in order to ensure the broad range in survey estimates are covered. This also
broadly reflects the potential for biases either side of the central scenario (e.g. final policy
detail may push up ongoing costs or pessimism bias may mean ongoing costs are lower as
schemes overestimate costs in surveys to minimise the burden on them).
Ongoing costs are estimated to be lower than one-off costs, and had a tighter range, hence
the smaller sensitivity ranges applied to ensure the broad range in survey estimates are
captured. This would mean ongoing costs begin in a range of £50 million and £83 million,
before falling over time to between £19 million and £31 million as fewer schemes remain in
the market and the framework becomes embedded.
(£m) 2026 2027 2028 2029 2030 2031 2032 2033 2034
Low £50 £44 £39 £34 £30 £27 £24 £21 £19
High £83 £73 £65 £57 £51 £45 £40 £35 £31
Central £66 £59 £52 £46 £41 £36 £32 £28 £25
Using the above sensitivity analysis around costs and benefits, a low, best estimate and high
scenario can be modelled in Net Present Social Value terms. This shows that, even in a low
scenario (where investment returns do not improve as much as is centrally expected and
cost burdens are higher), the policy can still be expected to deliver large net social benefits
to pension savers (£6bn).
£mn Low
NPSV
Best
Estimate
NPSV
High
NPSV
Value for Money £6,014 £19,364 £29,669
126.
Error! Unknown documentproperty name.
126
Title: Small Pension Pots
IA No:
RPC Reference No: RPC-DWP-25032-IA(1)
Lead department or agency: Department for Work and Pensions
Other departments or agencies:
ImpactAssessment(IA)
Date: May 2025
Stage: Final
Source of intervention: Domestic
Type of measure: Primary legislation
Contact for enquiries: George Bentley
Summary: Intervention and Options RPCOpinion:Green(fitforpurpose)
Cost of Preferred Option (in 2024 prices1
)
Total Net Present
Social Value
Business Net Present
Value
Net cost to business per year
Business Impact Target Status
£1,245m £551m -£64m
What is the problem under consideration? Why is government action or intervention necessary?
The introduction of Automatic Enrolment (AE) transformed the landscape of private pensions savings across the UK by
bringing millions more individuals into private pensions saving. As an employee moves between spells of employment,
employers will enrol them into a pension scheme (if AE eligible) which can often result in a new pension pot with a
different pension provider being created. This can result in a member accumulating several pension pots including
pension pots of small value. These pots are inefficient for the market, bad for both savers (as charges may erode the
value and increase the risks of pots getting lost and/or reduce consumer buying power at retirement) and the pensions
industry (as they are often loss-making). The proliferation of small pots is a clear example of numerous market failures
across the pensions industry: asymmetric information results in schemes accepting short-term savers that leave a
loss-making pension pot, and members’ imperfect information and overall inertia around pensions saving is often the
catalyst for the creation of a small pot and lack of member-led consolidation of pots. Co-operation over a number of
years with the pensions industry has identified that government is best placed to build a consistent industry-wide
solution, with industry requesting the legislative intervention of government to drive forward a solution.
What are the policy objectives of the action or intervention and the intended effects?
To significantly reduce the number of small pension pots (initially those under £1,000) across the industry, with the
objectives of; Improving member outcomes through reducing the likelihood of small pots being lost and potentially
seeing lower charges for members. Reducing the administrative burden on schemes, with small pots currently
resulting in large monetary losses across the pensions industry. Helping to improve retirement outcomes and
support member engagement with pension savings and decision-making at retirement through having a lower number
of pension pots to manage in decumulation.
What policy options have been considered, including any alternatives to regulation? Please justify preferred
option (further details in Evidence Base)
Option 0 – Do Nothing – Without Government intervention, the number of small pots would continue to rise,
exacerbating inefficiencies across the pensions industry and resulting in poorer outcomes for members.
Option 1 – Default Consolidator(s) Model (the preferred option) – Government will legislate for the creation of an
automated consolidation solution to match deferred pots to a member’s chosen or allocated consolidator pot. This
approach would be underpinned by a central mechanism to facilitate the automatic consolidation of small pots.
Option 2 – Pot follows Member – Government would legislate to enable members’ deferred small pots to be
transferred into their new and active workplace pension pot. When an individual is automatically enrolled in a DC scheme
by an employer, the scheme would check whether the member already has an existing eligible pot. If so, this existing
deferred pot would be transferred to the new scheme.
Option 3 –Alternative to legislation - Member Exchange – The Government could support an industry initiative to
exchange pension pots between schemes on a rolling basis.
Will the policy be reviewed? It will be reviewed. If applicable, set review date: May 2030
Is this measure likely to impact on international trade/investment? No
Are any of these organisations in scope? Micro: No Small: Yes Medium: Yes Large: Yes
What is the CO2 equivalent change in greenhouse gas emissions? Traded: N/A Non-traded: N/A
I have read the Impact Assessment and I am satisfied that, given the available evidence, it represents a
reasonable view of the likely costs, benefits and impact of the leading options.
Signed by the responsible Minister: Date:
1
All costs and benefits are given for a ten-year appraisal period in 2024 prices and use 2028 as the base year for the present value calculation, as in
the RPC/DBT Impact Assessment Calculator. 2024 prices are shown because this is when the Department considered the policy evidence. 2028 is
the present value base year as this is when the policy measures are expected to be implemented or begin to impact the market
127.
Error! Unknown documentproperty name.
127
Summary: Analysis & Evidence Policy Option 0
Description: Do Nothing
FULL ECONOMIC ASSESSMENT
Price Base
Year 2024
PV Base
Year 2028
Time Period
Years 10
Net Benefit (Present Value (PV)) (£m)
Low: High: Best Estimate:
COSTS (£m) Total Transition
(Constant Price) Years
Average Annual
(excl. Transition) (Constant Price)
Total Cost
(Present Value)
Low
High
Best Estimate
Description and scale of key monetised costs by ‘main affected groups’
N/A
Other key non-monetised costs by ‘main affected groups’
It is assumed that no industry wide consolidation solution would be introduced and adopted by industry due to the large-
scale nature of the small pots problem and previous attempts by industry ultimately requiring legislation or government
intervention if they were to succeed.
Under this assumption it is expected that the long-term costs to both schemes and members would persist as the
number of deferred small pots continues to grow within the Defined Contribution (DC) market.
BENEFITS (£m) Total Transition
(Constant Price) Years
Average Annual
(excl. Transition) (Constant Price)
Total Benefit
(Present Value)
Low
High
Best Estimate
Description and scale of key monetised benefits by ‘main affected groups’
N/A
Other key non-monetised benefits by ‘main affected groups’
N/A
Key assumptions/sensitivities/risks Discount rate (%)
Assumes that the pensions industry would not themselves invest in an industry wide mechanism to enable industry wide
consolidation of small pots for members with deferred pots below £1,000 (or a differing pot limit), with instead a
continued focus on member-led consolidation.
BUSINESS ASSESSMENT (Option 0)
Direct impact on business (Equivalent Annual) £m: Score for Business Impact Target (qualifying
provisions only) £m:
Costs: Benefits: Net:
128.
Error! Unknown documentproperty name.
128
Summary: Analysis & Evidence Policy Option 1
Description: Default Consolidator(s) (the preferred option)
FULL ECONOMIC ASSESSMENT
Price Base
Year 2024
PV Base
Year 2028
Time Period
Years 10
Net Benefit (Present Value (PV)) (£m)
Low: 599.9 High: 1,936.5 Best Estimate: 1,245.3
COSTS (£m) Total Transition
(Constant Price) Years
Average Annual
(excl. Transition) (Constant Price)
Total Cost
(Present Value)
Low 108.1
~2
17.8 268.1
High 324.3 25.5 549.3
Best Estimate 216.2 21.5 407.2
Description and scale of key monetised costs by ‘main affected groups’
The main affected group would be pension schemes who would experience both transition and ongoing costs. The
majority of the transition costs estimated to schemes are the implementation costs of a Small Pots Data Platform
(infrastructure implemented as part of wider legislation). International evidence and the costs of the Pensions
Dashboard have been leveraged due to uncertainty over costs. In total the transition costs to schemes are estimated at
£216m over the 2-year transition period (2028-2030). Ongoing costs would be higher in the early years after
implementation, ongoing costs are estimated at £215m over the remaining 8 years of the appraisal period after the initial
2-year transition period.
Other key non-monetised costs by ‘main affected groups’
There could be a potential administrative burden placed upon schemes in relation to the increased transfers and extra
checks required, the impact could be somewhat mitigated through the use of a central mechanism.
Some members may face a slight reduction in value for money after consolidation, depending on the charges and
investment returns of their consolidator scheme in relation to their previous scheme/schemes. The planned VfM
framework should help to mitigate against this and any implications otherwise are expected to be minor.
BENEFITS (£m) Total Transition
(Constant Price) Years
Average Annual
(excl. Transition) (Constant Price)
Total Benefit
(Present Value)
Low 0.0
~2
141.9 1,149.1
High 0.0 274.7 2,204.6
Best Estimate 0.0 205.5 1,652.5
Description and scale of key monetised benefits by ‘main affected groups’
The reduction in small pots will reduce the number of loss-making pots that pension schemes are having to administer.
This is estimated to bring benefits over the 10-year appraisal period of just under £1.2bn to schemes through a reduction
in administration costs. Schemes are expected to pass on some of these costs savings, representing a £806m benefit to
members. Another key benefit to members would be the consumer surplus they experience through the consolidation of
their small pots, using estimates from the commissioned PPLL survey, it is estimated to generate benefits of £81m over
the 10-year appraisal period.
Other key non-monetised benefits by ‘main affected groups’
Improved outcomes for members at retirement as a result of fewer, larger pension pots should help with decumulation
decisions and potentially improve member engagement with pensions.
Pension schemes should benefit from the removal of loss-making pots, helping to stabilise the pensions industry and
consolidator schemes may experience a growth in scale helping to drive economies of scale and improved VfM for
members.
Key assumptions/sensitivities/risks Discount rate (%) 3.5%
The projected number of small pots is based on evidence since the introduction of Automatic Enrolment and provider
supplied data – future growth is highly uncertain and depends on economic conditions, market changes, and consumer
behaviour. The costs of administration and transfers are subjective and have been estimated based on provider
evidence and projected implications of an automated consolidation solution.
BUSINESS ASSESSMENT (Option 2)
Direct impact on business (Equivalent Annual) £m: Score for Business Impact Target (qualifying
provisions only) £m:
Costs: £47 Benefits: £111 Net: -£64
129.
Error! Unknown documentproperty name.
129
Summary: Analysis & Evidence Policy Option 2
Description: Pot Follows Member
FULL ECONOMIC ASSESSMENT
Price Base
Year 2024
PV Base
Year 2028
Time Period
Years 10
Net Benefit (Present Value (PV)) (£m)
Low: 234.0 High: 1,546.2 Best Estimate: 790.6
COSTS (£m) Total Transition
(Constant Price) Years
Average Annual
(excl. Transition) (Constant Price)
Total Cost
(Present Value)
Low 108.1
~2
11.5 208.3
High 324.3 21.4 508.3
Best Estimate 216.2 16.2 356.1
Description and scale of key monetised costs by ‘main affected groups’
The main affected group would be the pension schemes, with data standardisation and Small Pots Data Platform costs
over a 2-year transition period estimated at £216m with the hopeful leverage of the significant data standardisation
already commissioned as part of the ongoing implementation of the Pensions Dashboard.
The transfer of pension pots would represent ongoing costs after implementation for schemes, with these costs
decreasing annually over the first few years after implementation. Over the appraisal period overall transfer costs are
estimated at £162m.
Other key non-monetised costs by ‘main affected groups’
Members would also be one of the main affected groups, with the potential for pots to be moved from well performing
schemes to poor performing schemes that could hamper to some extent the outcome for members at retirement, but this
should be outweighed by the benefits of having one combined pot.
BENEFITS (£m) Total Transition
(Constant Price) Years
Average Annual
(excl. Transition) (Constant Price)
Total Benefit
(Present Value)
Low 0.0
~2
91.8 742.3
High 0.0 218.4 1,754.5
Best Estimate 0.0 142.2 1,146.7
Description and scale of key monetised benefits by ‘main affected groups’
The reduction in the total number of deferred small pots will reduce the number of loss-making pots that pension
schemes are having to administer, this is estimated to bring benefits over the 10-year appraisal period of £963m to
schemes through a reduction in administration costs. Members would be expected to experience some benefit from this
through a reduction in the total admin charges they face, estimated as an additional benefit of £403m to members.
Another key benefit to members would be the consumer surplus they experience through the transfer of their small pots
into their current active pot (this is the positive value that consumers accrue due to the free provision of a service/good
they would have otherwise been willing to pay for). To estimate this, a survey has been commissioned to estimate
“Willingness to Pay” for automatic consolidation of deferred pots, based on this it is estimated to generate benefits of
£56m over the 10-year appraisal period.
Other key non-monetised benefits by ‘main affected groups’
Improved outcomes at retirement for members through the removal of small pension pots that may otherwise have been
eroded through charges over time.
The removal of loss-making small pots should help to support the long-term stability of the pensions industry.
Key assumptions/sensitivities/risks Discount rate (%) 3.5%
Individuals are assumed to move jobs every 3 years, with the movement of jobs being the catalyst for a pot to be
transferred between schemes.
Transfer costs across the 10-year appraisal period are assumed to remain static as the same benefits under a default
consolidator solution in terms of economies of scale would not be expected.
BUSINESS ASSESSMENT (Option 2)
Direct impact on business (Equivalent Annual) £m: Score for Business Impact Target (qualifying
provisions only) £m:
Costs: £41 Benefits: £91 Net: -£50
130.
Error! Unknown documentproperty name.
130
Summary: Analysis & Evidence Policy Option 3
Description: Member Exchange (alternative to legislation)
FULL ECONOMIC ASSESSMENT
Price Base Year
2024
PV Base
Year 2028
Time Period
Years 10
Net Benefit (Present Value (PV)) (£m)
Low: High: Best Estimate:
COSTS (£m) Total Transition
(Constant Price) Years
Average Annual
(excl. Transition) (Constant
Price)
Total Cost
(Present Value)
Low
High
Best Estimate
Description and scale of key monetised costs by ‘main affected groups’
The Department has been unable to quantify an economic assessment of the estimated costs under a member exchange
model due to the uncertainty of how this would operate with a particular focus on it being an industry-led solution. The
potential costs, therefore, are unable to be presented.
Other key non-monetised costs by ‘main affected groups’
Pension schemes and members would be the main affected groups, with only those schemes who took part in such a
solution being affected with this not being an industry wide solution unless adopted by all schemes which would not be
expected as even though schemes would be incentivised to transfer out loss-making small pots, there has been no
industry-wide consensus on the best approach to address the proliferation of small pots. Therefore, under a non-
government legislated option, not all schemes would be expected to partake in one singular solution. Costs to schemes
would be expected to be borne from the initial set up and transfer costs.
BENEFITS (£m) Total Transition
(Constant Price) Years
Average Annual
(excl. Transition) (Constant
Price)
Total Benefit
(Present Value)
Low
High
Best Estimate
Description and scale of key monetised benefits by ‘main affected groups’
The Department has been unable to quantify an economic assessment of the estimated benefits under a member
exchange model due to the uncertainty of how this would operate with a particular focus on it being an industry-led
solution. The potential benefits, therefore, are unable to be presented.
Other key non-monetised benefits by ‘main affected groups’
Members would be expected to benefit by the consolidation of their small pots into one wider pot within one scheme, this
should also benefit those schemes involved who would see the reduction in the number of loss-making pots in exchange
for the potential increase in profitable assets. The benefit to members could be limited and would depend on the value for
money offered by a member’s previous and new pension schemes, there is the potential that some members could face a
reduction in value for money as a result, but the combination of small pots should help to mitigate any detrimental impact
to any members.
Key assumptions/sensitivities/risks Discount
rate (%)
3.5%
The scope of a member exchange solution could be limited depending on the schemes that opted to take part, with the
potential for a large proportion of the stock of small pots not being addressed under this model. Years of industry
engagement and collaboration have not resulted in a viable pilot solution to move forward with a member exchange
solution.
The solution is assumed to be an industry led solution that would only leverage on government support from the
Department without the need for government legislation as the model is proposed as a solution that could provide an
alternative to government legislation.
BUSINESS ASSESSMENT (Option 3)
Direct impact on business (Equivalent Annual) £m: Score for Business Impact Target (qualifying
provisions only) £m:
Costs: Benefits: Net:
131.
Error! Unknown documentproperty name.
131
Problem under consideration and rationale for intervention
Problem under consideration
1. Automatic Enrolment (AE) was first introduced in 2012 and has led to a huge increase in the
number of workplace pension savers, with 88% of AE eligible employees (over 20m) and
80% (22.3m) of all employees in Great Britain participating in a pension in 2023171
. Figure 1
shows the growth in the participation rate of employees within Great Britain.
Figure 1 – Eligible Employee pension participation rates (2009–2023)
Source: DWP estimates derived from the ONS ASHE172
, GB, 2009 to 2023
2. The workplace pensions market is split into three markets:
• Defined Benefit (DB) – This is a type of pension which pays a retirement income
based on earnings, accrual rate, and length of service rather than the amount of
money an individual has contributed to the pensions. Of which, the market is further
split into:
o Public sector DB, where the main funded scheme is the Local Government
Pension Scheme in England and Wales (LGPS) which is made up of 86
Administering Authorities which operate 87 individual funds in 2023/24173
.
o Private sector DB, where there were around 5,000 pension schemes in 2024174
• Defined Contribution (DC) – This is a type of pension whereby pension
contributions are made by employees/employers and are invested to create a
pension pot at retirement. The DC market is further split into:
o Trust-based market – A pension scheme governed by a board of trustees who
have a fiduciary duty towards scheme members. The board of trustees manage
investments on the members’ behalf. This is regulated by the Pensions Regulator
(TPR). In 2025, there were 920 pension schemes with 12 or more members175
.
171
https://www.gov.uk/government/statistics/workplace-pension-participation-and-savings-trends-2009-to-2023/workplace-
pension-participation-and-savings-trends-of-eligible-employees-2009-to-2023
172
https://www.ons.gov.uk/surveys/informationforbusinesses/businesssurveys/annualsurveyofhoursandearningsashe
173
https://www.gov.uk/government/statistics/local-government-pension-scheme-funds-for-england-and-wales-2023-to-
2024/local-government-pension-scheme-funds-for-england-and-wales-2023-to-2024
174
https://www.ppf.co.uk/Purple-Book
175
https://www.thepensionsregulator.gov.uk/en/document-library/research-and-analysis/occupational-defined-contribution-
landscape-2024
0%
10%
20%
30%
40%
50%
60%
70%
80%
90%
100%
2009 2010 2011 2012 2013 2014 2015 2016 2017 2018 2019 2020 2021 2022 2023
Public Sector
Overall
Private Sector
132.
Error! Unknown documentproperty name.
132
o Contract-based market – A pension scheme governed by a provider and an
independent governance committee (IGC) where a contract exists between the
individual scheme member and the provider. This is regulated by the Financial
Conduct Authority (FCA). In 2024, there were estimated to be around 30 firms with
an authorised DC workplace pension business176
.
• Collective Defined Contribution (CDC) – These schemes are an emerging type of
pension scheme based on risk sharing between pension savers. CDCs aim to move
the risk away from the individual (as is the case under Defined Contribution
schemes) and away from the employer (as is the case under Defined Benefit
schemes). The only CDC arrangement in the UK so far is a scheme by the Royal
Mail.
3. The vast majority of AE-eligible employees are saving into a Defined Contribution (DC)
workplace pension177
and this market is the focus of this Impact Assessment given this is
where the policy applies.
4. It is estimated there is around £300bn invested across 5m active savers in the contract-
based market178
, and £200bn invested across 11m active savers in the trust-based
market179
. Data is more readily available on trust side, which has a much greater number of
schemes180
.
5. The DC-trust landscape is growing in scale and maturing quickly with 30.6 million members
in 2025, an increase of 6% since 2024. DC trust workplace pension assets have grown to
£205bn, increasing from only £22 billion in 2012181
.
6. There are three main types of pension schemes in the DC market, detail of memberships
and assets is given in Figure 2:
• Master Trusts – an occupational pension scheme that provides DC pensions for two or
more unconnected employers (though often a lot more).
• Single Employer Trusts (SETs) – pension schemes which are managed for and on
behalf of a single employer or two or more legally connected employers.
• Group Personal Pensions (GPPs) – DC contract-based schemes which are regulated
by the FCA.
Figure 2 – UK’s DC Pensions Landscape
Type Number Assets Active Members
Master Trust182
30 £166bn 10m
Single Employer
Trust183
890 £39bn 1m
GPP184
30 £300bn 5m
176
https://www.fca.org.uk/publications/consultation-papers/cp24-16-value-for-money-framework
177
https://www.gov.uk/government/collections/workplace-pension-participation-and-savings-trends
178
https://www.fca.org.uk/publication/consultation/cp24-16.pdf
179
https://www.thepensionsregulator.gov.uk/en/document-library/research-and-analysis/occupational-defined-contribution-
landscape-2024/occupational-defined-contribution-landscape-2024-annex
180
https://www.gov.uk/government/publications/trends-in-the-defined-contribution-trust-based-pensions-market/trends-in-the-
defined-contribution-trust-based-pensions-market
181
https://www.thepensionsregulator.gov.uk/en/document-library/research-and-analysis/occupational-defined-contribution-
landscape-2024/occupational-defined-contribution-landscape-2024-annex
182
https://www.thepensionsregulator.gov.uk/en/document-library/research-and-analysis/occupational-defined-contribution-
landscape-2024
183
Calculated from TPR Occupational DC 2024 data: https://www.thepensionsregulator.gov.uk/en/document-library/research-
and-analysis/occupational-defined-contribution-landscape-2024
184
https://www.fca.org.uk/publication/consultation/cp24-16.pdf
133.
Error! Unknown documentproperty name.
133
7. The DC market has been consolidating, with the number of pension schemes reducing from
around 3,700 in 2012 to around 950 schemes now. The majority, close to 900, of these
schemes are single-employer trusts, traditionally set-up by employers to support their
workforce. However, as AE resulted in all employers needing to enrol their employees
(where eligible) into a workplace pension, there has been a rise in Master Trusts (multi-
employer pension schemes). Across around 30 schemes, these now account for 91% of
total and 90% of active memberships and 81% of assets in the DC trust-based market. In
addition, there are around 30 GPPs, which operate in the DC contract-based market. Across
the trust and contract-based markets, there are now 7 DC providers managing over £25bn
worth of bundled assets, where economies of scale are most apparent enabling schemes to
access a wider range of asset classes, negotiate lower fees and improve their
governance185
.
8. AE has led to more people saving into a pension. However, inertia is strong and
engagement is low. For example, 47% of adults contributing to a DC Pension have not
reviewed how much their pension is worth in the last 12 months (2022)186
and over 94% of
pension savers are invested in a pension scheme’s default investment strategy187
.
Regulation and types of DC pensions
9. DC pension schemes are either personal or stakeholder pensions. They can be workplace
pensions arranged by an employer or private pensions arranged by an individual; this
legislation focuses on workplace pension schemes. Regulation of the pensions industry in
the UK is split between the FCA and TPR:
• FCA regulates personal pensions, including workplace personal pensions (contract-
based pension schemes).
• TPR regulates occupational pensions (trust-based pension schemes).
10. The Small Pension Pots policy will cover all non-micro DC pension schemes (schemes with
12 or more members) when fully enforced.
• On the grounds of proportionality, the Department proposes to exclude Small Self-
Administered Schemes (SSAS) and Executive Pension Plans (EPP), with these
schemes already exempt from a number of duties with their members typically more
engaged and advised around investment decisions. These exemptions will mirror
those already used by productive finance/charge cap legislation, and the upcoming
VfM legislation.
• At this stage, the Department does not consider it proportionate to apply the Default
Consolidator framework to micro schemes given the cost they would incur.
• CDC, DB or Hybrid Schemes are all outside the scope of this solution.
Why small pension pots exist?
11. As employers choose the pension scheme their employees are enrolled into (not the
individual), every new employment may result in a new pension scheme and a new pension
pot being created. Although there is not one single cause for the creation of a small pot, key
reasons include:
• Short term employment spells where a person remains with an employer (and
therefore saving into that pension pot) for a short duration
• Members working multiple jobs meaning for each employer, they are likely to be
saving into a different pension scheme
185
https://corporate-adviser.com/research/ (Master Trust and GPP Defaults Report, 2024)
186
https://www.fca.org.uk/publication/financial-lives/fls-2022-pensions.pdf
187
https://www.thepensionsregulator.gov.uk/en/document-library/research-and-analysis/occupational-defined-contribution-
landscape-2024/occupational-defined-contribution-landscape-2024-annex
134.
Error! Unknown documentproperty name.
134
• Schemes not operating a one pot per member approach – Most schemes create
a new pension pot for each employment even if the member has already accrued a
pension pot with the scheme previously. Even within those schemes that do operate
a one pot per member approach, there is likely to be members with multiple pots
within the same schemes as a result of pots not being linked to members due to data
matching. This means people can have multiple pots within the same scheme.
• Stopping saving or opting out – Individuals may choose to opt-out after 1 month
and therefore are unable to receive a refund on their contributions188
or stop saving
after a short period of time.
12. According to HMRC data189
just under half (48%) of the 4.3m instances of people who
stopped contributing to their pension in 2021/22 were after a contribution spell of less than a
year. Of this, 68% were after contribution spells of less than six months. The most common
reason for stopping contributions (74% of cases) in 2021/22 was ending employment190
.
13. Assessing current contribution and earning levels can help to explain how small pots can be
created. Given the current National Living Wage (NLW)191
,it is estimated an employee
working full time would take less than 10 months (41 weeks) to create a pension pot of
£1,000. Based on the median weekly pay for full-time employees as of 2024192
, it is
estimated it would take just under 5 months (21 weeks) to exceed £1,000 of contributions.
14. Estimating the average number of jobs over an individual’s lifetime is challenging. However,
across a number of sources, it can be shown that the average number of jobs per individual
will be significant and it can be estimated on average that over their working life there is the
potential for every individual to create a small pot (pension pots below £1,000).
15. DWP has previously estimated193
the average individual may hold around 10-12 jobs over a
lifetime. A current estimate of around 11 jobs per individual over their working life remains in
line with this previously estimated average.
• These estimates consider a distribution of jobs across individuals on an aggregate
level. There will be certain sectors or lower paid jobs where job changes are more
frequent and therefore some individuals will hold a larger number of jobs than the
averages estimated. These individuals could therefore be more likely to create small
pots.
16. To estimate the average job count per individual, 3 independent methods have been used
to estimate and validate this (further details are in Annex A).
1. HMRC’s Real Time Information (RTI) – RTI data over the last 10 years (from 2014
onwards), shows across different age cohorts the number of jobs individuals have had
using NINos (National Insurance Numbers) and employment spells. Assuming past
data would hold in the future, this data implies a median job count figure of around 13
jobs per individual.
2. PENSIM – DWP’s microsimulation model estimates the number of “jobs” over an
individual’s working life based on historical data and the probabilities of individuals
changing roles. It should be noted, the model assesses a job change as either a
188
https://www.gov.uk/workplace-pensions/if-you-want-to-leave-your-workplace-pension-scheme
189
https://view.officeapps.live.com/op/view.aspx?src=https%3A%2F%2Fassets.publishing.service.gov.uk%2Fmedia%2F64a82
b88a32f130013f068dc%2Fstopping-saving-and-pensions-in-payment-
statistics.ods%23%3A~%3Atext%3DAs%2520published%2520previously%2520in%2520the%2Cthe%2520financial%2520year
%25202021%2520to&wdOrigin=BROWSELINK
190
Other reasons include stopping saving and becoming ineligible.
191
https://www.gov.uk/national-minimum-wage-rates
192
https://commonslibrary.parliament.uk/research-briefings/cbp-
8456/#:~:text=Median%20weekly%20pay%20for%20full,1997%2C%20adjusting%20for%20CPI%20inflation.
193
https://assets.publishing.service.gov.uk/government/uploads/system/uploads/attachment_data/file/214585/cp-oct10-full-
document.pdf
135.
Error! Unknown documentproperty name.
135
change in industry, a change in occupation, or change in employment status (where
they begin a new spell of either employment or self-employment). This, therefore, may
lead to an undercount of the average job count per individual as a change of job within
the same industry, where the individual’s occupation stays the same, is not classified
as a change in job. Using outputs from PENSIM 2194
and PENSIM 3, this estimates a
mean job count figure of between 9 – 10 jobs per individual.
3. External Research - An estimate of around 11 jobs per individual calculated using the
above two data sources is consistent with international evidence. For example, the US
(where there are some similarities in the structure of the labour market) shows
evidence of an average of 12 jobs195
per individual.
Number of small pension pots
17. As of 2025, the total number of pension pots across the DC trust-based market was around
30.6m, of which 28m (the majority) are within the 33 authorised Master Trust schemes
(including hybrid schemes)196
. Around 19.5m of these are deferred pots (pots without any
active contributions being made into them), with Figure 3 showing how the rapid growth in
deferred pots in the last 10 years has seen the number of active memberships overtaken by
the number of deferred pots within trust-based schemes.
Figure 3 – The number of active and deferred memberships within DC trust-based
schemes
Source: TPR’s Occupational defined contribution landscape 2024197
194
https://assets.publishing.service.gov.uk/government/uploads/system/uploads/attachment_data/file/214585/cp-oct10-full-
document.pdf
195
https://www.thebalancemoney.com/how-often-do-people-change-jobs-2060467
196
https://www.thepensionsregulator.gov.uk/en/document-library/research-and-analysis/occupational-defined-contribution-
landscape-2024
197
https://www.thepensionsregulator.gov.uk/en/document-library/research-and-analysis/occupational-defined-contribution-
landscape-2024/occupational-defined-contribution-landscape-2024-annex
0m
2m
4m
6m
8m
10m
12m
14m
16m
18m
20m
2012 2013 2014 2015 2016 2017 2018 2019 2020 2021 2022 2023 2024 2025
Deferred
Memberships
Active
Memberships
136.
Error! Unknown documentproperty name.
136
18. Across the wider occupational DC market, through the Department’s 2024 data gather198
,
the Department estimates there are around 23m deferred pots below £10,000, with around
13m of these estimated to be small pots (below £1,000). For some Master Trusts the
number of small pots represents a significant proportion of their overall number of deferred
pots. For example, as of 31 March 2022, 40% of Nest’s 11m members had pots worth £500
or less199
– the median pot value for all Nest members (active and deferred) was £800, with
a wide gap between active and inactive members.
19. Evidence shows the number of small pots continues to grow. Research published by the
Pensions Policy Institute (PPI) suggested in 2020 there were an estimated 8 million
deferred pension pots (of all sizes) held in authorised master trusts and without intervention
the number of deferred pots would likely to rise to 27 million by 2035200
. Data from the
Association of British Insurers (ABI) suggests that there were over 2.2 million deferred pots
under £1,000 held within contract-based schemes in 2021201
.
20. To improve the Department’s understanding, a number of data gather exercises have been
undertaken with industry. The data responses to the 2024 data gather suggested that the
proliferation of deferred pots is likely to be larger than PPI’s estimate and that there are
already roughly 23 million deferred pots with a value of less than £10,000 across the whole
DC market; representing an estimated £39bn in assets. Figure 4 shows the distribution of
the number and assets of deferred pots below £10,000 by value.
Figure 4 - Number of deferred pots and estimated assets under management in
deferred pots by pot size
198
https://www.gov.uk/government/publications/small-pots-delivery-group-report/small-pots-delivery-group-report
199
https://www.nestinsight.org.uk/wp-content/uploads/2022/10/Retirement-saving-in-the-UK-2022.pdf
200
https://www.pensionspolicyinstitute.org.uk/media/pqynaq5p/20200723-deferred-members-final-report-for-the-website.pdf
201
https://www.plsa.co.uk/Portals/0/Documents/Policy-Documents/2022/Small-pots-co-ordination-group-spring-2022-report.pdf
(ABI data collection, 2021 – covering all DC pension pots)
£0bn
£2bn
£4bn
£6bn
£8bn
£10bn
£12bn
£14bn
£16bn
0m
2m
4m
6m
8m
10m
12m
14m
16m
<£1k £1k-£2.5k £2.5k-£5k £5k-£10k
Number of Deferred Pots by pot size Assets in Deferred Pots by
size
137.
Error! Unknown documentproperty name.
137
Source: Provider data from DWP’s 2024 Data Gather202
21. The Department’s 2024 data gather was conducted as part of the Small Pots Delivery Group
to support wider policy development and this Impact Assessment as part of the Pension
Schemes Bill. The data gather built on the Department’s 2023 Call for Evidence203
and was
conducted between 20th
September 2024 and 18th
October 2024. In which, responses from
11 providers were received. Further detail of the data gather and its initial findings are
included within the Small Pots Delivery Group Report204
.
22. The current definition of a small pot referred to by the Department is a deferred pension
pot (with no active contributions for at least 12 months) with a value below £1,000, a
definition reached following consultation with industry205
and will be used for this legislation.
23. The Department consulted with industry as part of its “Proliferation of deferred small pots”
consultation about the appropriate pot size for pots to be eligible for consolidation. Views
across industry where mixed and there was no consensus across all responses. Half of the
respondents agreed that a £1,000 limit was the appropriate level, whilst the other half of
respondents were mixed in their views between £1,000 being either too high or too low of a
limit206
.
• Responses in support for the £1,000 limit considered £1,000 as a good starting point
to achieve a significant level of consolidation without having an overly destabilising
effect on the market.
• Some of the responses that argued a £1,000 limit was too small, suggested its impact
in terms on retirement incomes would be minimal and that a higher value would allow
members’ consolidator pots to increase in value at a greater rate due to the increased
eligibility which would be more favourable for investment. These responses also
suggested a higher limit would increasingly support consolidator schemes to increase
scale.
24. The Department has chosen to move forward with a pot limit of £1,000 as a central point that
balances the risk of member detriment if the limit is set too high and the potentially distortive
impact of increasing the number of eligible pots being transferred at the point of
implementation, with setting the limit too low that not enough unprofitable pots would be
eligible and therefore there would be limited net benefits to members. An initial limit of
£1,000 whilst addressing a significant number of deferred pots (57% of deferred pots below
£10,000), would only account for around 11% of assets within deferred pots below £10,000.
This should ensure benefits to a large range of members with deferred pots whilst avoiding
distortive impacts on the pensions market through the movement of a significant value of
assets between providers.
• Across the consultation responses there was a strong proportion of responses who
acknowledged a £1,000 limit strikes the right balance for both schemes and members.
25. The Department is seeking the necessary powers to enable it (were it deemed appropriate)
to increase the £1,000 limit over time, any changes would remain at the discretion of the
Department and would be subject to consultation prior to any changes. Therefore, there is
the potential for the limit to increase in due course to expand the eligibility to a wider number
of deferred pots, if the Department deems this as an appropriate adjustment.
202
https://www.gov.uk/government/publications/small-pots-delivery-group-report/small-pots-delivery-group-report
203
https://www.gov.uk/government/consultations/addressing-the-challenge-of-deferred-small-pots/addressing-the-challenge-
of-deferred-small-pots-a-call-for-evidence
204
https://www.gov.uk/government/publications/small-pots-delivery-group-report/small-pots-delivery-group-report
205
https://www.gov.uk/government/consultations/ending-the-proliferation-of-deferred-small-pension-pots/ending-the-
proliferation-of-deferred-small-pots
206
https://www.gov.uk/government/consultations/ending-the-proliferation-of-deferred-small-pension-pots/outcome/government-
response-to-ending-the-proliferation-of-deferred-small-pots
138.
Error! Unknown documentproperty name.
138
• The potential to increase the pot limit in due course, should allow a greater proportion
of members with small pots to benefit and better support the growth in scale of
consolidator schemes if the Department deems an increase in the eligibility limit to be
in the best interest of members whilst supporting pension schemes.
26. The majority, 13m, of the current deferred pots are worth less than £1,000 (the average
value is around £330), however, due to their low value they only account for about £4.3bn in
assets. This represents around 2% of the assets in the occupational trust-based DC market,
which has reported asset values of £205bn; of which £166bn is in Master Trusts (excluding
hybrids)207
. Figure 5 splits the number of deferred pots and deferred assets per each value
band as a proportion of total deferred pots below £10,000.
27. IFS estimates suggest that 7% of the accumulated pension pots over a 9-year period
between 2010 – 2022 had a value below £1,000208
.
Figure 5 – Cumulative number of deferred pots and assets below proposed limits
Source: Provider data from DWP’s 2024 Data Gather209
28. Many of the small pots are concentrated in a small number of pension schemes. Since 2020,
the number of deferred pots worth less than £10,000 across the same 5 large schemes has
grown by roughly 7.2m, from 10.9m in 2020 to 18.1m in 2024210
. Of this growth, nearly 3m
was in pots worth less than £1,000, from 8.3m to 11.2m. This growth is highlighted in Figure
6 below.
207
https://www.thepensionsregulator.gov.uk/en/document-library/research-and-analysis/occupational-defined-contribution-
landscape-2024
208
https://ifs.org.uk/sites/default/files/2025-02/IFS-Report-Small-pension-pots-problems-and-potential-policy-
responses%20%281%29.pdf
209
https://www.gov.uk/government/publications/small-pots-delivery-group-report/small-pots-delivery-group-report
210
https://www.gov.uk/government/publications/small-pots-delivery-group-report/small-pots-delivery-group-report#chapter-12-
analysis
Pot Size Below £1,000 Below £2,500 Below £5,000 Below £10,000
Number of Pots 13.0m 17.7m 20.6m 22.9m
as a % of Deferred Pots
less than £10,000
57% 77% 90% 100%
Value of Assets £4.3bn £12.2bn £22.5bn £38.9bn
as a % of Assets in
Deferred Pots less than
£10,000
11% 32% 58% 100%
139.
Error! Unknown documentproperty name.
139
Figure 6 - Comparison of the number and size of deferred pots in the same five large
schemes between 2020 and 2024
Source: Provider data from DWP’s Data Gathers and Call for Evidence
29. Since AE was introduced, on average more than 1m pots smaller than £1,000 have been
created per year, worth more than £300m on average annually. The significant growth since
2020 highlights the continuous nature of the small pots challenge, meaning that whilst a
small pots consolidation solution will need to have the potential to address the existing stock
of deferred pots, there will also need to be a focus on addressing the continued flow of new
small pots being continually created.
30. After the Impact Assessment was completed, more recent information on the DC landscape
became available. The contextual and background information within the IA has been
updated to reflect the latest information. However, it is important to note the calculations are
using the previous years’ worth of data. The changes in the landscape are in line with
expectations and therefore it would not materially change the cost or benefits of the policies.
Policy background
31. A wide range of work has taken place since 2020 to address the small pots problem with a
focus on working with industry. This has included:
• In September 2020, the then Minister for Pensions and Financial Inclusion set up the
Small Pots Working Group – chaired by DWP – to examine the scale, nature, and
impact of deferred small pots and to try to build a consensus on the priority options to
address their growth. The group reported in December 2020211
. The report found that
whilst opportunities for member-initiated consolidation should continue to be maximised
they would be unlikely alone to change the trend in the growth of deferred small pots.
The group concluded the pensions industry, working alongside Government and
regulators, should prioritise work on enabling automatic and automated large-scale low-
cost transfers and consolidation for the AE mass-market. The group considered that two
large scale solutions should be prioritised – Default Consolidator and Pot follows
Member – but that final decisions should be informed and developed following
examination by the pensions industry of the underlying administrative challenges that
may prevent the implementation of a large-scale automated solution.
211
https://assets.publishing.service.gov.uk/media/5fdb16428fa8f54d5d6556d4/small-pots-working-group-report.pdf
0m
2m
4m
6m
8m
10m
12m
Less than £1,000 £1,000 to below £2,500 £2,500 to below £5,000 £5,000 to below £10,000
2020 2023 2024
140.
Error! Unknown documentproperty name.
140
• In March 2021, at the invitation of the then Minister for Pensions and Financial Inclusion,
the ABI and the Pensions and Lifetime Savings Association (PLSA) jointly convened the
Small Pots Cross-Industry Co-ordination Group to take forward analysis of the
administrative challenges identified by the December 2020 report.
• In September 2021, the Co-ordination Group’s first report set out the progress they
had made.212
This included agreeing a set of working assumptions that covered the
nature and value of small pots assumed to be within scope of any future consolidation
model, whilst also setting out further evidential needs to build the case for a large-scale
consolidation solution. The group made substantial progress on identifying the potential
risks and benefits of consolidating deferred small pots for members and developed
understanding around the key barriers in relation to data matching for automated
consolidation solutions. The group also set out actual and perceived barriers within the
current transfer system, identifying where costs occur and potential efficiencies.
• The group’s second report in June 2022 recommended that Government should
explore three solutions: multiple default consolidators; pot follows member; and member
exchange with development of a cost/benefit analysis and assessment of market
impacts213
.
• In January 2023, the then Minister for Pensions launched a call for evidence214
to
deepen the evidence base around the scale and characteristics of the growth in the
number of deferred small pots. It focussed on the two large-scale automated
consolidation solutions – a default consolidator model and pot follows member – whilst
recognising the potential impact of other actions, including member exchange, and
enabling more member engagement, that could help to mitigate the growth in the
number of small pots.
• Feedback from the call for evidence demonstrated that across industry there was no
clear consensus on the optimal way forward in terms of an automated consolidation
solution. However, respondents did agree that without government intervention, the
challenge of deferred small pots would continue to grow. Respondents agreed that
whilst member-initiated consolidation should continue to be explored and supported,
relying on that alone would not be sufficient in addressing the growing challenge of
deferred small pots.
• The Department published its response to the call for evidence in July 2023, in which a
public consultation on the Department’s response to the call for evidence and a set of
policy consultation questions was launched, with an included proposal to move forward
with a multiple default consolidator approach215
. The consultation sought views across a
range of stakeholders and ran from 11th July 2023 – 5th
September 2023, with the
Department publishing the outcomes and its response in November 2023216
.
• As part of the Government’s response to the consultation, the Department committed to
launching a delivery group to consider the views of industry further and identified key
areas from the consultation for the delivery group to consider.
• The work of the Department with industry continued with the Small Pots Delivery
Group established in February 2024, chaired by DWP which included a wide range of
stakeholders covering multiple sectors, interested parties and representative bodies, to
212
https://www.plsa.co.uk/Portals/0/Documents/Policy-Documents/2021/Small-pots-cross-industry-co-ordination-group-update-
report.pdf
213
https://www.plsa.co.uk/Portals/0/Documents/Policy-Documents/2022/Small-pots-co-ordination-group-spring-2022-report.pdf
214
https://www.gov.uk/government/consultations/addressing-the-challenge-of-deferred-small-pots
215
https://assets.publishing.service.gov.uk/media/64abd877a32f130013f0692b/ending-the-proliferation-of-deferred-small-
pots.pdf
216
https://www.gov.uk/government/consultations/ending-the-proliferation-of-deferred-small-pension-pots/outcome/government-
response-to-ending-the-proliferation-of-deferred-small-pots
141.
Error! Unknown documentproperty name.
141
support with the development and design of a multiple default consolidator policy after
the publication of the Department’s response to “Ending the proliferation of deferred
small pots”217
in November 2023. It was agreed by the group that any solution
developed would need to reduce wasted administration costs, be fit for the future and
have a tolerance of risk. The Delivery Group focused on the potential interactions with
the Pensions Dashboard, the role and functions of the Small Pots Data Platform, data
matching approaches, member communications, the process of member pot allocations,
the role of the regulators in the authorisation and supervision process, pension
transfers, liability and implementation approaches. The group reported in April 2025218
.
The group provided recommendations and insights on how best to implement the
proposed automated multiple default consolidator solution which was set out in the 2023
consultation response.
• As part of the delivery group the Department’s 2024 data gather was conducted to
support the policy development and to build upon the 2023 call for evidence. With a
particular focus on the transfer and administration of deferred pots as well as further
expanding the evidence base around the scale and growth of the small pots challenge.
The data gather closed in October 2024 and concluded219
that across the pensions
industry the scale of the proliferation of deferred small pots continues to increase.
32. The Department has worked with other industry stakeholders including working alongside
the Pensions Policy Institute (PPI) to explore internationally how small pots are being dealt
with across other countries.
• Other countries have attempted to address the issue of small pots in different ways
and the Department has and continues to look into the different solutions used
internationally, including through the report published by PPI220
.
• The Department has leveraged data and information from international examples,
specifically Australia to help estimate the costs of a small pots solution.
Rationale for intervention
33. Maximising the evidence from the industry working groups, industry engagement, and the
call for evidence, it has become clear that legislation is required to make progress on
tackling this problem. This is particularly the case as there are a number of benefits to small
pot consolidation for both members and schemes.
Pension Schemes
34. A clear market failure exists for schemes in the form of asymmetric information.
Schemes accept the members an employer signs up, without the knowledge of which
members may leave or stop saving shortly after - creating a loss-making deferred small pot.
Some schemes may only choose to accept certain employers to potentially mitigate against
this. However, Nest (one of the largest schemes) is required to accept all employers as part
of its public service obligation. Additionally, other schemes have sought to take on large
numbers of employers or targeted specific employers to build economies of scale. This
results in a situation where all members are charged higher administration charges to
account for the risk of them creating a loss-making deferred small pot (as discussed more
below).
217
https://www.gov.uk/government/consultations/ending-the-proliferation-of-deferred-small-pension-pots/outcome/government-
response-to-ending-the-proliferation-of-deferred-small-pots
218
https://www.gov.uk/government/publications/small-pots-delivery-group-report/small-pots-delivery-group-report
219
https://www.gov.uk/government/publications/small-pots-delivery-group-report/small-pots-delivery-group-report
220
https://www.pensionspolicyinstitute.org.uk/media/iipmtkwa/20210112-small-pots-international-report-final.pdf
142.
Error! Unknown documentproperty name.
142
35. PPI previously estimated pots below £2,300 can be unsustainable for schemes to manage if
they charge through an Annual Management Charge (AMC) only221
(this is currently capped
at 0.75%222
). Given the average industry charge is around 0.5%, this would mean the
required average pot size to breakeven was just under £4,000. More recent evidence from
industry consultation found the breakeven point varied but was consistent that a pot below
£1,000 would be loss-making if only charged through an AMC.
36. The growth of deferred small pots adds increased costs and inefficiency into the UK
workplace pensions market. It is estimated there are industry costs close to £240m per year
across the existing small pots below £1,000. This is broadly consistent with the Small Pots
Cross-Industry Co-ordination Group estimate that the continued growth in the number of
small pots by 2030 – “will likely result in wasted administration costs of around a third of a
billion pounds per annum.”223
They also state that small pots can impact negatively on value
for money outcomes for members, has implications for the financial sustainability of pension
schemes and it makes it harder for members to engage with their pension savings224
.
37. For some pension schemes, the inherent inefficiency in the current system may threaten
their longer-term financial sustainability with the administration costs involved in managing
millions of deferred small pots outweighing the amount they receive through charges.
38. Schemes have already faced wider financial challenges within the market, with PPI in 2020
suggesting that the Master Trust industry was unlikely to breakeven until around 2025, with
significant costs involved in the setting up of pension schemes. With cumulative investment
costs of setting up and running the largest four master trust schemes estimated to be £1bn
by 2019225
.
39. The expected rise in costs to schemes and the resulting inefficiency of small pots, could
therefore increase the unwelcome consequences levied on members in terms of the cross-
subsidy effect that operates within schemes (where members with larger pots are effectively
charged more to cover the losses made by smaller pots) and through the undermining of
confidence in a competitive and otherwise healthy market.
40. The consolidation of schemes within the DC pensions market could help to support small
pots consolidation through a smaller number of schemes for members to be enrolled within.
The expectation would also be for any merger and acquisition activity between schemes to
consolidate a proportion of the deferred small pots.
• The Government’s “Pensions Investment Review” consultation226
has proposed
measures that would support and accelerate scale and consolidation within the DC
market. With the Government “clear that the future of the workplace DC market lies in
fewer, bigger, better run schemes.”227
Pension Savers
41. There are also market failures for individuals. Imperfect information exists around the
ability to consolidate pots and, even where this may be known, the process can be
challenging or confusing. Voluntary consolidation is highly unlikely to address this issue. The
221
https://www.pensionspolicyinstitute.org.uk/media/pqynaq5p/20200723-deferred-members-final-report-for-the-website.pdf
222
https://assets.publishing.service.gov.uk/media/61d823e3d3bf7f053fd8254e/charge-cap-guidance.pdf
223
https://www.plsa.co.uk/Portals/0/Documents/Policy-Documents/2022/Small-pots-co-ordination-group-spring-2022-report.pdf
224
https://www.plsa.co.uk/Portals/0/Documents/Policy-Documents/2021/Small-pots-cross-industry-co-ordination-group-update-
report.pdf
225
https://www.pensionspolicyinstitute.org.uk/media/cz4j1a0x/20200827-financial-sustainability-of-master-trust-schemes-
final.pdf
226
https://www.gov.uk/government/consultations/pensions-investment-review-unlocking-the-uk-pensions-market-for-
growth/pensions-investment-review-unlocking-the-uk-pensions-market-for-growth
227
https://assets.publishing.service.gov.uk/media/6736181254652d03d5161199/Pensions_Investment_Review_interim_report.pdf
143.
Error! Unknown documentproperty name.
143
Financial Lives Survey 2022228
found only 10% of eligible UK adults had consolidated their
pension pots in the last 3 years (most likely from engaged and financially literate savers);
and without compulsion it is unlikely schemes themselves would be able to find a market-
wide solution.
42. Additionally, research exploring member engagement with workplace pensions showed that
whilst some members understood the benefits of consolidation there were barriers
preventing them from taking action, including concerns around scams, a perception of
difficulty and lack of understanding about whether they could consolidate their pension
pots229
. This research found support for both a pot follows member and a default
consolidation solution, with the perception of simplicity for members with the transfer and
consolidation process being managed on their behalf.
• Lack of engagement and disinterest in pensions from savers is thought to be a large
part of the lack of member-led consolidation, with the upcoming implementation of the
Pensions Dashboard which aims to increase member engagement with pensions
there is potential for an increase in member-led consolidation as a result. However, as
discussed further [line 121] any impact whilst currently unknown is not considered
material, considering the role of the Pensions Dashboards and the current
engagement of members with small pots.
43. Engagement with pensions remains low across the majority of members, with inertia
a significant barrier to member benefits. The inertia around pensions means many
members either make uniformed choices or instead take no action in regards to their
pension savings which results in the member suffering detriment in the future. The
proliferation of small pots is a clear example of the inertia in regards to pensions. The
automatic nature of automatic enrolment means that many members are unaware they are
contributing into a pension and therefore as they more jobs after short-term saving they are
unaware that they may have created a pension pot of small value. Many members with small
pots are often unaware that they have a small deferred pension230
. If members were more
engaged with their pension savings, the rate of member-led consolidation would be expected
to increase as the consolidation of small pots is in the interest of the individual members.
Instead, the existence of small pots hampers retirement outcomes for members and blocks
members from experiencing the true extent of the benefits of long-term pension saving. The
consolidation of small pots may even work towards improving member engagement and
reducing the inertia around pensions savings whilst helping to drive improved outcomes at
retirement for members.
• The widespread nature of the inertia in pension savings is a significant market failure
that hampers the achievable benefits of pension savings for members whilst also
negatively impacting pension schemes. The resultant creation of small pots due to the
inertia around pensions means members are often unaware of the extent to which
they can benefit from long-term pensions saving.
44. As discussed previously [line 14] and within further detail [Annex A], the average individual
has numerous jobs over their lifetime meaning there is the potential for an individual to
create numerous small pots over their working life. This risks members losing track of
multiple pots over time or becoming disincentivised or disengaged by multiple small pots.
These barriers and the time involved in navigating them may serve to erode trust and
confidence in pensions saving.
228
https://view.officeapps.live.com/op/view.aspx?src=https%3A%2F%2Fwww.fca.org.uk%2Fpublication%2Ffinancial-
lives%2Ffinancial-lives-survey-2022-tables-volume-12-pension-accumulation.xlsx&wdOrigin=BROWSELINK (Table 116)
229
https://www.gov.uk/government/publications/understanding-member-engagement-with-workplace-pensions/understanding-
member-engagement-with-workplace-pensions#consolidating-deferred-pension-pots
230
https://www.gov.uk/government/publications/understanding-member-engagement-with-workplace-pensions/understanding-
member-engagement-with-workplace-pensions
144.
Error! Unknown documentproperty name.
144
45. Having pension savings split across numerous pots such as small pots is thought to make
decision making during accumulation difficult according to the IFS231
(Institute for Fiscal
Studies).
46. PPI has recently published research on the total value of lost pension pots, those pension
pots where schemes are unable to contact the member to which the pension pot belongs
to232
. This illustrated the value of lost pension pots has grown from £19.4 billion in 2018 to
£31.1 billion in 2024. The research suggested there could be a link between the increasing
number of small pots and the growth in lost pots between 2018 and 2024. Though it should
be noted that the average size of a lost pot from the research is £9,470; well above the
Department’s current definition of a small pot.
47. Addressing the small pots challenge may allow pension charges to operate in a more
efficient and beneficial way for members:
• Flat fees - Some pension schemes charge members a flat fee on each of their
pension pots. As a result, having multiple small pension pots risks individuals facing
significantly greater costs and eroding the value of pension savings over time.
• Cross subsidisation – As schemes may expect to have some loss-making pots, this
can drive up the average charge level across the industry with more profitable pots
subsidising loss-making pots. Although charges are low (average of 0.48% AMC233
);
the removal of small pots may further reduce fees and thus improve pension
outcomes for members.
o The cross subsidisation of charges across all members is a negative
externality that stems from the proliferation of deferred small pots. Not only do
small pots hamper the retirement outcomes of the members with small pots,
those members without small pots also face detriment as the increase in
charges across the pensions industry through cross-subsidisation reduces
members’ retirement incomes234
.
Why Government is best placed to address the market failures
48. Government regulation and legislation is considered to be best placed to address the wide-
scale nature of the small pots problem.
49. The Department has undertaken significant engagement with industry with the aim of the
pensions industry addressing the issue of small pots itself. However, as seen through the
member exchange pilot which is discussed further [line 97], industry has been unable to
move forward with a solution without the need for supporting government legislation.
50. There is a divide across the pensions industry on the best solution to address small pots,
with a roughly equal division between schemes that favour a pot follows member approach
and schemes that prefer a multiple default consolidator model. Both policy options would
require government legislation to be implemented and therefore whilst there remains no
consensus across the pensions industry on the best solution to implement, there is a clear
consensus that government legislation is required to implement a market-wide small pots
solution.
231
https://ifs.org.uk/sites/default/files/2025-02/IFS-Report-Small-pension-pots-problems-and-potential-policy-
responses%20%281%29.pdf
232
https://www.pensionspolicyinstitute.org.uk/media/vh4aaq2j/20241024-ppi-bn138-lost-pensions-2024-final.pdf
233
https://www.gov.uk/government/publications/pension-charges-survey-2020-charges-in-defined-contribution-pension-
schemes/pension-charges-survey-2020-charges-in-defined-contribution-pension-schemes
234
https://www.pensionspolicyinstitute.org.uk/media/pqynaq5p/20200723-deferred-members-final-report-for-the-website.pdf
145.
Error! Unknown documentproperty name.
145
51. ABI and PLSA’s Small Pots Cross-Industry Co-ordination Group235
in its conclusion
recommended that Government should explore a number of solutions to address the
proliferation of small pots. Since then engagement with industry through a call for evidence
and the small pots delivery group has focused on how industry and government can co-
operate on a government legislated solution.
• Industry has extensively engaged with the Department in the development of a
solution which further suggests broad industry support for the requirement of
government legislation.
Rationale and evidence to justify the level of analysis used in the IA
(proportionality approach)
52. This impact assessment builds on a wide range of evidence and data. In particular, recent
information from DWP’s “Data Gather” engages data from pension providers and provides a
timely and accurate assessment of small pension pots giving confidence to the assessment
of the challenge. The IA draws on evidence collected across:
• The pensions industry – As outlined above, several working/delivery groups have
been conducted to engage on options. This follows an extensive Call for Evidence
and consultations where responses and evidence were sought to help shape the final
policy details. Further engagement with industry on the details of secondary
legislation will continue.
• HMRC – HMRC’s RTI data has been sought to better understand the trends of short-
term pension saving and to help understand the churn in the labour market.
• Members – Across several surveys the department has looked to seek input from
members to understand their views and preferences around small pot solutions. This
included specifically testing the views of members around potential solutions and
understanding the willingness of members to pay for a small pots solution.
o ONS’s Wealth and Assets Survey (WAS)236
has been used throughout this IA.
It is a survey that measures the well-being of households and individuals and
contains useful data and information around an individual’s pension pots that
helps to build a more individual view of the accumulation of small pots for this
IA. Data across numerous waves and rounds of the WAS are used throughout
the IA, with the most recent figures included from the publication of Round 8.
Round 8 covers a sample of 15,100 households between April 2020 to March
2022237
.
• Regulators – DWP has worked closely with TPR and FCA to help understand the
DC pensions landscape, scheme information, and potential forecasts.
53. However, there are some limitations within the data which impact the assessment. For
example:
• Commercial sensitivity – Information from pension schemes may be commercially
sensitive, particularly around key financial indicators such as profitability. This
impacts the ability to draw robust conclusions at a scheme-level.
• Individual level data – Data received from schemes is on an aggregated level and
although some data sources allow for individual analysis (e.g. the Wealth and Assets
Survey), this has some limitations (e.g. recall of information can be lower). This
impacts an individual-level assessment of pension pots per person.
235
https://www.plsa.co.uk/Portals/0/Documents/Policy-Documents/2022/Small-pots-co-ordination-group-spring-2022-report.pdf
236
https://www.ons.gov.uk/peoplepopulationandcommunity/personalandhouseholdfinances/debt/methodologies/wealthandassetss
urveyqmi#quality-characteristics-of-the-wealth-and-assets-survey-data
237
https://www.ons.gov.uk/peoplepopulationandcommunity/personalandhouseholdfinances/incomeandwealth/bulletins/totalwealthi
ngreatbritain/april2020tomarch2022
146.
Error! Unknown documentproperty name.
146
• Smaller pension schemes – Data collection exercises have tended to receive
responses from larger schemes. Although the vast majority (90%238
) of active savers
within trust-based schemes are within the 33 Master Trusts which emerged from the
roll-out of Automatic Enrolment, there may be a small number of small pots within the
smaller pension schemes (particularly single-employer schemes) which are not
represented within the data collected from industry. However, this is not considered
material.
• Changing shape of the pensions market – It is anticipated that consolidation of the
pensions market will continue with the Government consulting239
on measures to
accelerate consolidation and the growth in scale of schemes and the introduction of
the VfM framework240
will help support the consolidation of single employer trust
schemes. The merger of schemes may help to address some of the existing small
pots issue; however, it cannot be known how many schemes will merge nor the
potential impact or operating model that this could entail (not all schemes operate a
lifetime pot per member model).
• Policy and delivery details – Details of the policy are still being considered and
worked through with industry and any further details may change the impact or
implementation costs. Especially as further secondary legislation will be needed
ahead of the policy being introduced.
• Future transfer costs – Although the Department has sought estimates from
schemes on the future cost of transfers under an automated solution, any averages
are inherently uncertain. In particular, there are evidence gaps around the marginal
cost of each extra transfer and the exact effects of bulk transfers on costs. With the
cost per pot of bulk transfers being highly subjective and sensitive to the number of
deferred pots being transferred.
54. On balance, the level of evidence and data is considered proportionate to the planned
legislation.
Policy objective
55. The government aims to:
a. Improve value for members, by ensuring the system works better for
members, reduces inefficiencies and overall costs whilst supporting greater
member engagement.
b. Help remove inefficiencies for pension schemes, by reducing the number
of small deferred pension pots that they have to administer.
• In doing so, any policy intervention needs to be affordable for government and the
pensions industry and remain consistent with wider government pensions policy.
56. The Department’s call for evidence considered solutions against five key criteria:
• Delivery of overall net benefits for members through improved value for money
outcomes, achieving a meaningful impact on the number of existing and the flow of
new small deferred pots.
• Complements member engagement on their savings journey/retirement planning.
• Supports a competitive, sustainable and more efficient workplace pensions
market.
• Minimises complexity and administrative burden for employers.
238
https://www.thepensionsregulator.gov.uk/en/document-library/research-and-analysis/occupational-defined-contribution-
landscape-2024/occupational-defined-contribution-landscape-2024-annex
239
https://www.gov.uk/government/consultations/pensions-investment-review-unlocking-the-uk-pensions-market-for-
growth/pensions-investment-review-unlocking-the-uk-pensions-market-for-growth
240
https://assets.publishing.service.gov.uk/media/64c25790331a650014934cc5/value-for-money-a-framework-on-metrics-
standards-and-disclosures.pdf
147.
Error! Unknown documentproperty name.
147
• Commands confidence in the system for savers and taxpayers.
57. The objective of this policy is to reduce the number of unprofitable deferred small pots which
pension schemes currently administer, thus enabling schemes to provide greater value for
money for their members. It is anticipated that the preferred option would result in a material
reduction of the number of deferred small pots within the system.
Summary of preferred option with description of implementation plan
58. The Department’s preferred option is for a small number of authorised default consolidators,
under this approach:
• When a member’s pot meets the chosen eligibility criteria it would be automatically
transferred to the member’s default consolidator scheme. The current eligibility criteria
outlined by the Department is:
o A pot with a value below £1,000
o A pot that has been deferred for at least 12 months (no member or employer
contributions)
• The consolidator schemes would be authorised schemes in which each member’s
eligible small pots would be consolidated into one consolidator pot.
o In some instances, a pot would not be consolidated due to a data match required
for consolidation not being achieved. This could be the result of a lack of or poor
data quality, but would mean that there would not be 100% consolidation of small
pots in all cases.
• The consolidation process would be automatic and would require no active
engagement from members; however, the option would remain for member
engagement within the process. Either through the option for members to opt-out of
consolidation and/or the option for members to choose their own consolidator scheme
from the selection of authorised schemes.
• Where no active member decision is made in relation to their consolidator scheme,
one of the following would occur:
o For members that already have a pot within one of the consolidator schemes this
would become their default consolidator reducing the need for transfers
o Remaining members would be distributed proportionally across the authorised
consolidator schemes via a carousel system
59. In the instance of a member having both an active and deferred pot within their consolidator
scheme, the consolidated small pots should be allocated to the member’s largest pot. This
approach is thought to benefit members in the long term whilst reducing the complexity of
the process. It should also support the overall aim of the Department to see members having
fewer, larger pension pots. With it being anticipated that this approach will reduce the
number of pots to just two for a large number of members; one active and one deferred pot.
60. Figure 7 summarises the process in which members would be allocated to a consolidator
scheme.
148.
Error! Unknown documentproperty name.
148
Figure 7 – The process of member allocation to a consolidator scheme
61. To achieve this, the Government will require primary legislation and underpinning secondary
legislation to set out the specifics of the consolidation framework. As part of this, powers will
be taken to ensure that the regulator(s) can monitor and enforce compliance where required.
As a result, there are significant delivery steps still needed to be decided and iterated which
means any specific policy details are subject to change. However, the best estimates of the
policy, costs, and benefits are presented within this Impact Assessment to support
transparency.
62. Scope: Engagement with industry has set the focus of consolidation solutions as deferred
small pots that are within the AE workplace pensions market within charge-capped default
funds (including sharia compliant funds). However, it will exclude those pots with
guarantees. It is expected that the vast majority of small pension pots are in scope, across
trust and contract-based schemes.
63. Threshold: The eligibility criteria as referred to above [line 58] and discussed further
previously [line 22] was chosen to ensure the right balance was struck between achieving
significant levels of consolidation, but also limiting the impact on schemes. The eligibility
criteria will remain under review. It is estimated there are roughly 13m deferred small pots
eligible for consolidation – worth approximately £4.3bn.
64. Default Consolidators: Schemes are expected to apply for authorisation to become a
consolidator scheme, with the Department intending to define the requirements
consolidators must meet. It is expected to be only a relatively small number of schemes that
would apply for authorisation, with the likelihood that only schemes with existing levels of
scale that is sufficient enough to counter an initial influx of potentially loss-making pots would
apply for authorisation. The Department proposes the following to be encompassed within
the authorisation criteria:
• Already an AE qualifying scheme
• Specific value of Assets Under Management (AUM)
• Provide the highest level of VfM outlined within the VfM policy
• Protection from flat fees above the current level of the de minimis241
(a threshold that
restricts the charging of flat fees on pots below the level set by the de minimis)
• Same scheme consolidation and financial sustainability
• Ability to accept incoming Protected Pension Ages
65. Schemes would be able to seek authorisation to become a consolidator scheme at any point
but it is anticipated that the majority of the authorisation will occur at the beginning of the
policy.
241
https://www.thepensionsregulator.gov.uk/en/document-library/scheme-management-detailed-guidance/funding-and-
investment-detailed-guidance/cost-and-charge-
restrictions#:~:text=On%206%20April%202022%2C%20a,scope%20of%20the%20charge%20cap.
149.
Error! Unknown documentproperty name.
149
66. The Department plans to proceed with a whole-of-market approach for consolidator
schemes, allowing schemes from both the trust-based and contract-based side of the market
to apply to become consolidator schemes under a multiple default consolidator solution.
67. The Department believes that this approach should drive significant interest from larger
providers, resulting in a competitive market that supports greater member outcomes.
68. The current intention is to build the authorisation of consolidators out of the pre-existing
Master Trust authorisation process, with The Pensions Regulator (TPR) being responsible
for the authorisation of Master Trust schemes. Noting that it would not be possible to build
out of the Master Trust framework for GPPs, the Department will work with The Financial
Conduct Authority (FCA) to ensure that an appropriate regulatory framework can be
established, subject to appetite, such that GPPs are held to an equal standard as Master
Trusts if used as default consolidators. There would be ongoing supervision of the
consolidator schemes which would likely be risk based by the regulators with the majority of
the authorisation criteria unlikely to fluctuate.
69. The Department is considering the potential for a phased implementation of a default
consolidator solution, with a range of phased approaches being considered. The Department
understands the importance of a staged and phased approach to implementation
recognising the importance of the number of pension transfers that will be undertaken. The
Department will consult with industry further to develop the implementation approach taking
account of wider pension reforms, to ensure that the policy can be delivered successfully
and to help distribute costs over time.
70. The Department considers that a central mechanism will be necessary for a default
consolidator solution in order to facilitate the transfer of pension pots between schemes. A
feasibility review is being undertaken to advise on the specification needed for the Small
Pots Data Platform, the terms of reference for the review were published within the Annex of
the Small Pots Delivery Group Report242
. With the aim of identifying the most efficient and
effective way of building the Small Pots Data Platform to provide value for money to
members, schemes and the taxpayer.
• A Small Pots Data Platform is currently the most developed concept for a central
mechanism and therefore is used as the basis for a central mechanism throughout
this IA.
71. Due to the commercially and personally sensitive nature of the data that a Small Pots Data
Platform would require access to, it is the intention that the Department will undertake an
assessment of the delivery capabilities.
72. Provisionally the Department considers the following as the key core functions of a Small
Pots Data Platform, with further detail to be set out following recommendations and
conclusions of the Feasibility Review:
• Facilitation of the consolidation process (including the allocation of members to
consolidators)
• Data Matching
• Data Verification
• Payment of compensation, in cases where the liable scheme is no longer active
73. Figure 8 summarises the Department’s proposed process of a Multiple Default Consolidator
solution, highlighting the interactions of schemes and the Small Pots Data Platform.
242
https://www.gov.uk/government/publications/small-pots-delivery-group-report/small-pots-delivery-group-report
150.
Error! Unknown documentproperty name.
150
Figure 8 – The proposed process of a Multiple Default Consolidator solution
Description of options considered
74. Alongside the Department’s preferred option of a Multiple Default Consolidator solution, the
Department has also considered a number of other viable policy options as solutions to the
challenge of deferred small pots, based on the Department’s initial 2020 working group243
which examined potential solutions. Figure 9 summarises all the policy options that have
been considered by the Department.
Figure 9 – Summary of Options Considered
Solutions Potential Benefits Potential Limitations
Option 0 - Do Nothing
Under this option the government
would not intervene to address the
problem of small pots. The
introduction of the Pensions
Dashboard and FCA’s consultation
on targeted support may indirectly
help address the issue of small pots
to a certain extent but would not be
expected to solve the small pots
challenge. Any direct intervention to
address the issue of small pots
would be the result of entirely
industry-led solutions, with the
expectation being that no industry
wide solution would be introduced
due to the complexities and
difficulties that would occur.
There are no perceived benefits
accruing as a result of a “do nothing”
approach.
The number of small pots would be
expected to continue to grow,
increasing the cost burden on
schemes and continuing the
detrimental impact on long-term
member outcomes at retirement.
243
https://www.gov.uk/government/publications/small-pension-pots-working-group/small-pots-working-group-report#chapter-4-
-scheme-led-solutions--analysis-and-recommendations
151.
Error! Unknown documentproperty name.
151
Option 1 - Default Consolidator
(preferred option)
Deferred small pots which meet the
chosen eligibility criteria for
automatic consolidation would be
transferred automatically to a
consolidator, with members being
given an opportunity to opt-out if
they wish. If members already have
a pot within an authorised
consolidator scheme this is where
they would be allocated, otherwise
they would be allocated to a
consolidator from a carousel system
unless an active choice is made by
the member.
This could remove a significant
number of deferred small pots, which
could ease financial strains on
pension schemes.
It is anticipated that this approach
will, over time, enable consolidator
schemes to generate scale to drive
greater value for money and
efficiencies for their members.
A member’s deferred pots would be
consolidated into a single pot within
one scheme, making it easier for
members to engage with their overall
pension savings.
It would not require active
involvement from the member,
although the member could choose
their own consolidator if desired.
No burden on employers.
It may have a distortive impact on
competition in the workplace
pensions market as schemes who
become a consolidator may have a
competitive advantage.
There may be an increased burden
in the process of identifying whether
or not a member already has a
consolidator pot or is already a
member of a consolidator scheme.
The cost of increased
communications with members
around their consolidator scheme
and potential to opt-out, both a
monetary and time cost.
Option 2 - Pot Follows Member
(would also require legislation)
When an employee moves jobs their
deferred pension pot in their former
employer's scheme would
automatically move with them to
their new employer’s scheme, if it
meets the chosen eligibility criteria
for automatic consolidation.
Individuals would have the
opportunity to opt-out and leave
any/all deferred pots where they
are.
This approach could remove a
significant amount of deferred small
pots, which could ease financial
strains on pension schemes.
It would not require active
involvement from the member,
although the member could choose
to opt out of any automatic transfer if
desired.
The simplicity of deferred pots
transferring to a member’s active pot
with their current employer may
result in easier engagement with
pensions.
There is likely to be minimal cost to
taxpayers as a result of this
approach.
The department previously took
primary powers, through the
Pensions Act 2014244
, to implement
pot follows member.
There will be some situations where
this may cause complications and
increase admin burdens, for
example, multiple job holders.
Whilst there are primary powers to
implement pot follows member, this
work was paused due to barriers
which needed to be overcome.
Depending on the final design of a
pot follows member approach, it may
be the case that the current powers
are no longer suitable. It is likely that
further legislation would be required.
As pot follows member makes a link
to the active employer there may be
situations where there is an
increased burden on that employer.
There is a risk, dependent on pot
eligibility criteria, that some
members’ pots may reach the
eligibility pot limit relatively quickly
and the pots therefore become stuck
in the system, resulting in the
member still accumulating deferred
pots – albeit at a greater value.
244
https://www.legislation.gov.uk/ukpga/2014/19/contents
152.
Error! Unknown documentproperty name.
152
A member’s pot could be moved
from a high performing scheme to a
low performing scheme which could
impact member outcomes.
Option 3 - Member Exchange
(alternative to legislation)
Under this option, pension schemes
would use a trusted third-party data
service to conduct a regular
exercise and identify ‘matches’,
where they hold a deferred small pot
for a member who is making active
contributions into a pension with
another of the participating
schemes.
As an industry led solution there
would be no burden on employers.
The small pots where matches
between schemes are established
would be consolidated into a
member’s active pot.
Would likely require government
legislation in order to be an
implemented solution, therefore not a
viable non-legislative alternative.
The small pots in scope would be
limited to just those held by the
schemes involved.
The number of small pots that
members have could continue to
increase if these small pots are
created outside of the included
schemes.
Could become a significant burden
on schemes to identify matches with
other schemes.
75. Based on extensive engagement with industry, listening to member research, consideration
on deliverability, and assessing the implications on competition, the Department has
considered a default consolidator solution as the best way forward to address the issue of
small pots.
Option 0 - Do Nothing
76. The implementation of a solution to address the proliferation of deferred small pots would not
be expected under a do-nothing approach. There is no market-wide consensus amongst
schemes on the best solution to move forward and the issues highlighted below [line 97]
around the member exchange pilot also highlight the difficulty in moving forward solutions to
address the small pots problem without supporting government legislation.
77. Without intervention, individuals would still be able to request their small deferred pots be
transferred and consolidated. However, the onus is placed upon the member to pursue this
and schemes maintain discretion over whether to accept the transfer of any pots. Evidence
suggests member-led consolidation remains low. In 2021, a data gather of providers by
DWP found less than 2% of members with multiple pots were requesting that they be
consolidated.
78. Similarly low levels of consolidation were reported by FCA’s Financial Lives Survey245
which
reported 5% of DC pension holders consolidated their pension pot in the 12 months to May
2022, equating to around 1.1 million members. This was a slight increase in the 3% reported
in 2020, however, at 5%, overall consolidation levels remain low and the figure for small pots
specifically could be even lower due to the low pension engagement of many members with
existing small pots.
79. Findings from Wave 2 of the PPLL survey246
also suggest a relatively low rate of member-led
consolidation. 25% of respondents aged 40-75 with a private pension indicated that they had
consolidated some/all of their pension pots. The focus on adults aged 40-75 could potentially
explain the comparably high % of respondents that indicated they had in some way
245
https://www.fca.org.uk/publication/financial-lives/fls-2022-pensions.pdf
246
‘Planning and Preparing for Later Life 2024, DWP, publication forthcoming’
153.
Error! Unknown documentproperty name.
153
consolidated a pension pot. As those closer to retirement age may be more likely to
consolidate pots as they begin to consider their decumulation options. Further details of the
PPLL survey are discussed in the sections below [line 147].
80. The introduction of the Pensions Dashboard247
, with schemes expected to be connected by
October 2026, may help. This will provide a central location for members to access all their
pension information. However, this will still be reliant upon individuals taking action on a
complex financial decision.
81. FCA is consulting248
on how its proposals under the Advice Guidance Boundary Review249
could be applied to the Pensions landscape and the potential use of targeted support. Whilst
this would not be expected to resolve the small pots issue, it would however be expected to
complement a small pots solution for engaged or engageable savers.
82. Member research suggests members do want their deferred pots to be consolidated but face
numerous barriers in doing so, including being unaware if they could consolidate, the
process is perceived to be difficult and/or would involve high levels of effort and being
unaware on how to consolidate their pension pots. Research suggests broad support for a
solution that supports members with the consolidation of their deferred pots250
. Attempts
have been made to push industry to take on the consolidation of deferred pots but schemes
found this to be challenging and signalled for Government legislation to push this forward. As
a result, this is not a viable option and the number of small pension pots would continue to
rise.
Option 1 – Default Consolidator
83. A multiple default consolidator solution, explained previously [line 58], is the Department’s
preferred option but two other design scenarios for a default consolidator solution were
considered by the Department. These two design options were:
• Single consolidator model (existing scheme) – Under this design, there would be only
one authorised consolidator in which all eligible small pots would be consolidated
into. The consolidator would be an existing scheme, either the chosen consolidator
from those schemes who applied or a “consolidator of last resort” which would be
chosen by the Department’s Secretary of State.
• Single consolidator model (new scheme) – Under this design, there would also be
only one authorised consolidator in which all eligible small pots would be
consolidated into, however, the consolidator scheme would be a new scheme set up
for the sole purpose of being a default consolidator. This scheme would therefore
have no active members and would only be authorised to administer members’
consolidator pots.
84. Having considered the potential for a single consolidator solution, neither design options are
considered as viable solutions by the Department. With the Department, concluding that a
single consolidator solution has the potential to impose significant implications on the
pensions industry.
85. The transfer of the entire stock of small pots at the point of implementation as well as the
entirety of the yearly flow of small pots created each year thereafter would represent a
significant number of small pots to be consolidated within one scheme. The current stock of
small pots is estimated at 13m with an estimated AUM of around £4.3bn. Meaning a single
consolidator at implementation would gain an assets value greater than that of many of the
smaller Master Trust schemes. Potentially undermining the level of competition within the
DC pensions industry, with a specific impact on the trust-based market (where the majority
247
https://www.legislation.gov.uk/ukia/2022/81/pdfs/ukia_20220081_en.pdf
248
https://www.fca.org.uk/publication/consultation/cp24-27.pdf
249
https://www.fca.org.uk/publication/discussion/dp23-5.pdf
250
https://www.gov.uk/government/publications/understanding-member-engagement-with-workplace-pensions/understanding-
member-engagement-with-workplace-pensions#consolidating-deferred-pension-pots
154.
Error! Unknown documentproperty name.
154
of the small pots are). The higher level of transfers that would also be required could
unnecessarily complicate the process and introduce higher ongoing costs.
86. The financial stability of the consolidator scheme could also be impacted due to the loss-
making nature of small pots, with pots below £1,000 largely seen as been uneconomical for
schemes. Absorbing a large number of loss-making pots, such as 13m small pots could be
financially detrimental to any scheme with the need for a large number of profit-making pots
to balance out the large number of loss-making pots, profit making pots that a new single
consolidator scheme would not have.
87. The potential for financial instability and wider impacts on the pension industry as the result
of a single consolidator solution could also impact members, with potential impacts on
member outcomes at retirement if a single consolidator was forced to increase charges to
address the unbalance between loss-making and profit-making pots. A single consolidator
solution would also remove the choice for members to choose their consolidator schemes,
with members instead having to consolidate into the only consolidator scheme unless they
actively pursued consolidation themselves, which is unlikely due to the high level of inertia
around pensions.
88. Therefore, going forward a multiple default consolidator solution is the only option design
that is under consideration by the Department. The distribution of small pots amongst
several consolidators should mitigate the distortive impacts of a single consolidator solution
and drive competition within a pensions consolidator market and help keep schemes
focused on improving outcomes for members.
89. Through the Small Pots Delivery Group, industry was consulted on the potential for a two-tier
approach, which would have seen some schemes apply to be a consolidator only for
members in which they already have a pre-existing relationship with. However, the
Department has decided not to proceed with this approach, with larger schemes indicating
during Delivery Group meetings that a two-tier approach would make authorisation as a
consolidator scheme considerably less viable and increased the risk of schemes not seeking
authorisation to act as a consolidator for the whole of the market. Instead, the focus is on a
single-tier authorisation approach which the Department believes will result in a more
competitive consolidator market that helps to support improved member outcomes.
Option 2 - Pot Follows Member
90. An alternative proposal was for Government to legislate to support a “Pot Follows Member”
(PfM) model which has been explored in depth. Under a PfM model, the Government could
expand on current primary powers (if required) to allow members’ small pots to be
automatically transferred into their active workplace pension scheme as members move
between employments. Under PfM when an individual is automatically enrolled into a new
DC workplace pension scheme, their new scheme would check whether they have an
existing deferred pension pot with another scheme. If they do, any existing pots would be
automatically transferred into the member’s new scheme (providing it meets the chosen
eligibility criteria for automatic consolidation).
91. If an individual left a pension scheme but didn’t commence pension contributions into a new
scheme (for example, due to a period of unemployment or opting out of their new employer’s
scheme), the pension pot would remain deferred until the individual were to recommence
employment and/or pension contributions. Individuals would have the right to opt-out of any
transfer under PfM.
92. The Department also envisages that a Small Pots Data Platform as mentioned above [line
70] would be required for PfM with the need for data standardisation and a central system to
facilitate the transfer of pots between schemes.
• As mentioned previously there is uncertainty around the infrastructure required and
the exact role that a Small Pots Data Platform would facilitate under a multiple default
consolidator solution, the same is the case for the involvement of a Small Pots Data
Platform under a PfM model. Therefore, for the purposes of this IA the same
assumptions around a Small Pots Data Platform have been made across both a
multiple default consolidator and PfM solution, however, in reality there would likely
155.
Error! Unknown documentproperty name.
155
be some deviation between the two solutions, but any differences are unknown with
the role and infrastructure of a Small Pots Data Platform under a consolidator
solution continuing to be explored through the feasibility review [line 70].
93. There are a number of challenges, however, including:
• Moving to a poor performing scheme – As members would be moving between
schemes, depending on who their employer enrols them with, there is a risk that
members’ pots could be moved from a high-performing scheme into a poor-
performing scheme. This should be mitigated, somewhat, over time with the
proposed introduction of the Value for Money framework251
which will ensure all
members are receiving value for money.
o In a consolidated DC market with the implementation of the VFM framework, the
risk of pots being moved from high to low-performing schemes would be expected
to reduce and therefore the extent of the risk altered. The extent to which,
however, would depend on the future changes within the DC market and the VFM
offered by schemes.
• Pot Eligibility – Depending on the pot value threshold set for PfM eligibility, there is
the risk with the continued consolidation of small pots into members’ current active
pots that overtime if these active pots were to become deferred they could have a
value greater than the set threshold and therefore the pots would not be eligible for
consolidation under a PfM model and would remain deferred.
o In some instances, the same could occur under a default consolidator solution but
the risk is thought to be reduced in comparison as multiple deferred pots would
not being combined into an active pot that could subsequently become deferred.
• Liquidity – There could be the requirement for schemes to regularly transfer pots to
other schemes with the potential fast-paced nature of the labour market and the
potential for significant job churn especially for younger and lower-paid individuals
(which are considered more likely to create a small pot). Therefore, schemes may be
required to hold a higher proportion of liquid assets than they otherwise would in
order to facilitate the transfer of a large number of pots up to £1,000 on a regular
basis. This has a number of impacts:
o Schemes may need to hold greater liquidity to manage uncertain cash flows
leaving the scheme, which could potentially impact on investment returns (due to
the ‘illiquidity premium’ – an incremental return that compensates an investor for
owning an asset that is not highly liquid252
). Therefore, as a result, members within
these schemes could experience lower investment returns – this can be shown
through investment returns for younger savers being much greater than those
nearing retirement reflecting a mix of safer and liquid assets. CAPA data
estimated the average 5-year annualised return for a young saver was 8.5%
compared to 5.5% for someone 5 years from retirement253
.
o The impact would depend on the number and speed of transfers required, an
initial limit similar to the £1,000 limit proposed for a default consolidator solution
would help to mitigate the extent to which schemes experience impacts under a
liquidity risk due to the low value of pots being transferred. If the pot limit was to
be uplifted in due course, the impacts of a liquidity risk could become more
pronounced as the value of the pots being transferred increases.
251
https://www.gov.uk/government/consultations/value-for-money-a-framework-on-metrics-standards-and-disclosures/value-
for-money-a-framework-on-metrics-standards-and-disclosures
252
For example see empirical estimation of the ‘illiquidity premium’ by Amihud et al. (2015):
https://www.sciencedirect.com/science/article/abs/pii/S0304405X15000483
253
https://capa-data.com/ca-master-trust-gpp-defaults-report-key-findings/ (CAPA Master Trust and GPP Defaults Report
2024)
156.
Error! Unknown documentproperty name.
156
o The IFS254
considered there was at least some potential for long-term investments
to be hindered as a result of members’ pension pots being moved every time they
move jobs under PfM.
94. Compared with a default consolidator solution, the current stock of small pots has been
modelled by the Department to be dealt with at a slower rate under a PfM solution over the
10-year appraisal period. The respective cumulative reductions in small pots modelled are
shown in Figure 13 (multiple default consolidator) and Figure 16 (PfM).
Option 3 –Member Exchange
95. Under this option, government would support pension schemes in exploring whether bulk
transfers without consent legislation could be used to enable schemes to consolidate
deferred pots into a scheme in which the member is actively saving into. Under this
approach, pension schemes would use a trusted third party pseudonymised data service to
conduct a regular exercise to identify matches where they hold a deferred small pot for a
member who is making active contributions into another pot within a different scheme.
Where a match is identified between schemes, these pots could then be transferred. This
would be an industry-led solution and have minimal to no burden on employers.
96. However, there are significant risks. These includes:
- Burden with constant requirements on schemes to check for “matches” across their
book of members. This would add costs and may increase errors.
- Scope – Not all schemes would take part and therefore the impact on reducing small
pots would be lower compared to a legislated option.
- Consistency – There would be a need to agree a consistent approach across the
industry, which could be hard to reach without government intervening.
97. Several pension schemes have attempted to set up a voluntary pilot Member Exchange trial
to explore the possibility and identify any challenges that may need to be overcome255
. A few
areas were identified which trustees would need to consider for the trial to move forward.
The main areas of concern were summarised within an update in PLSA’s Small Pots Cross
Industry Co-Ordination Group256
:
• Bulk Transfers without consent – Trustees’ fiduciary duty to their members means
a large range of characteristics and scenarios have to be considered in-order to
assess whether any bulk transfer would be within the interest of all members.
• Cost and Charges – Potential concerns were raised over the impact of flat fees if
two pension pots that were previously below £100 when combined had a value
above £100 and therefore could potentially face a flat fee charge. Whilst there was
consensus that broadly the combination of two pension pots should see lower overall
charges for members, there would be the risk of detriment to some members through
higher charges if a flat fee were to be charged.
• Environment, Social and Governance Investment – Wider concerns that pots
could be transferred to schemes that don’t place the same importance on ESG
considerations and the wider issue of the overall quality of service and value for
money that would be offered to members.
• Normal Minimum Pension Age – The Government’s decision to raise the Normal
Minimum Pension Age to 57 in 2028257
could impact members in schemes that offer
an “unqualified right” to take their retirement benefits at a younger age. The
254
https://ifs.org.uk/sites/default/files/2025-02/IFS-Report-Small-pension-pots-problems-and-potential-policy-
responses%20%281%29.pdf
255
https://www.plsa.co.uk/Portals/0/Documents/Policy-Documents/2022/Small-pots-co-ordination-group-spring-2022-report.pdf
256
https://www.plsa.co.uk/Portals/0/Documents/Policy-Documents/2022/Small-pots-co-ordination-group-spring-2022-report.pdf
257
https://www.gov.uk/government/publications/increasing-normal-minimum-pension-age/increasing-normal-minimum-
pension-age
157.
Error! Unknown documentproperty name.
157
movement of members’ pots between schemes could see these members lose their
entitlement to an “unqualified right”.
98. Due to the issues and concerns that arose during the pilot trial it became clear that if
trustees were to move forward with introducing a member exchange solution it would likely
require government legislation to enable trustees to take the required actions.
99. The potentially limited scope could also leave a significant proportion of small pots
unaddressed, and the need for government legislation for an option that was considered as
a non-regulatory industry-led alternative has resulted in the Department concluding that
member exchange would not be a viable solution to the industry-wide proliferation of small
pots.
Costs & Benefits
100. The Department has estimated the potential costs and benefits to industry and
individuals associated with a Multiple Default Consolidator Model and a Pot follows Member
solution.
101. There are no expected monetary benefits of a do-nothing approach with costs to
members and industry expected to be a continuation of the ongoing impacts of small pots
and which have therefore not been monetised, with years of discussion resulting in no
agreed way forward without government intervention.
102. Due to the uncertainty around the scope of a member exchange solution and the
Department’s view that this would not be a viable alternative to a regulatory approach
(though could be complementary), the potential costs and benefits have not been monetised.
Any estimate of the costs and benefits under a member exchange solution would be
dependent on the participating schemes, the scope they decide to apply, and the method
they agree to coordinate matches. This means no estimate of the costs or benefits is
possible.
103. Figure 10 summarises the central estimates of the costs and benefits over a 10-year
appraisal period for each of the policy options considered by the Department to address the
challenge of deferred small pots.
Figure 10 – Summary of the Costs and Benefits (in Present Value258
) estimated for the
considered Policy options
Do Nothing
Neither the costs or benefits to industry or individuals have been monetised
Multiple Default Consolidator (Present Value)
Industry Individual
Familiarisation Costs: £0.2m Consumer Surplus (benefit): £72.7m
Small Pots Data Platform (cost): £212.3m Lower Charges (benefit): £622.1m
Transfer Costs: £194.7m
Pot Administration Savings: £957.7m
Net Benefit: £550.5m Net Benefit: £694.8m
Pot follows Member (Present Value)
Industry Individual
Familiarisation Costs: £0.2m Consumer Surplus (benefit): £49.9m
Small Pots Data Platform (cost): £212.3m Lower Charges (benefit): £311.0m
Transfer Costs: £143.6m
Pot Administration Savings: £785.8m
Net Benefit: £429.7m Net Benefit: £360.9m
258
The costs and benefits are presented here in Present Value form, in 2024 prices, using 2028 as the base year for the
present value calculation for the 10-year appraisal period as in the RPC/DBT Impact Assessment Calculator. Unless stated as
Present Value form, costs and benefits listed elsewhere within this IA have been presented in nominal form.
158.
Error! Unknown documentproperty name.
158
Member Exchange
Industry Individual
Neither the costs or benefits to industry or individuals have been monetised
(Costs are highlighted in red)
Key Assumptions
104. Due to the uncertainty that surrounds the data available around small pots, with
much of the data used being based on estimates a number of key assumptions have been
left constant across the analysis of the viable policy options (Multiple Default Consolidator
and Pot follows Member).
105. Year of Implementation and ongoing Costs and Benefits – For the purposes of
this Impact Assessment the Department has considered 2030 as the earliest feasible
implementation date for a solution to the small pots problem, taking into account further work
needed to finalise any policy specifics and the requirement of a Small Pots Data Platform
which would take time to develop and implement. The exact implementation date would be
dependent on the timetable for supporting primary and secondary legalisation alongside the
above-mentioned factors and others, therefore, the assumption of implementation in 2030
has been used as a realistic possibility to demonstrate the cost/benefits of the policy
proposals to support the Parliamentary debate.
• Transition Costs – The Department considers that the first two years prior to full
implementation (2028-2029/30) will involve the transition costs to industry of the policy
introduction.
• Ongoing Costs & Benefits – Ongoing costs and benefits such as the cost of
transfers and the savings to members have been assumed to commence on an
ongoing yearly basis after implementation in 2030.
• Therefore, this Impact Assessment assesses the impact across a 10-year appraisal
period, in which 2 years of transition costs are estimated (2028-2029) and then the
ongoing costs and benefits are estimated over the subsequent 8 years after the policy
implementation (2030-2037).
• Policy Delivery – The implementation of the policy is assumed to address the stock
of existing small pots in the year of implementation (assumed to be 2030).
• Subsequent years are assumed to address the expected yearly flow of small
pots created during each respective year.
• The consolidation of small pots has been assumed to take place at any point in time
during each yearly period, but before implementation delivery details would need to be
considered.
• Instead of the transfers occurring throughout the year, it could be decided that
there will be chosen point within each year in which all eligible pots would be
consolidated.
106. The Department considers a 10-year appraisal period to be appropriate for this
Impact Assessment due to:
• Pensions having very long-time horizons, for example, a person who enters the
labour market aged 22 will not be able to access this money for another 35 years. As
a result, consideration was given to whether the appraisal period should have been
assessed over a longer timeframe, however:
o Increasing uncertainty – This IA already includes a significant number of
assumptions and uncertainties and by going further into the future would present
even greater uncertainty.
o Establishing the counterfactual becomes harder – The pensions landscape is
constantly changing, therefore the longer the considered timeframe, the greater
159.
Error! Unknown documentproperty name.
159
the likelihood things will naturally change. These effects, however, cannot be
known.
• A 10-year appraisal period is also consistent with the other IAs included as part of the
Pension Schemes Bill which all also use a 10-year appraisal period.
107. Authorisation Costs – To partake in an automated small pots solution, schemes
would likely face authorisation costs levied by the regulators. Any authorisation costs have
not been monetised, partly due to the ongoing uncertainty around what form any
authorisation costs would take with discussions ongoing with the regulators around the
authorisation of consolidator schemes under a default consolidator solution. To apply for
authorisation would be a choice of individual schemes and the Department considers that
only those schemes that project they would see a benefit from seeking authorisation would
do so and therefore for these schemes the benefits presented after authorisation would be
expected to be greater than the costs imposed upon them in the authorisation stages. Under
a multiple default consolidator solution, there is the potential that if the pot limit were to be
uplifted over time, with the Department committed to continually review the eligibility criteria,
that some of the pots consolidated into consolidator schemes could be profitable and
therefore represent a significant benefit to the consolidator schemes. Therefore,
authorisation costs have not been considered as a true direct cost to schemes for this IA.
108. Small Pots Data Platform – The build and implementation costs of a Small Pots Data
Platform are expected to be a significant cost of an automated solution. The fundamental
role of a Small Pots Data Platform would be expected to be similar under both a default
consolidator or PfM solution, therefore the same build and implementation costs of a Small
Pots Data Platform have been assumed across both policy options.
• Whilst it is believed that the costs of establishing an automated solution should be
relatively small in comparison to the long-term benefits of automatically transferring
pots (in terms of reduced administrative burden), at this stage the Department is
unable to present a precise estimate of the transitional costs associated with
developing a solution that facilitates this (including its design and implementation, and
any transitional changes schemes would need to make to their processes and
infrastructure), as well as the ongoing costs of maintaining and updating it.
• Therefore, a combination of international evidence from Australia and the estimated
costs of the implementation of the Pensions Dashboard have been used to estimate
the potential cost of a Small Pots Data Platform.
• Australia’s SuperStream reforms (which included a central mechanism and gateway
platform) took about 4 years to fully develop and had investment costs of an estimated
A$1.5bn259
(£930m260
) over the 2012 to 2018 financial years. However, this was based
on an estimated A$900m (£560m) cost to schemes and A$600m (£370m) cost to
employers. The cost to schemes were borne through levies. Due to differences in the
pension systems, there should be no costs to employers in the UK.
• Initially, Australia projected the costs of implementing the SuperStream reforms to be
A$467m (£280m) over 7 years261
. Of this, about 2/3s of the costs were expected to be
IT-based, the majority of which were expected to be data and e-commerce
standardisation. The initial estimates did also identify savings of £620m each year in
processing costs, averaging £19 across each of the 33 million accounts. The
temporary levy costs were expected to increase costs by less than £3 per account.
• Any solution implemented in the UK, however, is likely to build upon the data
standards used for the Pensions Dashboard – a similar large-scale reform with an
estimated upfront cost to industry of £324m262
. As data standardisation will have
259
https://s3-ap-southeast-2.amazonaws.com/ehq-production-
australia/53e3f6fa82b1a879b47722905068f5e523748c45/documents/attachments/000/062/060/original/SuperStream_Program
_Benefits_Report.pdf?1504139268
260
Based on a A$/£ conversion rate of 0.62 in August 2017.
261
https://ministers.treasury.gov.au/sites/ministers.treasury.gov.au/files/2019-08/SuperStream_factsheet.pdf
262
https://www.legislation.gov.uk/ukia/2023/64/pdfs/ukia_20230064_en.pdf
160.
Error! Unknown documentproperty name.
160
already been necessary for the Pensions Dashboard, it is expected that £324m would
represent the top-end of an estimate for the transitional costs to industry of an
automated transfer system as some data standardisation costs will have already been
incurred. If data standardisation is assumed to account for up to 2/3s of the costs, as in
Australia, that would represent significant savings. There will also likely be some
overlap between the ongoing costs for Dashboard and an automated transfer solution,
such as the costs associated with updating and maintaining data and ensuring
regulatory compliance. The ongoing costs to schemes that are unique to an automated
solution are not fully known at this point, though most are assumed to be captured
within the estimated costs of transfers.
• A transition and build cost of £324m is considered to be a high estimate of the cost of
a Small Pots Data Platform, with the Department’s current best estimate being £216m
with 2/3s of the cost being for data standardisation & processes (£144m) and 1/3 for
the build of a Small Pots Data Platform (£72m). Engagement with industry has
suggested that, due the Pensions Dashboard programme, much of the data
processing that would be required has already been done - therefore lowering the
required costs of a Small Pots Data Platform. This is estimated to account for a saving
in the region of one-third of the total cost of implementing a Small Pots Data Platform,
therefore representing a reduction from £324m to our best estimate of £216m. This
central estimate is highly uncertain and will be dependent on the specification of a
Small Pots Data Platform. Nevertheless, at this point in time, based on the very limited
evidence, this is the best available information to inform the cost until further policy
details emerge.
o Data Standardisation – For the purposes of this IA any additional costs around a
Small Pots Data Platform have not been monetised or estimated largely due to the
uncertainty around any additional costs. It is possible that schemes do face
additional costs as a result such as increased communication costs to explain the
process to members and broader costs outside of data standardisation.
o With the assumption that significant costs savings could be leveraged through the
data standardisation that has already occurred for the Pensions Dashboard, the
central estimate of £144m data standardisation cost is thought to also cover any
additional costs that schemes would face as a result of the implementation of a
Small Pots Data Platform, however, this cost does remain inherently uncertain.
• For the IA it is assumed that the central estimate of £216m is split evenly across the 2
years of transitional costs (2028-2030) and is a cost to schemes. The data
standardisation costs would be the costs to schemes in-order to meet the
requirements to facilitate the transfer of pots alongside the Small Pots Data Platform.
More detail on this is discussed below [line 127].
109. Opt-Out – Members can choose to opt-out of the policy, but it is expected that any
opt-out would remain low and an opt-out rate of 3.5% has been assumed. Given the
relatively low value of the pension pots being moved, and that individuals have already not
opted-out of AE in order to create the small pot, it is expected that the opt-out rate would be
lower than that for automatic enrolment which varies around 8-10%263
. This assumption is
supported by a range of other evidence including:
• International Evidence – Australia’s stapled pot model, which sees members keeping
the same pension pot across their working lives, found just 3.5% of assets in the
Australian pension market switch schemes each year264
(i.e. a member has decided to
change which pension scheme their contributions are paid into).
263
https://www.gov.uk/government/statistics/ten-years-of-automatic-enrolment-in-workplace-pensions/ten-years-of-automatic-
enrolment-in-workplace-pensions-statistics-and-analysis
264
https://corporate-adviser.com/australia-pensions-special-pot-for-life-a-model-for-the-uk/
161.
Error! Unknown documentproperty name.
161
• Default Arrangement – TPR data265
shows that just less than 97% of total
memberships (where a default arrangement is both available and known) are within
default funds, leaving just less than 3.5% of memberships outside of schemes’ default
funds. As the consolidation of small pots would not involve any active changes in
contributions but rather see the movement of members’ pots between schemes, the
level of members opting out of default funds is considered a useful proxy.
• Current Consolidation Levels – Members who currently consolidate their pension
pots themselves may opt-out of an automatic solution in-order to remain in-control of
the consolidation of their pension savings. As referenced previously [line 78], member-
led consolidation remains low between 3-5% in recent years266
.
110. Matching Rate – Low engagement with pensions can result in poor data quality, with
members’ data quickly becoming outdated as they move between employments, etc.
Therefore, it is assumed that in some instances not all of the small pots eligible for
consolidation would be able to be matched to an individual and instead would result in a
mismatch, where the data available does not sufficiently match that held on record by
schemes and therefore the transfer cannot occur securely. As part of the Small Pots Delivery
Group a stringent matching criteria was recommended to ensure the accuracy of the
transfers of pension pots, and it is this criteria that has been used as the basis for a
matching rate assumption.
• Primary data set: First name, Surname, Date of Birth and NINo
• Supplementary data set: Mobile Number, Email Address and Previous Addresses
and Post Codes.
• Evidence and research around a matching rate between pensions pots and members
is limited but the Department has called upon a number of research reports to build
up a matching rate assumption.
• PLSA’s Small Pots cross-industry co-ordination group267
included analysis
conducted by ITM on the probability that a pension pot would be matched to a
member correctly based on a selection of data items. The research distinguished
between whether a correct match would be made and then whether a correct match
was likely to actually occur. Based on the criteria: NINo, Surname, DoB and First
Name, the research concluded a 91.6% chance of a correct match, with a 90.5%
chance it would occur. The report concluded that “forming conclusions… for the
likelihood of mismatches… is statistically challenging, anything like a 9% chance of a
mismatch may be too high to provide assurance”268
.
• Initial findings from PPI’s Data Project269
show that over the last 5 years, the data
supplied was consistent and to a high degree of accuracy and quality. The findings
also suggest that combining data across schemes should result in many exact
matches being made. 85% of good matches were classified as an exact match.
There was also a large number of partial matches (47% of potential matches in 2022)
that would require further verification for a match to be made.
• If a correct match was not achieved, the Small Pots Data Platform would work with
schemes to undertake further tracing to update member records, with a requirement
on schemes throughout to ensure that member data is kept up to date. The
265
https://webarchive.nationalarchives.gov.uk/ukgwa/20240605050724/https://www.thepensionsregulator.gov.uk/en/document-
library/research-and-analysis/occupational-defined-contribution-landscape-2023/occupational-defined-contribution-landscape-
2023-annex
266
https://www.fca.org.uk/publication/financial-lives/fls-2022-pensions.pdf
267
https://www.plsa.co.uk/Portals/0/Documents/Policy-Documents/2021/Small-pots-cross-industry-co-ordination-group-update-
report.pdf
268
https://www.plsa.co.uk/Portals/0/Documents/Policy-Documents/2021/Small-pots-cross-industry-co-ordination-group-update-
report.pdf
269
https://static1.squarespace.com/static/5d88d0560f00b11d45ecc14e/t/67ab67b59770e3017c018071/1739286456765/202502+P
DP+Lessons+Learned+matching+provider+data.pdf
162.
Error! Unknown documentproperty name.
162
Department continues to work with HMRC to assess the possibility of accessing
HMRC data for the purposes of improving data matches. The matching programme
under a small pots consolidator would likely build upon that of the Pensions
Dashboard and therefore a similar mismatch rate may be expected. A report by
Pension Fusion270
continued to attempt matches with those pension records that
were not matched in the original matching exercise. Over 10 tests with differing data
criteria, an overall mismatch rate of below 1% was reached.
o The Pensions Data Project271
reported 10.1m bad matches, an average of 0.44
bad matches per member, but the anonymous nature of the member records
involved meant that no further verification using additional data was possible.
• Based on these sources and the assumption that matching rates should improve
over time a central assumption of a 5% mismatch rate has been used. Accounting
for previous research such as that conducted by ITM and the research that suggests
that correct matches can be made after further matching attempts. Therefore, a mid-
point of 5% between 1% and 9% has been taken as a central estimate.
• As with any automated solution that would involve the transfer of members’ pension
pots there is a potential risk of members’ pots becoming lost or an incorrect match
being made, resulting in a pension pot being matched and transferred to the wrong
member. The Department has worked with industry (as part of the Small Pots
Delivery Group) and continues to do so to formulate the best procedures to address
these potential issues.
o The Department plans to ensure that the appropriate compensation is available
to members – discussions are ongoing around how this should be funded and
how it would be administered and managed
o The rate of incorrect matches occurring is expected to be low, with a very high
standard of matching expected by schemes with initial findings from PPI’s Data
Project finding a low risk of wrong matches being made based on a strict
matching criteria and overall good quality data records across the schemes
involved272
.
o The mismatch rate represents an assumption of the number of pots that would either
be transferred to the wrong member (which is expected to be minimal) and those
pots that cannot be transferred either due to insufficient member data available or the
available data being of insufficient and poor quality.
111. Both the opt-out and mismatch rate assumptions have been modelled on a per pot
basis rather than being applied on a per member basis by using the average number of pots
per member (referenced below, [line 114]). This is due to a number of reasons including:
• There is inherent uncertainty about the behaviour of individuals when it comes to the
decisions around opting-out, it could be that an individual would continue to opt-out in
the future for each small pot they accrue. Alternatively, this may not be the case and
an individual may only opt-out of the consolidation of one of their multiple small pots
over their working lives. Be this due to particular reasons to keep a certain small pot
within its existing scheme, forgetting to or not engaging to opt-out.
• Any mismatches of pots would not be individually linked and would likely be a result of
the quality of data held previously by employers or by pension schemes. Therefore,
the likelihood of a pot being mismatched should not increase for members who have
270
https://www.pensionfusion.com/sites/default/files/2022-
09/Pension%20Fusion%20-%20Pensions%20Dashboards%20-%20Getting%20to%20the%20heart%20of%20matching%20-%
20Single%20page%20view.pdf
271
https://static1.squarespace.com/static/5d88d0560f00b11d45ecc14e/t/67ab67b59770e3017c018071/1739286456765/202502+P
DP+Lessons+Learned+matching+provider+data.pdf
272
https://static1.squarespace.com/static/5d88d0560f00b11d45ecc14e/t/67ab67b59770e3017c018071/1739286456765/202502+P
DP+Lessons+Learned+matching+provider+data.pdf
163.
Error! Unknown documentproperty name.
163
already experienced the mismatch of a different small pot within a different scheme if
they provided the required data to employers or schemes.
o There is the possibility that some members be it due to characteristics or
engagement with their pensions may be more prone to a mismatch of their small
pots, however, the impacts or existence of such a link is unknown and therefore
cannot be considered within this assumption by the Department.
• Therefore, the opt-out and mismatch rates are applied on a per pot basis to account
for potential changes in member opt-out behaviour and the uncertainty about any
resulting mismatches.
112. Administration Costs – It is assumed that the marginal costs of administrating a
small, deferred pension pot (and in turn the saving from no longer having to) is £20 per
annum. This figure is based on provider data from the Department’s recent 2024 data
gather. These findings gave a range that was largely between £10-£30, therefore a midpoint
of £20 has been taken as an estimation. This aligns with the Department’s previous 2023
Call for Evidence273
where provider data ranged between £5-£75 per annum, with a potential
breakeven point around a pot value of £4,000. With an average AMC close to 0.5% across
DC schemes, 0.5% of £4,000 would give a breakeven point around £20. As a result, a lower
estimate of £10 and a higher estimate of £30 have been presented in sensitivity analysis of
the costs and benefits of a multiple default consolidator solution [Annex B].
113. The midpoint of estimates from industry data have remained similar over time and
therefore administration costs are not assumed to change over the 10-year appraisal period,
with the fixed costs of administering a small pot not expected to change significantly or be
impacted as a result of a consolidator solution.
• As consolidator schemes grow in scale in terms of memberships, the average fixed
administration costs per pot could fall. However, it is not possible to know how the
scale of the consolidator schemes may grow (with uncertainty over the number of
consolidator schemes among other factors) and therefore any potential impact of this
cannot be accounted for.
114. Multiple Pots – Assumptions on the proportion of members that are expected to
have multiple (more than one) deferred small pots are based on DWP’s analysis of findings
from ONS’ Wealth and Assets Survey274
. The Wealth and Assets Survey (WAS) is based
upon self-reported findings from individuals and therefore, especially due to the inertia
around pensions there is the potential for individuals to undercount the number of deferred
pension pots they may have. The Department considers this to be the best estimate
available around the number of deferred pension pots per individual. Early findings from
PPI’s Data Project275
suggest an average of 1.3 memberships per individual across the five
schemes involved, matching the 1.3 (rounded to the nearest Tenth) pots per individual
estimated from findings from WAS Round 8 (2020-2022).
• The number of members that were identified within the Pensions Data Project276
across multiple schemes increased from 14% in 2019 to 18% in 2022.
115. Communication Costs – The increased transfers of pension pots could increase the
costs to schemes in relation to communications. The transfer process could include a
number of communications to be sent such as informing members of the transfer and
273
https://www.gov.uk/government/consultations/ending-the-proliferation-of-deferred-small-pension-pots/ending-the-
proliferation-of-deferred-small-pots#:~:text=Summary%20of%20responses,-
8.&text=The%20majority%20of%20respondents%20agreed,growth%20of%20deferred%20small%20pots.
274
https://www.ons.gov.uk/peoplepopulationandcommunity/personalandhouseholdfinances/debt/methodologies/wealthandassetss
urveyqmi
275
https://static1.squarespace.com/static/5d88d0560f00b11d45ecc14e/t/67ab67b59770e3017c018071/1739286456765/202502+P
DP+Lessons+Learned+matching+provider+data.pdf
276
https://static1.squarespace.com/static/5d88d0560f00b11d45ecc14e/t/67ab67b59770e3017c018071/1739286456765/202502+P
DP+Lessons+Learned+matching+provider+data.pdf
164.
Error! Unknown documentproperty name.
164
requesting if the member would like to opt-out or choose a consolidator scheme (under a
consolidator solution). This could therefore increase the overall communication costs
involved for schemes. It is expected that these increased costs would be offset by a
reduction in communication costs elsewhere through the reduction in small pots over time.
Any improvements in engagement as a result of consolidation could improve digital
engagement and therefore further reduce the need for paper communications which
represent a significant cost over digital communications.
• Any communication costs experienced within the transition period and particularly
those around the set up of the Small Pots Data Platform are assumed to be covered
by the estimated £144m data standardisation costs, this is explained further
previously [line 108].
Option 0: Do Nothing Costs & Benefits
Costs and Benefits to Industry
116. Without intervention to address the issue of small pots there would be no additional
costs or benefits to schemes or members. Evidence shows that over 10 years from 2028-
2037 the number of small pots will likely rise from around 18m to close to 30m without
intervention based on the current central estimates for the rate of yearly growth [line 128].
117. Based on the average small pots value of £330 being charged the average AMC
across Qualifying bundle schemes of 0.48%277
- this would mean schemes would be
generating £1.58 per pot each year, against an estimated administration cost of around £20
[line 112]. Meaning potential losses of over £18 per small pot each year.
118. The Department estimates that across existing pots below £1,000, industry costs are
already close to £240m a year, with the Small Pots Cross Industry Co-Ordination Group
estimating that “the proliferation of small, deferred pensions by 2030 will likely result in
wasted administration costs of around a third of a billion pounds per annum”278
. By 2038,
without intervention this could mean losses above half a billion pounds per annum, a
significant cost burden on schemes.
119. Combining the already high levels of industry losses as a result of small pots
alongside the high level of individual inertia around pensions (preventing individuals from
requesting their pots be consolidated) and the potential expansion of automatic enrolment to
18-21 years olds279
industry losses could continue to rise even further with the potential for
the pensions landscape to be further inundated with the creation of small pots.
Costs and Benefits to Individuals
120. The AMC levied upon the majority of small pots is not enough to cover the
administration costs borne by schemes and this would be expected to continue with no
intervention. To address this, many members with larger pension pots are effectively
charged higher fees to cross-subside the loss-making nature of small pots. Higher charges
reduce the value of members’ pension pots and results in poorer retirement outcomes. It
could be expected that as the number of small pots continued to grow this problem becomes
increasingly exacerbated.
121. The introduction of the Pensions Dashboard280
will provide an online platform for
members to centrally access their pensions information, in the hope to address low
engagement. The expected level of engagement with Dashboards remains uncertain and as
277
https://www.gov.uk/government/publications/pension-charges-survey-2020-charges-in-defined-contribution-pension-
schemes/pension-charges-survey-2020-charges-in-defined-contribution-pension-schemes#member-borne-charges-within-the-
cap
278
https://www.plsa.co.uk/Policy-and-Research/Document-library/Small-pots-cross-industry-co-ordination-group-Spring-2022-
report
279
https://commonslibrary.parliament.uk/research-
briefings/sn06417/#:~:text=A%20review%20of%20the%20policy,changes%20in%20the%20mid%2D2020s.
280
https://www.pensionsdashboardsprogramme.org.uk/
165.
Error! Unknown documentproperty name.
165
Dashboard would not be a tool to enforce consolidation, the impact of its implementation
upon consolidation is therefore unknown.
122. The Pensions Dashboard should help to re-unite members with their lost pots, as
whilst members can currently use the Pensions Tracing Service to trace any lost pots, the
Pensions Dashboard should display all pots belonging to a member including any lost pots
within a central online infrastructure. Therefore, this has the potential to reduce the number
of lost pots that need to be found at the point of decumulation and could potentially have
some impact on member-led consolidation figures. All this could make it easier for engaged
members with lost pots to make pension decisions and improve the experience for members
at the point of decumulation.
• Prior to the implementation of the Pensions Dashboard, the suggestion is that use of
the Pensions Tracing Service is low. Findings from Wave 2 of the PPLL survey281
,
discussed below [line 147], suggest only 3% of all respondents aged 40-75 had used
the Pensions Tracing Service in the past 12 months or had checked for lost pension
pots. A potential indicator that wider pensions engagement remains low.
Option 1: Multiple Default Consolidator (preferred option) Costs &
Benefits
123. It has been assumed that all deferred small DC pots created since and as a result of
AE are in scope, and that all DC workplace pension pots below the pot size limit of £1,000
are automatically transferred (minus 3.5% opt-out and mis-match rate of 5%).
124. Figure 11 summarises the costs and benefits estimated under a Multiple Default
Consolidator Solution.
Figure 11 – The estimated monetised costs and benefits to industry and individuals
of a Multiple Default Consolidator Solution
Multiple Default Consolidator
Industry Individual
Familiarisation Costs: £0.2m Consumer Surplus (benefit): £81.0m
Small Pots Data Platform (cost): £216.0m Lower Charges (benefit): £805.8m
Transfer Costs: £215.0m
Pot Administration Savings: £1,168.3m
Net Benefit: £737.2m Net Benefit: £886.9m
Costs to Industry
125. The Department expects there would be a number of costs to industry as the result of
the implementation of a Multiple Default Consolidator solution.
126. Familiarisation costs – These are the costs incurred by schemes to understand and
comply with the new regulations and would form part of the transition costs to industry prior
to implementation. The Department’s estimate of the familiarisation costs covers the time
and cost of staff for schemes to familiarise with the multiple default consolidator legislation,
including reading through the legislation documents and undertaking a gap analysis (to
recognise the requirements to comply with the new legislation).
• The assumptions of the costs to schemes of familiarising with the new legislation are
based on the FCA’s cost-benefit analysis on Investment Pathways with some
adjustments to account for the trust-based market282
. This was based on a survey of
around 70 pension schemes and supplemented with FCA’s wider evidence on costs
281
‘Planning and Preparing for Later Life 2024, DWP, publication forthcoming’
282
https://www.fca.org.uk/publication/consultation/cp19-05.pdf
166.
Error! Unknown documentproperty name.
166
of compliance, thereby giving confidence in the estimates and wide-spread market
coverage. This estimated:
o The policy documentation to be 40 pages which would take around 2 hours to
read. Given both proposals are focused on the pensions industry and the current
uncertainty over the length of any legislation for a multiple default consolidator
solution it is assumed that the proposed multiple default consolidator legislation
would be of a similar length. The Department has presented the impacts of a
reduction and increase in the number of legislative pages within the sensitivity
analysis [line 246].
o Based on TPR input, the average number of trustees per pension scheme is
assumed to be around 3 and the average hourly wage of each trustee, using
ONS ASHE data, is assumed to be around £36.51.
• This has then been scaled up across the whole market based on the Department’s
estimates on the number of DC workplace schemes in 2028. With current
consolidation expected to continue at a similar rate of around 12%283
, the number of
schemes is estimated at under 700 in 2028, down from around 1,110 in 2024284285
.
Therefore, a total familiarisation cost of around £189,000 is estimated, after a 25%
optimism bias is applied.
127. Small Pots Data Platform – As referred to above [line 108] the Department has
estimated the costs of the build and set-up of a Small Pots Data Platform that would help
facilitate the consolidation of small pots to be £216m over the 2 years of transition costs.
There may be alternative approaches taken after further feasibility analysis is undertaken;
though the Small Pots Data Platform is currently the most developed concept. The cost
profile could be different depending on delivery models. For the purposes of this IA, it is
assumed that the build costs of a Small Pots Data Platform would be directly funded by the
pensions industry. Therefore, in this IA the costs of a Small Pots Data Platform have been
classified as a direct cost to business.
128. Transfer Costs – The cost of transferring deferred small pots for consolidation is
considered a significant ongoing cost to industry. The estimated transfer costs across the
10-year appraisal period of £215m are based on the cost of transferring the current stock in
the year of implementation and then the yearly creation of small pots in the following years
thereafter. In the initial year of implementation, the number of transfers required is based on
the Department’s projected number of small pots expected in 2030 (more detail below).
• Cost of Transfer per pot – The cost of a transfer pot has been estimated at an initial
cost of £20 per pot (£10 cost for both the ceding and receiving schemes). The
Department has assumed that over time the costs of transfers will begin to fall, with a
reduction in costs expected from year two after implementation falling by £2 per
transfer to a total cost of £18 by 2031. Transfer costs are then expected to continue
falling by £2 each year until year four (2033) after implementation where costs are
assumed to have fallen to £14 per pot which is the assumed total cost for each
transfer in the following years of consolidation modelled within the 10-year appraisal
period.
o Initial costs of £20 per transfer are based upon provider data, similar to the cost
estimates of administration costs mentioned previously. Figures from the
Department’s 2024 data gather largely varied between £20-£40 per transfer, which
aligned with previous figures from the Department’s 2023 Call for Evidence which
283
https://webarchive.nationalarchives.gov.uk/ukgwa/20240605045559/https://www.thepensionsregulator.gov.uk/en/document-
library/research-and-analysis/occupational-defined-contribution-landscape-2023
284
https://www.fca.org.uk/publication/consultation/cp24-16.pdf
285
https://webarchive.nationalarchives.gov.uk/ukgwa/20240605045559/https://www.thepensionsregulator.gov.uk/en/document-
library/research-and-analysis/occupational-defined-contribution-landscape-2023
167.
Error! Unknown documentproperty name.
167
varied between £15-£40. These costs are based on the existing transfer processes
which are typically case-by-case and can be labour intensive.
o Evidence suggests that these costs should fall by the point of implementation and
as a result of a consolidator solution:
❖ Automation – As the current cost of transfers are largely based on
manual administration time, there is an expectation from stakeholders
that transfer costs will fall as the process becomes more automated.
In responses to the data gather the majority of providers indicated
they expected transfer costs to decline in the next 3-5 years with
improved automation cited as a significant factor in any reduction.
❖ Economies of Scale – Bulk transfers are considered as a vital
mechanism to the lower transfer costs under a consolidator solution
with the potential for significant costs savings to be realised
compared to singular pot transfers. Responses from industry
suggested that costs could be expected to fall below £10 with some
estimating automated transfer costs in the range of £3-£7 as a result
of automated transfers. Some responses even quoted cost savings
per pot through bulk transfers of between 50-80% in comparison to a
singular pot transfer.
❖ Lessons from abroad – In Australia transfers are fully automated
and can be done online in less than three minutes at a cost of around
$20-30 AUD (c£11-£17).286
It’s unlikely that costs would initially be as
low as those in Australia due to their transfer systems and processes
being more mature and refined.
o Based on the above evidence the assumed transfer costs are considered
appropriate, with consensus across industry responses that transfer costs are
falling and the potential for automated bulk transfers to significantly reduce costs.
With costs expected to decline to £7 per scheme (£14 per transfer) considered a
conservative estimate at the upper end of some of the estimated costs of
automated transfers and comparable with similar transfers undertaken in Australia.
• Volume of Small Pots – Evidence from providers (via data gathers) and analysis of
stopping saving levels (via HMRC’s RTI data) enables projections to be made of the
future creation of small pension pots. Figure 12 shows the projected number of small
pots up to 2037 based on a low, central and high estimate of yearly growth. Figures
for the number of small pots in 2023 and 2024 are based on previously mentioned
provider data, with an estimated 13m small pots in 2024.
286
https://www.abi.org.uk/globalassets/files/publications/public/lts/2022/small-pots-co-ordination-group-spring-2022-report.pdf
168.
Error! Unknown documentproperty name.
168
Figure 12 - Projected number of deferred pots worth less than £1,000 (2024 Earnings
Terms) without intervention
Source: Projections based on provider data from DWP’s Data Gathers and Call for Evidence
and DWP analysis of HMRC RTI data
o The ‘Low Estimate’ is a continued growth of 1m small pots per year, based on the
first 12 years of automatic enrolment and the current known number of pots
below £1,000. This is considered as the low-end of estimates because the period
to date includes the staggered roll-out of AE and the atypical pandemic period.
Under this estimate, without intervention, there would be 26m pots worth less
than £1,000 by 2037 (2024 Earnings Terms).
o The “High Estimate” is a growth of 1.6m small pots per year, aligning with the
number of instances of people who stopped contributing to a pension in 2021/22
which are estimated to have created a pension pot worth less than £1,000. This
also reflects potential future expansion of AE, via the proposed expansion to 18-
21 year olds, which may increase the number of pots and rate at which pots are
created (as they are likely to experience shorter periods of employment and lower
pay)287
. The IFS suggests that younger employees, lower earners and women
are more likely to accumulate new DC pension pots288
. Those in the lowest
earning band of our analysis of HMRC data are estimated to have accounted for
around 60% of the small pots created by cessation in pension contributions in
2021/22. Under this estimate, without intervention, there would be 34m pension
pots worth less than £1,000 by 2037 (2024 Earnings Terms).
o The “Best Estimate” is a growth of 1.3m small pots each year, factoring in that
although the responses to the Department’s data gathers and call for evidence
were largely representative, there will have been additional small pots created
outside of the 13m covered by the responding providers to the 2024 data gather.
❖ Historical data from providers shows that the number of small pots
has been growing by around 1m a year between 2020-2024 and
looking wider since the introduction of AE the Department estimates
the proliferation of 13m small pots, which averages to around 1.1m
small pots created each year over the first 12-years of Automatic
Enrolment. As mentioned above this trend of around 1m small pots a
287
https://minimumwage.blog.gov.uk/2020/03/09/why-do-young-people-have-lower-minimum-wages/
288
https://ifs.org.uk/sites/default/files/2025-02/IFS-Report-Small-pension-pots-problems-and-potential-policy-
responses%20%281%29.pdf
0m
5m
10m
15m
20m
25m
30m
35m
40m
2023 2024 2025 2026 2027 2028 2029 2030 2031 2032 2033 2034 2035 2036 2037
Low Best High
169.
Error! Unknown documentproperty name.
169
year is based upon provider figures provided to the Department and
therefore whilst the data does encompass the majority of the largest
schemes in which the issue of small pots is thought to be
concentrated within, there will be inevitably a number of small pots
that have been and will be created each year outside of the schemes
encompassed within the data available to the Department.
❖ RTI data from HMRC has therefore been used as a complimentary
data source to bridge the under-representation of schemes within the
Department’s data. RTI data can confirm the rate in which individuals
have stopped saving into a pension pot, with the Department using
data across 2020-2022 to estimate the number of stopped saving
instances that would have likely resulted in a small pot being created.
RTI data is able to cover instances of small pots being created
outside the largest schemes with NINos (National Insurance
Numbers) used to track the months individuals are contributing into a
workplace pension.
❖ Analysis of RTI data suggests around 1.5m small pots are created
every 12 months, however, the RTI data doesn’t contain pension
wealth information and therefore may be a slight overestimate as
relies on 2 key assumptions:
❖ Those stopping saving do not subsequently save again into the same
pension pot within the 12-month period.
❖ Earnings are assumed to be in line with upper banded earnings289
of
the data and savings in-line with AE minimum contributions of 8%290
(minus lower level of qualifying earnings291
)
o In response to the potential overestimation of the RTI data and the
underestimation of the Department’s estimates based on provider data, an
average between the two data sources has been taken which equates to around
1.3m small pots created each year.
o Under this estimate, without intervention, there would be 30m pots worth less
than £1,000 by 2037 (2024 Earnings Terms) and at implementation of 2030 the
number of small pots is estimated to be around 20.8m small pots.
• As mentioned previously, the Department recognises that the small pots figures gathered
as part of the 2023 call for evidence and 2024 data gather do not cover the entirety of
the DC market and therefore do not represent the entire number of current small pots,
but the Department considers the estimate of 13m in 2024 to be the best estimate
available.
o Therefore, it is this estimate to which the yearly flow of 1.3m small pots is added
to each year and forms the basis for the calculation of small pots at the point of
implementation. The yearly flow of 1.3m small pots figure looks to account for the
missing data from smaller schemes on a yearly basis and therefore it was
deemed most appropriate to use the Department’s current best estimate of 13m
small pots as the starting point for the projected number of small pots by
implementation.
o The implications of not accounting for additional small pots outside the current
stock estimate of 13m are thought to be limited with the majority of small pots
expected to have been captured in the data provided to the Department by
289
Earning bands are as follows: £10,000 - £19,999, £20,000 - £29,0000, £30,000 - £39,999, £40,000 - £49,999, £50,000 -
£59,999, £60,000+ (assumed to earn £69,999)
290
https://www.gov.uk/government/publications/automatic-enrolment-review-of-the-earnings-trigger-and-qualifying-earnings-
band-for-202324/review-of-the-automatic-enrolment-earnings-trigger-and-qualifying-earnings-band-for-202324-supporting-
analysis
291
https://www.thepensionsregulator.gov.uk/en/employers/new-employers/im-an-employer-who-has-to-provide-a-
pension/declare-your-compliance/ongoing-duties-for-employers-/earnings-thresholds
170.
Error! Unknown documentproperty name.
170
industry, with the small pots problem believed to persist largely within the larger
Master Trust schemes.
129. Existing Consolidator Schemes – Currently within the DC pensions market, some
schemes already offer consolidation services to members. With the business model of some
schemes focused on consolidating pots into one pot within their scheme. The introduction of
a multiple default consolidator solution that would be free to members could have an
implication on these schemes. The potential implications have not been monetised, but the
impact is expected to be minimal, with the pot limit of £1,000 meaning only those pots that
are currently unprofitable would be within scope of a consolidator solution, pots that are
unlikely to be those targeted by the existing consolidator schemes. Evidence also does show
that existing consolidation levels remain low, further discussion around the potential impact
on existing consolidator schemes is discussed below [line 240].
Costs to Individuals
130. A significant benefit of a Multiple Default Consolidator solution is that the Department
does not consider there to be any cost to employees as the solution would be addressing
pots that have been deferred for at least 12 months and therefore are no-longer receiving
any employer or employee contributions.
131. The consolidation of members’ deferred small pots under a default consolidator
solution would be free of charge and therefore there would be no direct costs to members
involved in the process of consolidation.
132. Risk of schemes passing on costs – The costs of a Small Pots Data Platform are
likely to represent a significant cost to industry and therefore there is a risk that some
schemes could mitigate against these costs by passing them on to members through higher
charges. On balance, the risk of this is considered low given:
• Schemes compete heavily on charges, with the average charge well below the charge
cap of 0.75%292
- so are unlikely to raise charges as would risk becoming
uncompetitive.
• The costs of a Small Pots Data Platform are likely to borne across the pensions
industry – reducing the average cost to each scheme and therefore reducing the need
for individual schemes to offset any costs through increased member charges.
• Small pots are currently loss-making, so the expectation is that in in the long-term
schemes will benefit from the consolidation of small pots even when considering the
cost implication of a Small Pots Data Platform and therefore cost savings should
mitigate against the need to recoup increased costs through member charges.
• Given that price-setting is commercially sensitive and challenging to estimate as well
as the downward pressure on charges across the pensions industry it is assumed that
any increase in costs would not be passed on to members.
133. Charges – There is the risk to members of their pots being moved to a scheme with
higher charges and/or lower investment returns. However, given the authorisation regime to
become a consolidator scheme, VfM framework293
and other mitigations including the 0.75%
charge cap294
and the de minimis295
– members are unlikely to face detriment as a result of a
consolidation solution.
134. Whilst the de minimis protects the smallest pension pots from flat fees, there is the
potential for some members to be disadvantaged, with the combination of numerous very
small pension pots. Schemes are currently unable to charge flat fees on pension pots below
£100, however, if when consolidated a member’s small pots had a combined value greater
292
https://www.gov.uk/government/publications/pension-charges-survey-2020-charges-in-defined-contribution-pension-
schemes/pension-charges-survey-2020-charges-in-defined-contribution-pension-schemes#member-borne-charges-within-the-
cap
293
https://www.fca.org.uk/publication/consultation/cp24-16.pdf
294
https://assets.publishing.service.gov.uk/media/61d823e3d3bf7f053fd8254e/charge-cap-guidance.pdf
295
https://www.gov.uk/government/consultations/permitted-charges-within-defined-contribution-pension-schemes/permitted-
charges-within-defined-contribution-pension-schemes
171.
Error! Unknown documentproperty name.
171
than £100 this pot could now face a flat fee from some schemes. Resulting in a flat fee being
charged on a pension pot of minimal value, increasing the risk of the pot being eroded over
time.
• The impact of this is thought be largely outweighed for most members through the
benefits of consolidation and the Department is considering the level of the
deminimis, for consolidated members, which would reduce the number of members
facing flat fees, but any change is yet to be decided.
Costs and Benefits to Employers
135. The Department does not anticipate there to be a cost to employers as the result of
the consolidation of small pots as the consolidation process under a multiple consolidator
solution would be separate to employer interactions with employees’ workplace pensions.
The process of consolidation will be the responsibility of the pension schemes and supported
by the Small Pots Data Platform and would require no input from employers as only deferred
pots would be within scope.
• Employers would not be involved in the consolidation process under a multiple
default consolidator solution.
136. As the Policy details are still to be finalised, whilst employers will have no direct role
in the consolidation process the Department is considering increasing the duties on
employers in terms of updating member records and adding email addresses for example
where appropriate to support the consolidation process. If decided on, there is the potential
for some minimal administrative cost on employers as a result. Any increase in costs
experienced by employers would be to improve member records across the industry and not
necessarily specific to a consolidator solution.
Benefits to Industry
137. The consolidation of small pots will result in a reduction in the number of pots having
to be administered across the DC workplace pensions market and with the majority of these
small pots expected to be loss-making to schemes the Department considers this reduction
in administration costs as a result to be a significant benefit to schemes.
• For schemes transferring out small pots, the reduction in administration costs as a
result should outweigh the estimated transfer costs per pot [line 128].
138. The reduction in the number of pots that schemes have to administer as a result of
the consolidation of small pots will represent a reduction in total administration costs. As
previously referenced [line 112], the average administration cost of a deferred pot has been
estimated at around £20 per pot and therefore once accounting for the estimated charge that
would’ve been applied to each of these deferred pots (average value * average % AMC) this
is the assumed saving benefit to industry of the cumulative reduction of each small pot. With
each reduction in the number of pots representing a cost saving of around £18 per pot
reduced per year. The benefits are compounded each year with a reduction in one year
representing a saving in the following years compared to a do-nothing approach where the
assumption is that the scheme would have continued to administer the small pot as member-
led consolidation is unlikely.
139. The Department’s modelling of the impacts of the introduction of a Multiple Default
Consolidator solution which are modelled in Figure 13 below, calculates the projected costs
and benefits of the transfer process and the reduction of small pots through consolidation. It
should be noted that the modelling doesn’t account for transition costs, but these have been
monetised previously, instead it focuses on the costs and benefits of the transfer process
involved after implementation.
172.
Error! Unknown documentproperty name.
172
Figure 13 – Estimated impacts under a Multiple Default Consolidator Model
Multiple Default Consolidator (Central Estimate)
No. of
transfers
(m)
Transfer
costs
(£)
Administration
cost saving
per pot (£)
Cumulative
reduction in
deferred small
pots (m)
Cost
(£m)
Benefits (£m)
Net
(£m)
2030/31 8.1 20 18 -6.6 162.2 110.5 -51.7
2031/32 0.5 18 18 -7.3 9.1 120.6 111.5
2032/33 0.5 16 18 -8.0 8.1 130.8 122.7
2033/34 0.5 14 18 -8.8 7.1 140.9 133.8
2034/35 0.5 14 18 -9.5 7.1 151.1 144.0
2035/36 0.5 14 18 -10.2 7.1 161.3 154.2
2036/37 0.5 14 18 -10.9 7.1 171.5 164.3
2037/38 0.5 14 18 -11.6 7.1 181.6 174.5
Cumulative 11.7 – – -11.6 215.0 1,168.3 953.3
Notes:
i. Solution implemented in 2030/31.
ii. 3.5% of individuals are assumed to opt-out.
iii. 5% mismatch rate
iv. Pot size limit is £1,000 (2024 Earnings Terms)
v. Volumes rounded to the nearest 0.1m
vi. The costs of administering a deferred small pension pot is assumed to be £20 per annum. Accounting for an average
management charge (AMC) of 0.48% based on the average small pot value, the saving through the reduction in
small pots is around £18 per pot per annum. The total cost of transferring a deferred small pension pot is assumed to
start at £20 in 2030 and gradually fall to £14 by 2033.
vii. Initial stock is estimated to be 20.8m pots in 2030, with an annual flow of 1.3m pots.
viii. Based on trends from Wealth and Assets Survey data, the proportion of individuals with multiple deferred small pots
is assumed to be between 30%-40% in 2030.
ix. For the purposes of the analysis, it’s assumed there are five consolidators in the multiple default consolidator option.
This is not government policy and will be decided by the number of schemes who apply to and meet the criteria to be
a consolidator. The five consolidators are assumed to cover more than 70% of the market.
140. Across the 10-year appraisal period, which involves 8 years of estimated cost
savings due to the reduction in the number of small pots, the Department estimates a cost
saving of around £1.17bn and therefore representing a significant monetary benefit to
industry as a result, with the benefit savings represented annually in Figure 13.
141. The cumulative reduction in small pots in Figure 13 is below that of the number of total
transfers as any consolidator pots that would be expected to remain below £1,000 have not
been classified as a reduction in the number of small pots. With only those consolidator pots
that are estimated to have a total value above £1,000 being considered a reduction, this
estimation has been based upon an average pot value of £330 from provider data and the
proportion of multiple pots calculated from WAS Round 8 data.
• The Department has therefore assumed that only those consolidator pots that have
had 3 or more small pots consolidated into them would have a value above £1,000
and therefore have been classified as a reduction in the number of small pots. With
an assumption that investment returns would bring the consolidator pots value above
£1,000.
• Any multiple pots being consolidated into one singular deferred pot have been
classified as a reduction in the number of small pots regardless of if the consolidator
pot remains below £1,000. For example, if a member’s two small pots were to be
consolidated this would represent a reduction of one small pot as the consolidator pot
173.
Error! Unknown documentproperty name.
173
is assumed to remain below £1,000. Only, as outlined in the assumption above,
those consolidator pots assumed to have a value above £1,000 would class as a
further reduction in the number of small pots (which would represent reduction of two
small pots for the outlined scenario if the consolidator pot had a value above £1,000).
Benefits to Individuals
142. The Department’s assessment is that fewer deferred small pots would be of benefit
to individuals, who would see their pension savings spread across fewer schemes. The
benefit will largely be felt amongst those who would’ve otherwise accumulated a large
number of deferred small pots.
143. Although it is expected that the industry savings generated by an automated transfer
solution would be passed on to members in the form of lower charges, given it’s a
competitive price-based market and average AMCs are already below 0.5%, the impact on
charges in % terms is likely to be small. As part of the analysis to support the July 2023
pension reforms, the impact on charges of a multiple default consolidator model were
estimated to be a reduction of 2 basis points.296
For a median earner with a full work history,
this reduction was modelled to increase their pension pot by £700 at retirement (2023
earnings terms), and £500 for a National Living Wage earner. Across millions of savers, the
extra pension income would represent billions of pounds.
144. The Department has attempted to monetise the benefit to members of a 0.02%
reduction in average AMCs, bringing the average charge per pot down from 0.48% to 0.46%.
This reduction in the average % AMC represents the removal of the cross-subsidisation
effect alluded to previously [line 47] with the reduction in small pots meaning schemes no-
longer have to counter the loss-making nature of these small pots by applying higher
charges across all members.
• Therefore, the Department has calculated the saving to members of a 2-basis points
reduction in the average % AMC as a saving across all pots within the DC market
and not just small pots by estimating projected values of DC assets across the DC
pensions market.
• It is assumed the reduction in costs would not occur at the point of implementation
but would instead take a number of years before any costs savings are passed on by
schemes to members. The benefits of lower charges have therefore been monetised
from 2034-2037 and are estimated to represent a total benefit of £805.8m to
members over these four years.
145. Consumer Surplus - The automatic consolidation of small pots should bring a direct
economic benefit to some members through the consumer surplus they accrue from the free
of charge nature of a default consolidator solution. For members that would have been
willing to pay a sum of money for the automatic consolidation of their deferred pension pots
(below £1,000), their consumer surplus will represent the value in which they would have
been willing to pay for said automatic consolidation. Therefore, a default consolidator
solution should represent a direct monetary benefit to these members.
146. Not all members that would see their deferred small pots consolidated would have
been willing to pay to have their small pots automatically consolidated and therefore a
default consolidator solution would bring them no consumer surplus by providing a service
that the member would have been unwilling to pay for.
147. Respondents were asked about their willingness to pay for the automatic
consolidation of their small pots in a recent wave of the Planning and Preparing for Later Life
(PPLL) survey297
. The PPLL survey is a cross-sectional survey of GB adults aged 40-75 that
is nationally representative and commissioned by DWP, covering a range of DWP policy
areas.
296
https://assets.publishing.service.gov.uk/government/uploads/system/uploads/attachment_data/file/1168816/analysing-the-
impact-of-private-pension-measures-on-member-outcomes.pdf
297
‘Planning and Preparing for Later Life 2024, DWP, publication forthcoming’
174.
Error! Unknown documentproperty name.
174
148. The most recent wave (Wave 2) gathered around 4,000 responses, with responses
obtained through a “web-first” approach with a small number obtained via telephone.
149. To estimate the potential monetary benefit to members as part of the PPLL survey
respondents were asked whether and how much they would value (in monetary terms) the
automatic consolidation of their small pension pots.
150. As there is a “say-do” gap in any research – the difference between what people
report they would do or are willing to do in a survey compared to what they actually do in
reality - 3 scenarios have been used to estimate the average value that members would be
willing to pay for consolidation.
151. The implementation date of the default consolidator solution in which the transfer and
reduction in small pots would be expected to commence has been assumed to be 2030. Any
deviation from this would impact the potential consumer surplus experienced by members
whether a reduction due to a smaller stock of small pots or an increase in consumer surplus
due to a later implementation date resulting in a higher stock of small pots to be addressed.
152. 73% of respondents indicated they would want the option of the automatic merging of
small pots, however, this equated to only 53% of all respondents willing to pay a monetary
value above £0 for the automatic merging of small pots.
153. Across all responses including those individuals who would not be willing to pay for
the consolidation of their small pots, the mean Willingness to Pay value was £8.80. The
respondents that would not be willing to pay for the automatic merging of small pots have
been attributed a WTP value of £0.
154. Due to the before mentioned “say-do” gap in research a low, central and upper
estimate for total consumer surplus has been estimated to consider the uncertainty around
the true willingness to pay for the automatic consolidation of small pension pots. There is
little evidence to suggest what the “say-do” gap would be, especially within the scope of the
Pensions industry. Taking into account, however, the consistent low levels of engagement
across the pensions industry and that the members that have small pots are likely amongst
some of the least engaged members across the pensions landscape, it is sensible to
assume that this gap would exist in this scenario.
155. The low and high estimates are based on the mean and median values from the
Willingness to Pay research. The average values used in the analysis are as follows:
• £5.00 (Low estimate, median)
• £8.80 (Central estimate, average WTP)
• £16.80 (High estimate, median of only those members who thought consolidation
should be offered)
156. The Low Estimate of £5.00 is based on the median WTP value of all respondents.
The median value should help to discount against any outlying WTP responses that are
significantly high that could have the potential to skew the mean.
157. The mean value of £8.80 has been used as the Central Estimate to provide an
average across all respondents.
158. The High Estimate of £16.80 is based on the mean value of only those respondents
who thought that consolidation should be offered. This, therefore, removes the potential risk
of the mean being skewed downwards by a high proportion of £0 responses being included
within the mean calculation. The low and central estimate are based on the mean and
median calculations using data from all respondents including those who don’t think that the
automatic merging of small pots should be offered (and therefore are attributed a WTP value
of £0). Therefore, these calculations include a larger proportion of respondents attributed a
WTP value of £0, compared to the high estimate.
159. Figure 14 below combines the estimates of the willingness to pay values with the
number of transfers under a multiple default consolidator solution that is modelled in Figure
13 (this has been equated to number of members) to calculate a range for the estimated
consumer surplus.
175.
Error! Unknown documentproperty name.
175
Figure 14 – Estimated Consumer Surplus from a multiple default consolidator
solution298
Low Estimate Central Estimate High Estimate
Number of members modelled to have a
small pot consolidated over the 10-year
appraisal period
9,300,000 9,300,000 9,300,000
Average Value Willing to Pay £5.00 £8.80 £16.80
Total Consumer Surplus £46,300,000 £81,000,000 £155,500,000
Source: DWP calculations from Planning and Preparing for Later Life Survey (PPLL)299
160. Considering the central estimate, the monetary benefit to individuals as a result of the
consumer surplus gained by the free provision of a default consolidator solution is estimated
to be £56.4m in the year of implementation (after the two year transition period) where the
stock of small pots would be addressed.
161. Based on a growth of 1.3m small pots each year after the initial year of
implementation there would be an expected consumer surplus gained by the continued
transfer of small pots each year. This has been estimated as a yearly consumer surplus
benefit of around £3.5m, therefore the total consumer surplus over the 10-year appraisal
period has been estimated at £81m, as shown in Figure 14.
Summary of Costs and Benefits
162. The Department has monetised a number of estimated costs and benefits across
schemes and members with total costs to schemes estimated at £407.2m (Present Value).
The Department then estimates the total benefits across the 10-year appraisal period to be
around £1.65bn (Present Value) of which £957.7m (Present Value) is expected to be a
benefit to schemes and around £694.8m (Present Value) expected to be the monetary
benefit to members.
163. For purely comparative purposes the Department has modelled the impacts (costs
and benefits) of a Single Consolidator (new scheme) and a Single Consolidator (existing
scheme) solution with both tables included in Annex C. As with Figure 13, Figure 33 and
Figure 34 have only focused on the cost and benefits to schemes of the transfer process and
have not considered the wider transition costs or the monetary benefits to members of either
option.
• The wider costs and benefits of a single consolidator model have not be explored due
to both models not being considered as a viable model to address the stock and flow
of small pots whilst supporting both members and the wider pensions industry as has
been discussed previously [line 84]. More work with industry therefore would be
needed to portray the wider costs and benefits of these models, this was not deemed
necessary as neither solution is thought to be viable when compared to a multiple
default consolidator solution.
o Whilst the wider monetary costs and benefits would be expected to differ to those
discussed and monetised for a multiple default consolidator solution the format of
the cost and benefits could be expected to be broadly similar albeit differences in
set-up and implementation costs and then any nuances in the ongoing costs
depending on policy development.
Option 2: Pot follows Member (PfM) Costs and Benefits
164. The Department has estimated the monetised costs and benefits that would be
anticipated under a PfM model. Figure 15 highlights the monetised costs and benefits of PfM
estimated by the Department.
298
Figures have been rounded within the table to the nearest 100,000 where applicable
299
‘Planning and Preparing for Later Life 2024, DWP, publication forthcoming’
176.
Error! Unknown documentproperty name.
176
Figure 15 – The estimated monetised costs and benefits to industry and individuals of
a Pot follows Member (PfM) solution
Pot follows Member
Industry Individual
Familiarisation Costs: £0.2m Consumer Surplus (benefit): £56.2m
Small Pots Data Platform (cost): £216.0m Lower Charges (benefit): £402.9m
Transfer Costs: £161.9m
Pot Administration Savings: £962.7m
Net Benefit: £584.7m Net Benefit: £459.1m
Costs and Benefits to Industry
165. The costs involved in the implementation of PfM would be expected to be borne by
schemes. The Department has monetised a number of the key costs and benefits that would
be expected under a PfM solution:
• Familiarisation Costs – These would be expected to be similar to the familiarisation
costs estimated by the Department for the implementation of a Multiple Default
Consolidator solution and therefore for this IA the same familiarisation costs for a
consolidator and PfM solution have been used. As outlined in more detail above [line
126], familiarisation costs across the 2-years of transition before implementation
have been estimated at £189,000 across all schemes.
• Small Pots Data Platform – The Department has also estimated the build and set-
up costs of a Small Pots Data Platform for a PfM solution with a Small Pots Data
Platform being the current most developed concept to support the transfer process,
discussed previously [line 127]. How the design requirements or functionality of a
Small Pots Data Platform may differ under PfM compared to a default consolidator
solution is currently unknown due to the uncertainty surrounding a central
mechanism. Therefore, the Department has assumed the same cost estimates for a
Small Pots Data Platform under PfM as those discussed previously for a default
consolidator solution [line 108], as the foundational purposes would likely to be
similar under both solutions. The costs of a Small Pots Data Platform under PfM
therefore have been estimated as £216m over the 2 years of transition costs.
• Transfer Costs – A PfM solution would require the transfer of pension pots when
individuals move employment and therefore schemes would face an increase in
overall transfer costs due to an increase in the number of transfers.
o Due to the build-up of the stock of small pension pots, it is assumed that when an
individual moves to a new employer and a new automatic enrolment DC scheme,
their existing pots (created since the introduction of automatic enrolment) are in
scope to be automatically transferred to their new scheme.
o Purely for illustrative purposes, it is assumed that all DC workplace pension pots
are eligible, as the scale of pots with particular rights or guarantees is unknown,
and that all DC pension schemes are eligible to receive pots. In practice, the
Government could limit the scope to only pots created after the implementation
date, pots without any extra rights or guarantees, and limit the eligibility of
schemes to receive pots through an authorisation process.
166. The number of transfers that would be expected under a PfM model is closely linked
with the labour market and the expected movement of members between employments. The
estimate that individuals move jobs every 3 years has been used alongside analysis of
Wealth and Assets Survey data to estimate the number of transfers required each year.
• The estimate that on average an individual moves jobs around every 3 years is
based on DWP’s analysis of HMRC’s RTI data using the median job count figures
discussed in further detail in Annex A.
177.
Error! Unknown documentproperty name.
177
167. The same cost savings of bulk transfers that have been estimated under a
consolidator solution would not be expected under PfM. An initial transfer cost of £20 per
pot has been estimated, with more detail given on the evidential base around this given
previously [line 128]. However, unlike under a consolidator model, no economies are scale
are expected to be realised, with a lower likelihood of bulk transfers being widely used and
an overall reduction in the number of transfers required. Therefore, across the 10-year
appraisal period transfer costs are expected to remain at £20 per pot. Therefore, the
Department estimates total transfer costs of a PfM model over the 10-year appraisal period
to cost schemes £161.9m. This cost estimate would be impacted by any changes within the
labour market and any potential cost savings around transfers as a result of a PfM solution.
168. The initial transfer costs would depend on the design and timings of the solution. For
the purposes of this IA, the transfer of a small pot has been assumed to occur when a
member moves within the labour market and joins a new scheme. The movement of small
pots is assumed to be based on the job churn of individuals.
o If schemes were to immediately begin to search for an active pot to transfer out
their current small pots and/or schemes immediately search for deferred pots to
transfer into their members’ current active pots, the level of transfers within the
first few years after implementation could be higher.
o The interactions of schemes and a Small Pots Data Platform would largely
determine the rate at which small pots are moved between schemes.
• Staggered movement of Small Pots – As referenced above, it is assumed that there
would not be a big bulk movement of small pots at the point of implementation. This
accounts for:
o It may be harder for schemes to find an active pot in which to transfer their
deferred pots into as it relies on members with small pots currently making active
contributions into a pension pot – some for example may not be within the labour
market or may have opted out of workplace pension savings.
o The design of a PfM solution, may mean that schemes have to wait until a new
pot has been created by a member in-order to trigger the transfer process – which
may result in schemes taking a longer period to report a small pot as schemes
wait until a new pot has been identified.
169. Figure 16 highlights the Department’s estimates for the impact of a Pot follows
Member solution based just on the transfer process with no transition costs included.
Figure 16 – Estimated impacts under a Pot follows Member (PfM) solution
PfM (Central Estimate)
No. of
transfers
(m)
Cumulative
reduction in
deferred small
pots (m)
Cost
(£m)
Benefits
(£m)
Net
(£m)
2030/31 3.1 -3.1 62.2 57.3 -5
2031/32 2.2 -5.3 43.6 97.4 54
2032/33 1.2 -6.5 24.9 120.3 95
2033/34 0.3 -6.8 6.2 126.1 120
2034/35 0.3 -7.2 6.2 131.8 126
2035/36 0.3 -7.5 6.2 137.5 131
2036/37 0.3 -7.8 6.2 143.3 137
2037/38 0.3 -8.1 6.2 149.0 143
Cumulative 8.1 -8.1 161.9 962.7 800.9
178.
Error! Unknown documentproperty name.
178
Notes:
i. Solution implemented (transfers begin) in 2030/31.
ii. 3.5% of individuals are assumed to opt-out.
iii. Pot size limit is £1,000 (2024 Earnings Terms)
iv. 5% mismatch rate
v. Volumes rounded to the nearest 0.1m
vi. An average of 1.3 small pots per individual with small pots
vii. The costs of administering a deferred small pension pot is assumed to be £20 per annum. Accounting for an average
management charge (AMC) of 0.48% based on the average small pot value, the saving through the reduction in
small pots is around £18 per pot per annum.
viii. The total cost of transferring a deferred small pension pot is assumed to be £20 across the 10-year appraisal period.
ix. Based on trends from Wealth and Assets Survey data, the proportion of individuals with multiple deferred small pots
is assumed to be between 30%-40% in 2030.
x. Individuals are assumed to move jobs every 3 years.
170. Figure 16 compares the reduction in small pots under PfM to the projection under the
‘do nothing’ scenario, estimating the number of transfers and the recurring administrative
cost and benefits which would arise as a result (i.e. the saving from no longer having to
administer small deferred pots and the cost of the transfers). Schemes would see higher
costs in the early years as they incur the upfront cost of processing transfers, but over time
this would be outweighed by the savings they make from having to administer fewer and
fewer deferred pots.
171. The reduction in the number of small pots through the transfer of members’ old
workplace pensions into their new AE schemes as they move employment should see a
reduction in the total number of loss-making pots that schemes must administer.
• Unlike the modelling of a multiple default consolidator solution, each transfer of a small
pot under a PfM solution is classified as a reduction in the number of small pots
regardless of whether the active pot the small pots have been consolidated into has a
value above £1,000 or not. This is because any small pots consolidated under PfM
would be consolidated into an active pot and therefore would no longer be classed as
a small pot even if the total value remains below £1,000 as the pot would not be
deferred.
172. The same assumption of £20 administration costs per pot for a multiple consolidator
solution have been used for the industry benefit estimates of a PfM solution due to both
solutions not expected to significantly impact the overall administration costs of individual
small pots. Based on this assumption, outlined in further detail previously [line 138], the
benefit to industry through a reduction in small pots as a result of a PfM solution have been
estimated to be £962.7m over the 10-year appraisal period.
173. The deferred pots which would remain in the system include those which are too big
to be transferred and those which remain deferred because the individual does not enter a
new DC scheme (for example because they have opted out, have not re-entered work or
have entered a DB or CDC scheme).
174. There is the potential that consolidating small pots into marginally larger pots could
have a behavioural effect on saving and hereby change the amount savers choose to save
into a pension. This could either be members choosing to increase savings as they are able
to better understand the income they can expect in retirement through their pensions or a
reduction in savings as the consolidation of pots means members’ pension savings may be
higher than they originally thought. Any behavioural impacts would vary on an individual
basis and therefore for the purposes of this IA it is assumed there would be no impact on the
amount of money saved by members. This is because of the relatively low value of the pots
involved and the low level of pension engagement of many members meaning contributions
are more likely to remain at the level set by their AE scheme or employer rather than being
changed by members themselves as a result of the combination of their old and new
179.
Error! Unknown documentproperty name.
179
workplace pension pots. Therefore, the impact on the pension industry’s revenue has simply
been looked at in the terms of any changes in the number of pension pots to administer.
Costs and Benefits to Individuals
175. The Department has considered the potential impacts of a Pot follows Member
solution on members.
176. Consumer Surplus - The transfer of small pots into members’ active pots free of
charge should represent a monetary benefit to those members that would have been willing
to pay for these transfers. Whilst there are some differences in how a multiple default
consolidator and PfM solution would consolidate small pots, research suggests member
support for either solution300
and therefore the same method of calculating the consumer
surplus has been used for both models. The method used is explained in detail above [lines
145-158] and uses data collected through the PPLL survey301
.
177. Figure 17 below presents the estimated consumer surplus benefit of a PfM solution
over the 10-year appraisal period.
Figure 17 – Consumer Surplus of a Pot follows Member solution302
Low Estimate Central Estimate High Estimate
Number of members modelled to
have a small pot consolidated over
the 10-year appraisal period
6,400,000 6,400,000 6,400,000
Average Value Willing to Pay £5.00 £8.80 £16.80
Total Consumer Surplus £32,100,000 £56,200,000 £107,900,000
Source: DWP calculations from Planning and Preparing for Later Life Survey (PPLL)303
178. Considering the central estimate, the monetary benefit to individuals as a result of the
consumer surplus gained by the free provision of a pot follows member solution is estimated
to be £21.6m in the year of implementation (after the two year transition period).
179. Over the 10-year appraisal period, the total consumer surplus to members under a
PfM solution is estimated at £56.2m, however, depending on the true willingness of
members to pay, this figure could potentially vary between £32m-£108m as shown in Figure
17.
180. The proportion of members willing to pay and the value that they would be willing to
pay has been assumed to be the same under both a PfM and default consolidator solution,
however, it is possible that this would not be the case and without further research it is not
possible to say how the willingness to pay of members may vary across the two solutions.
Therefore, using the WTP data from the PPLL survey is considered by the Department as
the best estimate for the consumer surplus under a PfM solution. A low and high estimate for
the consumer surplus has been estimated to partly account for the uncertainty on the
similarity between the WTP of members across both a consolidator and PfM solution.
181. Lower Charges – As mentioned previously [line 171], the Department expects
schemes to benefit from the reduction in the number of pots to administer as a result of the
transfer of members’ small pots into their currently active pots under a PfM solution. The
Department has then considered that the expectation would be that the industry savings
would be passed on to members through a reduction in % charges.
300
https://www.gov.uk/government/publications/understanding-member-engagement-with-workplace-pensions/understanding-
member-engagement-with-workplace-pensions#consolidating-deferred-pension-pots
301
‘Planning and Preparing for Later Life 2024, DWP, publication forthcoming’
302
Figures have been rounded within the table to the nearest 100,000 where applicable
303
‘Planning and Preparing for Later Life 2024, DWP, publication forthcoming’
180.
Error! Unknown documentproperty name.
180
• To monetise the potential benefit to members as a result of the lower charges, the
Department has utilised the same methodology used to monetise the benefit under a
multiple default consolidator solution which has been explained previously [line 144].
However, the expectation would be that the basis points reduction as a result of a PfM
solution would be below that previously modelled as a result of a default consolidator
solution.
• The reduction in charges is assumed to be lower than that under a default
consolidator solution due to a number of considerations:
o Pots could become deferred once again – As small pots would be transferred
into a member’s active pot in a PfM solution, depending on how close each
member is to retirement, there is a chance that members will move jobs again
before retirement. Depending on the pot limit set under a PfM solution for the
automatic transfer of deferred members it risks members creating numerous
larger deferred pots. If the pot limit was set around the £1,000 limit proposed
under a default consolidator model, the combination of small pots into an active
pot could easily result in a pot created with a value above this limit. Any pot
above the limit would not be eligible for an automatic transfer and therefore due
to inertia and lack of engagement would likely remain deferred were the member
to move jobs. As discussed previously [line 35] even pots up to around £4,000
can be loss-making and therefore there is the potential for a PfM solution to
transfer small pots into an active pot which could then itself become deferred and
still be loss-making for schemes. This would limit the economic benefit to
schemes and their ability to pass on lower charges to members as a result.
o Pots transferred into more schemes – The expectation under a default
consolidator solution is for a small number of already large schemes to apply for
authorisation to become consolidator schemes and therefore any pots
consolidated would be transferred to a small number of schemes that are already
benefitting from scale. The influx in small pots should allow the consolidator
schemes to further increase in scale and further benefit from doing so through
economies of scale. These economies of scale should allow schemes to reduce
fixed costs per member and negotiate lower fees helping them to offer members
lower charges, with a 2-basis point reduction modelled previously [line 143].
Under a PfM solution, however, the small pots could be transferred into a much
wider range of schemes which could limit the ability of schemes to grow in scale
as a result and therefore achieving economies of scale benefits would be more
challenging. The schemes that receive the transfer of small pots may not receive
enough in terms of scale to benefit and therefore could struggle to offer any
reduction in charges to members as they face a growth in loss-making pots in
which their scale is potentially not sufficient enough to comfortably outweigh.
o More frequent transfers of each pot – PfM may require the continued transfer
over time of a member’s combined deferred small pots and active pot as
members move jobs. This would require schemes to buy and sell assets as they
transfer members’ pots between schemes. This could increase the administration
costs to schemes and therefore reduce the likelihood that schemes would
experience a sufficient level of economic benefit to pass on to members through
lower charges.
• Although the impacts are challenging to know, on balance, it is expected that the risk
of a greater pool of smaller pots and them being spread across a wider range of
schemes may still result in a greater number of small pots remaining and thus losses
to industry under PfM. As a result, the reduction in lower charges is estimated at 1
basis points, rather than 2 basis points.
• The Department has therefore monetised a 1 basis-point reduction in % AMC charges
across all DC members under a PfM solution to account for the benefit that schemes
should be able to pass on to members. The benefits of lower charges has therefore
been monetised to represent a total benefit of £402.9m between 2034-2037.
181.
Error! Unknown documentproperty name.
181
o A low assumption of 0.5 basis point reduction and high assumption of 2 basis
point reduction has been modelled in Annex D to represent the inherent
uncertainty of the benefits that schemes may choose to pass on to members.
182. Members should benefit from the reduced risk of creating a deferred pot as they
move between employments which should help to support longer-term member outcomes at
retirement. Given that some members will either not start saving again (through not re-
entering the labour market or opt-outing out of future pensions saving) or may join an
employer who enrols employees into a DB or CDC scheme, not all small pots would be
within the potential scope of a PfM solution, with some pots not being consolidated under a
PfM model but otherwise would be under a default consolidator solution.
183. The impact on members could be impacted by the schemes that members’ pots are
moved between. More generally, members may be made better or worse off depending on
whether their new scheme has higher or lower charges and/or worse or better investment
performance than their previous scheme(s). It is not possible to assess the impact of this as
it will vary in each case, however, the Department would expect the gains and losses from
differences between scheme charges and investment performance to cancel out on average.
184. Members whose pots are transferred multiple times could see the value of their
savings eroded slightly each time through buy and sell spreads (charges which reflect the
costs that a fund incurs when it buys and sells assets), and individuals who do not re-enter
the labour market would not see the same benefits as those who do.
185. Consolidating pension savings into members’ current schemes may result in less
diversification in their overall investment portfolio. Although each member’s automatic
enrolment scheme should provide an appropriate and diversified allocation of assets, the
performance of the member’s current scheme would be having the greater current impact on
the member’s eventual retirement income. The overall risk of this is low, given the relatively
small amounts of money being transferred and the broadly similar investment strategies of
default funds304
.
186. For schemes with a high turnover of members (and therefore a lot of small pots
generated) there may be a preference to hold funds in more liquid assets (such as cash) to
manage the increase in transfers required under PfM. This could potentially disincentivise
pension schemes from investing in illiquid assets such as infrastructure or venture capital.
This could result in lower investment returns for pension savers as their schemes switch into
more liquid (and lower return) assets and have wider knock-on effects to the economy as a
whole.
Summary of Costs and Benefits
187. The Department has monetised a number of estimated costs and benefits across
schemes and members with total costs to schemes estimated at £356.1m (Present Value).
The Department then estimates the total benefits across the 10-year appraisal period to be
around £1.15bn (Present Value) of which £785.8m (Present Value) is expected to be a
benefit to schemes and around £360.9m (Present Value) expected to be the monetary
benefit to members.
Option 3: Member Exchange Costs and Benefits
Costs to Industry
188. The costs of a Member Exchange solution would be expected to be borne by the
schemes involved, it is however, difficult to quantify the resultant costs.
304
For example, https://corporate-adviser.com/ca-master-trust-gpp-defaults-report-key-findings/ (CA Master Trust & GPP
Defaults report – key findings – Corporate Adviser), shows that while there is some variation in default scheme investment
strategy, most schemes follow a broadly similar strategy of high equity/growth asset exposure for younger savers before ‘de-
risking’ as the saver nears retirement into higher proportions of fixed income assets.
182.
Error! Unknown documentproperty name.
182
189. The difficulties arise due to the uncertainties over the number of schemes that would
partake and the process that would be required for a Member Exchange solution to be
implemented.
190. The cost burden on the schemes involved could be significant in terms of both time
and monetary cost due to the repetitive and ongoing requirement for schemes to check for
matches with other schemes. This could pose a significant administrative burden on the
participating schemes over time.
191. Schemes would also face the transfer costs involved in the swapping of pension pots
between schemes and due to the likely smaller scale nature of a Member Exchange solution
compared to a larger default consolidator solution the economies of scale in terms of
transfers would be expected to be on a smaller scale, resulting in higher transfer costs per
pot in comparison.
Benefits to Industry
192. The uncertainty over the potential number of small pots that would be consolidated
under a Member Exchange solution means that any quantification of the potential benefits to
schemes is challenging. This would be entirely dependent on take-up (for example, the
recent data project underway by PPI only contains 5 schemes, highlighting the challenge of
getting large-scale data sharing off the ground without government).
193. The exchange of small pots for pots in which the scheme already has an ongoing
relationship with the member should be beneficial to schemes, with the potential to
exchange loss-making small pots for potentially profit-making pots when transferred into a
member’s active pension pot. With the potential for these schemes to reduce the proportion
of their assets/pots that are loss-making.
Costs and Benefits to Individuals
194. The combination of members’ pension pots would be expected to benefit those
members that currently face higher charges or flat fees, with the removal of a set of fees.
The extent to which this occurred would depend on the charging structure of the schemes
that the pensions have been moved between.
195. The expectation would be that the schemes that would be involved in a Member
Exchange system would be amongst the largest pension schemes in the UK’s DC market
and therefore it is expected that a movement between these schemes shouldn’t result in
significant changes in the value offered to members with charges across Master Trust
schemes consistently below that of the 0.75% charge cap305
, with an average AMC of 0.48%
across all Master Trust schemes according to the 2020 Pension charges survey306
.
Therefore, members should be offered a relatively consistent value for money as their
deferred pots are exchanged between schemes.
Risks and Assumptions
196. Throughout this IA, the key risks and assumptions have been covered, however the
main areas of risk are listed and RAG-rated below (Red = significant analytical/policy risk or
significant driver of IA modelling ; Green = low impact risk or assumption and/or unlikely to
significantly impact IA modelling):
Policy Risks
197. Transition Costs (Amber) – For the purposes of this IA transition costs have been
assumed to occur over a two-year period and therefore the 10-year appraisal period consists
of 2 years of transition costs and then 8 years of ongoing costs after the policy
implementation.
305
https://assets.publishing.service.gov.uk/media/61d823e3d3bf7f053fd8254e/charge-cap-guidance.pdf
306
https://www.gov.uk/government/publications/pension-charges-survey-2020-charges-in-defined-contribution-pension-
schemes/pension-charges-survey-2020-charges-in-defined-contribution-pension-schemes#member-borne-charges-within-the-
cap
183.
Error! Unknown documentproperty name.
183
• The duration of the transition costs may deviate from the assumed two years, with
more certainty likely after the feasibility review around the Small Pots Data Platform.
Any deviation itself is not expected to impact the nominal monetary cost and benefit
estimates, rather the net present value calculations could be potentially impacted by
any changes in the distribution of the transition costs over a period of years.
198. Small Pots Data Platform (Red) – How the costs of a Small Pots Data Platform
would be re-couped from industry is currently under consideration, so whilst in this Impact
Assessment it has been assumed that any costs incurred would be paid directly by industry,
the Department is currently exploring how this would work in practice. The current process of
this is unknown and therefore a different mechanism or different timeframe may be used
after the build of a Small Pots Data Platform.
• After further feasibility analysis is undertaken, an alternative approach to a Small Pots
Data Platform could be taken, which could impact the cost estimates included within
this Impact Assessment. With any change in the delivery model of a central
mechanism likely to impact the cost profile. For the purposes of this IA, a number of
assumptions around a central mechanism have been made based on a Small Pots
Data Platform, which is currently the most developed and likely concept at this stage.
199. Year of Implementation (Green) – There is currently some uncertainty over the
timescale that would be required to implement a Small Pots solution, with more certain
expected as the policy progresses. For this IA, the Department has assumed the beginning
of the transition period to begin in 2028, with the full implementation and transfers occurring
from 2030 onwards. This is based on the assumption that this represents a reasonable
timeframe based on the current status of the policy development and the infrastructure
required for its implementation.
• If the timeframe for implementation were to differ from the one referenced in this IA,
there could be some small impact on costs and benefits depending on the scale of the
deviation.
200. £1,000 Pot limit (Green) – As part of legislation for a multiple default consolidator
solution an eligibility pot limit of £1,000 will be outlined and therefore throughout this IA, the
pot limit is assumed to remain at £1,000 across the 10 year-appraisal period. Reasons for
setting the initial eligibility pot limit at £1,000 are discussed previously [line 23].
• Whilst the Department plans to introduce legislation to support future uplifts of the pot
limit, any potential impact of an uplift cannot be considered as part of this IA as the
Department would only proceed with an uplift of the pot limit if and when this was
deemed appropriate to support member outcomes and the stability of the pensions
industry. Any instances of the pot limit being uplifted over time cannot be known in
advance, but there is the potential that both costs and benefits could change
depending on the potential for future changes in the eligibility for consolidation under
a multiple default consolidator solution.
Analytical Risks
201. Yearly Creation of Small Pots (Amber) – Projections over time are highly uncertain
and there are several upward and downward pressures on the potential creation of small
pots that may impact the Department’s best estimate of 1.3m small pots a year [line 128].
• Upward Pressures (Green) – include future policy expansions and changes (we’ve
not accounted for this) but could potentially expand eligibility for consolidation and
therefore the overall number of pot creations. An expansion of the population and/or
an increase in the size of the working population or any changes resulting in shorter
tenures could further increase the number of small pots created. These upwards
pressures are all uncertain but could have a potential impact on the number of small
pots created each year and the stock of small pots at the point of implementation.
• Downward Pressures (Green) – could also be the result of future policy expansions.
The trust-based side of the DC market is becoming increasingly concentrated and the
consolidation of the market continues to be encouraged. Within a more consolidated
184.
Error! Unknown documentproperty name.
184
market, it would become increasingly likely that a member would return to the same
pension scheme over time as they move in and out of employment and/or pension
saving. This could result in a reduction in the creation of small pots as members
recommence contributions into their previously deferred pots. Currently, however, it is
known that not all pension schemes apply a lifetime pot model and therefore this
uncertainty means that any potential impacts cannot be currently accounted for.
• Since the introduction of AE, the rate of small pots creation has remained relatively
stable but the average growth in pots since AE may be less representative for future
growth. The number of instances of people that stopped contributions into a pension
after less than 6 months307
in 2021/22 nearly doubled when compared to 2015/16;
however, the Department’s evidence from industry does suggest a potential reduction
year on year in the growth of small pots. Therefore, any estimates do remain
uncertain.
o Comparisons (Green) – PPI suggested that the number of small pots within the
DC master trust market was likely to reach around 27m by 2035308
, very similar to
the Department’s estimates of an overall number of 27.3m small pots across the
DC market by 2035, based on a growth of 1.3m small pots each year.
❖ DWP modelling on the average year-on-year growth rate of DC memberships
between 2020/21 – 2024/25 returns an average yearly growth rate of 11%.
11% of the current stock of small pots would represent around 1.4m small
pots, similar to the Department’s estimate of a 1.3m growth rate each year. It
is difficult to extrapolate any average % growth figure over time due to the
compounding impact this would have and the changing growth in small pots
over time as the Automatic Enrolment market has matured since its
introduction and continues to do so.
o These comparisons help to give confidence to a somewhat highly uncertain
value.
202. Transfer Costs (Green) – It is unknown how quickly costs will fall. It is possible in
the interim period between the policy being announced and implemented that systems and
processes will be established which allow for cheaper transfers immediately, especially as
data quality improves in light of the Pensions Dashboard. The marginal savings of each
additional pot transferred simultaneously are also unknown, with industry suggestions that
the costs of bulk transfers can be highly subjective to a number of factors. This has been
addressed by staggering the projected reduction in transfer costs over a number of years of
the appraisal period after implementation to account for the uncertainty on how and when
cost savings may materialise within the transfer process. International evidence from
Australia has been used as a suggestion for the level of cost savings that could occur and
our sensitivity analysis [Annex B] portrays the impacts of transfer costs remaining stable
over the appraisal period, as well as transfer costs falling in the intervening period before
implementation.
203. Small Pots Data Platform (Red) – The costs of a Small Pots Data Platform are
currently uncertain with the estimates given within this IA being the Department’s current
best estimates. Further work through the feasibility review is exploring the infrastructure
required for a Small Pots Data Platform, which is hoped will help to refine the cost estimates
over time.
204. Lower Charges (Green) – A 2-basis points reduction in average annual
management charges across the DC market was estimated through modelling by the
307
https://view.officeapps.live.com/op/view.aspx?src=https%3A%2F%2Fassets.publishing.service.gov.uk%2Fmedia%2F64a82b88
a32f130013f068dc%2Fstopping-saving-and-pensions-in-payment-
statistics.ods%23%3A~%3Atext%3DAs%2520published%2520previously%2520in%2520the%2Cthe%2520financial%2520year
%25202021%2520to&wdOrigin=BROWSELINK (Table 7: Count of individuals who have stopped workplace pension
contributions in each year, by length of contribution period)
308
https://www.pensionspolicyinstitute.org.uk/research-library/research-reports/2020/2020-07-23-policy-options-for-tackling-
the-growing-number-of-deferred-members-with-small-pots/ (Policy options for tackling the growing number of deferred
members with small pots)
185.
Error! Unknown documentproperty name.
185
Department but there does remain some uncertainty as it would ultimately be the behaviour
of schemes that decides whether any and if so what proportion of the costs savings are
passed onto members.
• To mitigate this, the Department has estimated the benefit to members of lower
charges to commence in year 7 of the appraisal period (year 5 after implementation)
to account for the time it would take for cost savings to be realised and then passed
onto members and in attempts to mitigate against a potentially smaller than 2 basis-
points reduction in the average % AMC. Therefore, the benefit of lower charges to
members has been monetised for 4 years across the 10-year appraisal period.
• The impact of the lower charges is based on the Department’s estimates for the
growth in assets across the DC market with the Department projecting DC assets
across the 10-year appraisal period. As within any projections, the true assets values
could vary but the Department’s DC asset projections are broadly in line with
estimates modelled by PPI309
.
205. Opt-Out (Green) – Whilst a 3.5% opt-out rate is supported by member research310
which showed strong support for an automated solution, the opt-out rate will only become
clear after the implementation of a consolidator solution. If the opt-out rate were to be higher
than the estimated 3.5%, along a similar level to the opt-out rate for automatic enrolment, the
number of transfers and the cumulative reduction in small pots may have been slightly over-
estimated. This would also impact the estimated costs and benefits to both schemes and
members. Therefore, our sensitivity analysis uses an opt-out rate of 5% (a 1.5 percentage
points increase over the central estimate), to represent the impacts if a small pots
consolidator solution were to have a higher opt-out rate that is slightly closer to that of
Automatic Enrolment of around 8% to 10%311
. Our sensitivity analysis also uses an opt-out
rate of 2% (a 1.5 percentage points decrease over the central estimate) to represent the
impacts if a small pots consolidator solution were to have a relatively low opt-out rate due to
the low levels of pensions engagement and high levels of inertia which is prevalent across
pension savings and specifically amongst members with small pots.
• Early findings from the PPLL survey312
also suggest broad support for the automatic
consolidation of small pots with 73% of respondents (adults 40-75) wanting the option
of the automatic merging of small pots. It is likely due to the inertia around pensions
that of the 27% of respondents who indicated they would not want the option of the
automatic merging of small pots that a large number would not opt-out of a
consolidator solution due to its automatic nature. Those that responded no may be
more likely to not currently have a small pot and therefore do not see the benefit of
such a solution, however, in the future they could accrue a small pot and therefore
they may wish for the option for the automatic consolidation of small pots at a future
date.
206. Multiple Pots (Red) – Where individuals already have existing pots within the
consolidator schemes there would be an additional benefit to schemes from administering a
larger, potentially more profitable pot after the consolidation of a member’s small pots. With
the continually growing stock of small pots, it is expected that at implementation many
individuals will have multiple small pots below £1,000 which would be consolidated into one
pot under a consolidator solution. The extent to which individuals have multiple deferred
small pots is currently unknown and for the purposes of this IA, estimates reached through
analysis of ONS’ Wealth and Assets Survey Round 8 have been used. The Wealth and
Assets Survey is self-reported by members and there is the tendency for many small pots to
go unnoticed by members. Therefore, any estimates are likely to be an underestimation of
the number of individuals with multiple small pots. Therefore, it is difficult to assess the true
309
https://www.pensionspolicyinstitute.org.uk/media/hbrgvfw5/20240926-the-dc-future-book-2024-final.pdf
310
https://www.gov.uk/government/publications/understanding-member-engagement-with-workplace-pensions/understanding-
member-engagement-with-workplace-pensions#consolidating-deferred-pension-pots
311
https://www.gov.uk/government/statistics/workplace-pension-participation-and-savings-trends-2009-to-2023/workplace-
pension-participation-and-savings-trends-of-eligible-employees-2009-to-2023
312
‘Planning and Preparing for Later Life 2024, DWP, publication forthcoming’
186.
Error! Unknown documentproperty name.
186
size of the stock reduction that would be expected but work is ongoing with industry
stakeholders and others including PPI to better understand the instances of members having
multiple small pots.
207. Mismatch rates (Amber) – As previously stated, the evidence and research around
a mismatch rate is limited and therefore the Department has included a high and low
estimate in its sensitivity analysis of the costs and benefits of a multiple consolidator solution
[line 246].
• Low estimate of 9% is based on research by ITM published in PLSA’s report313
, with
the assumption that no further improvements in matching rates occur over time.
• High estimate of 1% is based on research conducted based on the Pensions
Dashboard314
that suggested with repeated matching attempts a matching rate above
99% could be reached and the assumption that matching rates should improve over
time.
• As with the opt-out rates used in the sensitivity analysis, a higher % figure is used for
the low estimate of the mismatch rate than for the high estimate as the low estimate
forms part of the wider analysis to model a low estimate for the number of transfers
and therefore a low estimate for the reduction in small pots and vice versa for the high
estimate. This is explained further below [line 255].
Summary of why Option 1 is the preferred option
208. A Multiple Default Consolidator solution presents the best overall net benefits of the
viable solutions explored by the Department and should provide a focus on improving
member outcomes throughout.
209. Do Nothing – Even with the introduction of the Pensions Dashboards and FCA’s
consultation on targeted support, due to their reliance on member engagement, the
continued growth in the number of small pots would be expected to continue as such
member engagement is not present at scale. The Department therefore does not consider
this a viable option. Under a “do nothing” approach the costs to schemes and the detriment
to members would be expected to increase as the number of small pots continued to grow.
210. Pot follows Member – As with a default consolidator solution, a PfM solution would
require the use of government legislation be that the use of existing powers that the
Government has already previously legislated for in anticipation of a small pots solution or
(most likely) the requirement for further government legislation. The transition costs are
assumed to be similar to those under a default consolidator model and due to the lower
number of transfers under a PfM model the yearly costs to schemes would be expected to
be lower than the yearly costs of a consolidator solution. The lower number of transfers due
to the initiation of any transfers based on when a member moves between employment
means that when compared to a consolidator model it is expected that a PfM model would
result in a lower overall reduction in the number of small pots over the 10-year appraisal
period. Therefore, whilst a consolidator solution is assumed to involve higher overall costs,
the benefit to both members and industry as a result of a larger reduction in small pots would
be expected to outweigh the higher costs.
• DWP analysis finds PfM would have slightly fewer pots consolidated compared to the
default consolidator approach (as discussed in the Costs & Benefit section). However,
it is recognised these results are uncertain and dependent on a number of
assumptions, including opt-outs.
313
https://www.plsa.co.uk/Portals/0/Documents/Policy-Documents/2021/Small-pots-cross-industry-co-ordination-group-update-
report.pdf
314
https://www.pensionfusion.com/sites/default/files/2022-
09/Pension%20Fusion%20-%20Pensions%20Dashboards%20-%20Getting%20to%20the%20heart%20of%20matching%20-%
20Single%20page%20view.pdf
187.
Error! Unknown documentproperty name.
187
• For example, PPI previously estimated315
the impacts of Small Pots solutions on the
number of pension pots. They estimated 70-90% of small deferred pots would be
consolidated under PfM compared to around 60-80% under default consolidator.
• Nevertheless, there are wider advantages of a Default Consolidator solution, including
the ability to develop scale and drive efficiencies in managing smaller pots, which was
seen as more advantageous compared to PfM.
211. Member Exchange – A member exchange solution was considered as an alternative
to a government legislated solution, however, the member exchange pilot found that
schemes would struggle to move forward without supporting legislative change from
government. The scope of member exchange would likely be more limited compared to an
industry wide solution such as default consolidation as only the small pots within the
participating schemes would be within scope of a member exchange solution. Therefore, a
member exchange solution is not considered as a viable alternative to a government
legislated solution.
212. Multiple Default Consolidator – The preferred option that would be expected to
address the stock and flow of small pots whilst having a minimal impact on the pensions
industry with the distribution of the consolidated small pots across several schemes with a
focus on improving member outcomes.
• The consolidation of small pots into a select number of consolidator schemes should
allow the consolidator schemes to have access to a greater value of assets as they
grow in scale and these assets would be less liquid than those under a PfM model
where schemes may have to carry out more regular transfers of members’ pots. As
pots consolidated under a PfM model could continue to be transferred over time as
the active pot they were transferred into becomes deferred. The extent to which would
depend on the pot limit set for pots to be transferred, whilst under a default
consolidator solution, once a pot is consolidated into a consolidator pot it would not
need to be transferred again as part of a consolidator solution. The access to a
greater number of more illiquid assets should help the consolidator schemes
investment in higher growth assets and improve retirement outcomes for members.
Direct and Indirect costs and benefits
213. As referenced in the sections above, the Department has estimated the costs and
benefits to both members and business of the introduction of a multiple default consolidator
solution. Of these monetary costs estimated, the Department has summarised in Figure 18
below, whether these monetised costs and benefits are considered direct or indirect to either
schemes or members.
Figure 18 – Summary of the Monetised Costs and Benefits
Monetised Costs
Transition Costs: Central
Mechanism (assumed to be a
Small Pots Data Platform for
the purposes of this IA) and
Familiarisation Costs
Direct cost
to
business
Costs are immediate and unavoidable.
They are the necessary costs involved for
schemes in the implementation of the
policy and therefore are direct costs as a
result of the measures.
Transfer Costs Direct cost
to
business
The first step in the logic chain as
schemes will be required to send their
pots to the relevant consolidator. As the
costs of the immediate action required to
be undertaken to achieve the policy
objectives, these are therefore direct
costs.
315
https://www.pensionspolicyinstitute.org.uk/media/pqynaq5p/20200723-deferred-members-final-report-for-the-website.pdf
188.
Error! Unknown documentproperty name.
188
Monetised Benefits
Pot Administration Savings Direct
benefit to
business
The transfer of small pots will be a direct
action of the legislation and the first step
in the logic chain (the reduction in the
number of small pots). Therefore, it is
appropriate to see the reduction in costs
of administrating these pots as a direct
benefit.
Lower charges for Members Indirect
benefit to
Members
As it is a choice whether providers lower
the charges for members, this is
considered an indirect benefit. This is
because it relies on schemes passing on
some of their cost savings onto members.
As this is therefore “avoidable” and
requires an additional step in the logic
chain for the benefit for members to be
realised, it is considered indirect.
Consumer Surplus Direct
benefit to
Members
As all members of small pots will gain
directly from having their pots
automatically consolidated (unless they
opt-out), the consumer surplus from the
measure is a direct benefit to members. It
is a result of members having their pots
consolidated and these savers attributing
a value to this. This is the result of the first
step in the logic chain.
Summary of direct and indirect costs and benefits
214. The Department’s assessment is that a default consolidator solution would have no
cost burden, either directly or indirectly on members. The policy will focus on improving
outcomes for members.
215. All of the cost to schemes monetised are considered to be direct costs by the
Department.
216. Each of the costs and benefits to business and members have been explained in
further detail in the costs and benefits sections above [lines 123-163].
217. In the earlier sections of this Impact Assessment, the Department has included
estimates for the costs and benefits to both members and schemes of the introduction of a
multiple default consolidator solution. Therefore, the monetised values of any costs and
benefits to members have not been included again within this section, which instead focuses
on the direct costs and benefits to business.
Direct costs and benefits to businesses – EANDCB
218. Figure 19 summarises the direct costs and benefits to business of a multiple default
consolidator solution with all figures presented in present value form. The table also
summarises the EANDCB and Net Present Value figures for a multiple default consolidator
solution.
189.
Error! Unknown documentproperty name.
189
Figure 19 – Direct Costs and Benefits to Business – EANDCB and Net Present Value316
Impact Present Value (over the 10-year
appraisal period)317
Monetised Direct Costs
Familiarisation Costs £0.2m
Small Pots Data Platform (Build/Set-up and
Data Standardisation)
£212m
Transfer Costs £195m
Annual Direct Business Costs £47.3m
Monetised Direct Benefits
Pot Administration Savings £958m
Annual Direct Business Benefits £111.3m
Equivalent Annual Net Cost to Business
(EANDCB)
-£64.0m
Business Net Present Value
Present Value Direct Costs to Business £407m
Present Value Direct Benefit to Business £958m
Net Present Value Direct Impact on
Business
£551m
Wider impacts
Market Impact
219. One potential challenge of a consolidator model is around competition with the
potential for a distortive impact on the DC pensions market, especially compared to PfM.
This is because a large number of pots and assets could be concentrated in a few selected
schemes. This could potentially give them advantages in terms of economies of scale and
making them more appealing to members and employers.
220. However, the assessment is that given the existing concentration of small pots in
large schemes, with over 80% of the estimated 13m small pots within five large schemes
any market distortion is unlikely to be significant, especially as the proposed pot limit is
relatively low. The majority of small pots are believed to be within the trust-based market
within Master Trusts, which is already a relatively concentrated market, with the Master Trust
schemes accounting for 91% of total memberships and 90% active memberships within the
trust based market (including hybrid but excluding micro schemes)318
.
221. PPI’s DC Future Book estimated total assets of £650bn within workplace DC
schemes in 2024319
; of which £166bn is in master trusts (excluding hybrids)320
. Based on the
Department’s data the 13m deferred pots worth less than £1,000 account for about £4.3bn in
assets, or less than 1% of the total assets in the occupational DC market.
222. If the pot limit was £1,000 and all £4bn in assets below this were consolidated into a
single scheme, this is only equal to a shift of around 3% of the master trust market, and the
likelihood is that the chosen scheme would already have a large share of these existing
assets. However, £4bn is larger than many Master Trusts, and could cause lasting distortion
amongst schemes. A multiple default consolidator approach effectively mitigates any such
risk.
316
Some figures have been rounded to the nearest million where this was deemed appropriate throughout the table.
317
The aggregated monetised impacts are calculated for a ten-year appraisal period and all costs are given in 2024 prices and
use 2028 as the base year for the present value calculation, as given in the RPC/DBT Impact Assessment Calculator.
318
https://www.thepensionsregulator.gov.uk/en/document-library/research-and-analysis/occupational-defined-contribution-
landscape-2024
319
https://www.pensionspolicyinstitute.org.uk/media/hbrgvfw5/20240926-the-dc-future-book-2024-final.pdf
320
https://www.thepensionsregulator.gov.uk/en/document-library/research-and-analysis/occupational-defined-contribution-
landscape-2024
190.
Error! Unknown documentproperty name.
190
223. The £4.3bn in current assets represents over 10 years of automatic enrolment policy,
the annual displacement of new assets would be much less. The master trust market grew
by £43bn between 2024 and 2025, but estimated growth in deferred pots under £1,000 only
represents around 1% of this. The impact on market share becomes even less significant
where these assets are divided between multiple consolidators, especially where they
already have a large share of the new pots.
224. The schemes that become authorised consolidator schemes may look to encourage
members to transfer larger pots (above £1,000) into their schemes by leveraging on their
now existing relationship with these members with small pots. For some members this would
be in their own interest and could help to improve member engagement but it could have a
distortive impact on competition between schemes. It could enable the consolidator schemes
to gain a competitive advantage in areas such as decumulation services, however, due to
the already relative concentration of the DC market, specifically the trust-based market
which continues to become more concentrated with year-on-year consolidation, the impact
on the market would likely therefore be diminished. Any potential risk of a distortive impact
on areas including decumulation services could potentially be heightened with any uplift of
the £1,000 pot limit but any impact would ultimately depend on the current status of
competition within the DC market at the point any uplift did occur.
• The IFS321
has similarly raised the potential risk of an anti-competitive effect if there
was only a small number of consolidator schemes and the £1,000 limit was increased.
With the potential for a small number of schemes to control the market.
• The continued consolidation of the DC market, specifically in the trust-based side of
the market with the Government’s aim to support the growth in scale of schemes to
result in a smaller number of larger schemes may help to off-set any potential
competition risk. The consolidation of smaller schemes into a number of larger
schemes should ensure continued competition by avoiding a small number of larger
schemes being able to exert market dominance in terms of charges, etc over a
number of small schemes.
225. Member-led auto-consolidation of pension pots is currently very low at around 5%
according to the FCA’s Financial Lives Survey322
and therefore there is unlikely to be any
significant changes in the further consolidation of pension pots as a result of the
consolidation of small pots under a consolidator solution. As mentioned previously, even with
the introduction of the Pensions Dashboard and FCA’s consultation on targeted support no
significant changes in consolidation rates would be expected given the reliance on member
action which would likely remain low due to low engagement. As the market continues to
become more consolidated, members are more and more likely to have an existing pot with
their consolidator scheme and therefore the need for further consolidation of members’ other
potentially larger pension pots may reduce – reducing the wider impact on the pensions
market outside of the continued impact of a consolidating market.
Market Consolidation
226. The Defined Contribution (DC) Trust-based market has been consolidating over time
with the number of schemes falling by around 10% each year since 2012 with an average of
12% per year for the last three years 323
.
227. Other Pension Schemes Bill measures such as VfM may interact with any further
consolidation but the potential scale of this is uncertain. Therefore, consolidation is assumed
to continue at the rate of 12% annually. However, it would be reasonable to expect that VfM
and potentially other Pension Schemes Bill measures will consolidate the market further
which would accelerate the rate of consolidation above the current level of 12%. The effect,
however, cannot be accounted for as any impact cannot be known in advance.
321
https://ifs.org.uk/sites/default/files/2025-02/IFS-Report-Small-pension-pots-problems-and-potential-policy-
responses%20%281%29.pdf
322
https://www.fca.org.uk/publication/financial-lives/fls-2022-pensions.pdf
323
https://www.thepensionsregulator.gov.uk/en/document-library/research-and-analysis/occupational-defined-contribution-
landscape-2024/occupational-defined-contribution-landscape-2024-annex
191.
Error! Unknown documentproperty name.
191
228. Consolidation of the DC trust-based pensions market has resulted in a fall from 3,660
schemes in 2012 to 920 schemes in 2025. Over the same time period, the assets held,
driven by the rollout of Automatic Enrolment, has been rapidly rising (an increase of 825%
since 2012 to £205bn).
229. Much of the increase has been within Master Trusts (multi-employer pension funds),
with just 33 Master Trusts accounting for over three-quarters of DC assets, 91% of DC
memberships, and 90% of active savers (including hybrid schemes).
230. This trend of consolidation in the market is likely to continue and a number of pension
reforms have been aimed at encouraging further consolidation where this is in the interests
of members. As outlined in the Department’s previous consultation in 2021324
, consolidation
can help ensure all savers are receiving the best value for money from well-governed
schemes that can achieve economies of scale, especially at the lower end of the market.
Consolidation may also deliver greater opportunities for schemes to access a more diverse
range of investment products and investment strategies to the benefit of members and
broader UK economy. However, it is important consolidation is done in the interests of
members and that the wider pensions market continues to exhibit competition and
innovation.
231. The automatic consolidation of deferred small pots may further support market-wide
consolidation as default consolidators may increase their competitiveness from generating
more scale, encouraging smaller schemes to leave the market. However, this may be offset
by the improved financial sustainability for smaller schemes from removing loss-making
small pots off their books. Any behavioural impact on schemes cannot be known in advance.
The Department has therefore considered the potential costs/benefits to members and
schemes which might arise, but has not monetised any impacts of market consolidation
changes. This is due to a mixture of uncertain evidence, and market consolidation being
considered as an indirect impact of the reforms.
Wider Costs and Benefits to Individuals
232. Investment Returns – Consolidation could help drive investment performance as it
is known that scale can create a wider range of investment opportunities and help negotiate
lower investment fees325
. However, evidence that scale delivers better performance is mixed.
Analysis on a small sample of larger schemes suggests there is not a positive relationship
between scheme size and gross investment returns (see Figure 20). However, the
Department recognises this may be different if the much smaller pension funds were
included in the data, and that there may be a survivorship bias in good performing smaller
schemes. This is supported by evidence from Australia326
which found schemes had a weak
positive relationship between asset size and annual returns. This is seconded by analysis
from CEM benchmarking which found that, where larger schemes do outperform, this is
often due to scale efficiencies such as negotiating lower investment fees, internalising asset
management and/or accessing more diverse asset classes327
. These factors improve net
(after costs and charges), if not gross (underlying), risk-adjusted investment returns.
Consolidation, therefore, in itself may not necessarily drive investment performance (but
should not worsen outcomes and could improve the net returns members earn).
324
https://www.gov.uk/government/consultations/future-of-the-defined-contribution-pension-market-the-case-for-greater-
consolidation/future-of-the-defined-contribution-pension-market-the-case-for-greater-consolidation
325
https://assets.publishing.service.gov.uk/media/673f3ca459aab43310b95a8d/pension-fund-investment-uk-economy.pdf
326
https://www.apra.gov.au/sites/default/files/2023-
06/Drivers%20of%20performance%20-%20APRA%20paper%20for%20MMF%20conference%20Feb%202023.pdf
327
https://www.imcoinvest.com/pdf/research/CEM-Benchmarking-Report_A-Case-For-Scale-February-2022.pdf
192.
Error! Unknown documentproperty name.
192
Figure 20 - UK DC pension schemes, assets under management (AUM) by annualised
gross returns for younger savers over the last 5 years
Source: DWP calculations of Corporate Adviser MT/GPP Default Report 2024328
and Q2
2024 Returns
233. Governance – There is a wide-range of evidence that shows a positive relationship
between size and governance329
. Research carried out by the Pensions Regulator (TPR) in
2019 showed around 70% of micro (2-11 members) and 60% of small (12-99 members)
schemes were not hitting any of the five key governance requirements that applied to them.
Whereas 84% of large schemes (1000+ members), and 100% of Master Trusts, were
meeting at least two of the five key governance requirements. Additionally, Australian
regulators, and PPI research330
, have previously found the quality of investment governance
is a crucial driver of returns. Consolidation might therefore be expected to help deliver
improved governance and help deliver greater returns.
234. Costs – DWP’s Pension Charges Survey331
found around a 10-basis points
difference between smaller schemes and larger schemes – therefore size can drive down
costs. This may be expected given the ability to negotiate lower fees with a greater level of
assets through economies of scale. However, there is evidence332
there may be a limit to the
gains which can be made through scale on costs, with PPI finding the benefits start to level
off around $500m. Nevertheless, consolidation may be expected to lower charges for
members.
235. Fewer lost pension pots – PPI estimated in 2024333
there are over £31bn in lost
pension pots. This number is likely to continue growing and potentially lead to members
328
https://corporate-adviser.com/ca-master-trust-gpp-defaults-report-key-findings/ (Corporate Adviser Master Trust and GPP
Defaults Report, April 2024)
329
https://webarchive.nationalarchives.gov.uk/ukgwa/20200102111009mp_/https:/www.thepensionsregulator.gov.uk/-
/media/thepensionsregulator/files/import/pdf/dc-research-summary-report-2019.ashx
330
https://www.pensionspolicyinstitute.org.uk/research-library/research-reports/2017/2017-11-08-the-impact-of-dc-asset-
pooling-international-evidence/ (The impact of DC asset pooling: International evidence)
331
https://www.gov.uk/government/publications/pension-charges-survey-2020-charges-in-defined-contribution-pension-
schemes
332
https://www.pensionspolicyinstitute.org.uk/research-library/research-reports/2021/2021-11-18-what-can-other-countries-
teach-the-uk-about-measuring-value-for-money-in-pension-schemes/ (What can other countries teach the UK about measuring
Value for Money in pension schemes?)
333
https://www.pensionspolicyinstitute.org.uk/research-library/research-reports/2024/briefing-note-138-lost-pensions-2024/
(Briefing Note 138 – Lost Pensions 2024)
0%
2%
4%
6%
8%
10%
12%
14%
£0bn
£20bn
£40bn
£60bn
£80bn
£100bn
£120bn
Bundled DC Assets Gross Return (5yr:
30yrs From SPA
Providers
Assets
5-yr annualised return
(youngersaver)
193.
Error! Unknown documentproperty name.
193
missing out. A more consolidated market is likely to help members through having a reduced
number of pension schemes, reducing the likelihood of forgetting which scheme a pension
pot may be with. Combined with this, a default consolidator solution will result in all a
member’s small pots being consolidated into a single place, reducing the possibility of them
becoming lost. Other initiatives being planned, such as the Pensions Dashboard, will further
support this for engaged members, regardless of consolidation.
236. Fewer Pension Pots per Member – The bringing together of pension pots has the
potential to reduce the number of pension pots members have at the point of retirement and
therefore could improve clarity for members around the potential for their overall pension
savings to generate a retirement income.
• Research by the Department334
into decumulation decisions found there was
evidence of mental accounting across different sizes of DC pots. Participants were
more willing to liquidate smaller pots entirely, particularly if these were inactive,
compared to either not touching or drawing down a more complex mix of retirement
income products and cash from larger ones. If more members consolidated their DC
pensions it could encourage detailed consideration of exactly how much a member
needs to withdraw, rather than encouraging a tendency to close a whole pot,
because it doesn’t feel worth leaving a small amount in a pension.
• Investment Performance – There remains a risk, however, that some members
could be made worse off from having their old pension pots consolidated or moved
into a new scheme – most likely due to a worse level of investment performance. The
authorisation criteria for consolidator schemes should help to mitigate the potential
impact on members with consolidators required to continue to offer members value
for money. At the aggregate level, the relatively low initial value for eligibility would
mean any potential impact of any investment performance variation would be
minimised.
• Flat Fees – Members with small pots below the current level of the deminimis335
(£100 threshold below which pots can’t be charged a flat fee) which if consolidated
could then have a combined value above the deminimis could face higher charges if
a flat fee were to be charged which could erode the value of the consolidator pot over
time. The Department is considering an increase in the level of deminimis, for
consolidated members, which should help to protect more pots of lower value from
flat fees.
Wider Costs and Benefits to Industry
237. Gain/Loss of business – Consolidation means some schemes may merge their
scheme into others (largely into Master Trusts). This is essentially a transfer cost/benefit,
with one scheme losing with another scheme gaining. As many small pension schemes are
largely run by trustees (with many doing this voluntarily), it is not anticipated that there would
be any material employer impact through consolidation. Consolidation should help larger
schemes achieve greater scale in a quicker timeframe, supporting their business model and
helping profitability.
238. Cost of seeking out a new scheme to transfer into – DWP previously estimated336
there may be costs arising for schemes seeking out larger schemes who they believe would
take them on should they decide to move their pension scheme members into a different
scheme. With larger schemes such as Master Trusts able to provide increased access to
investment opportunities and reduce costs337
compared to smaller schemes, therefore
334
https://www.gov.uk/government/publications/pension-freedoms-a-qualitative-research-study-of-individuals-decumulation-
journeys/pension-freedoms-a-qualitative-research-study-of-individuals-decumulation-journeys#factors-affecting-decumulation-
decisions
335
https://www.thepensionsregulator.gov.uk/en/document-library/scheme-management-detailed-guidance/funding-and-
investment-detailed-guidance/cost-and-charge-
restrictions#:~:text=On%206%20April%202022%2C%20a,scope%20of%20the%20charge%20cap.
336
https://www.legislation.gov.uk/ukia/2021/44/pdfs/ukia_20210044_en.pdf
337
https://www.mercer.com/en-gb/insights/investments/portfolio-strategies/accelerating-trend-master-
trusts/#:~:text=In%20a%20Master%20Trust%2C%20the,a%20typical%20single%2Demployer%20plan.
194.
Error! Unknown documentproperty name.
194
merging into larger schemes could benefit both members and employers. This was
estimated at around £60,000 across the industry; though on a per scheme basis, was very
low (around an hour of a Trustee’s time).
239. Fewer Pots to administer should generate costs savings across the pensions
industry, with the same amount of pension savings being administered across a smaller
number of individual pension pots as a result of consolidation.
240. Existing Consolidators – Some existing pension schemes’ business models
revolves around offering member-led consolidation and in theory could therefore be placed
in direct competition with a government legislated consolidator solution. These pension
schemes charge members for the consolidation of their multiple pensions pot into one
singular pension pot within their scheme. A similar process to which a consolidator solution
would operate for small pots meaning the free cost nature of a consolidator solution could
impact these existing consolidators.
• For members with small pots that meet the eligibility for consolidation they may no-
longer feel the need to seek the services of the existing consolidator schemes as
they could now have their small pots consolidated free of charge rather than paying
one of the existing schemes that offers consolidation services.
• An overall reduction in the number of pension pots held by members as a result of a
consolidator solution could result in some members feeling less inclined to seek
member-led consolidation through an existing consolidator scheme for those pots
that are above the eligibility criteria of a consolidator solution. As members may feel
they can better manage a fewer number of pension pots without the need for
consolidation.
• Whilst there would ultimately be some overlap between a default consolidator
solution and the existing business model of the existing consolidator schemes, the
eligibility of a consolidator solution should help to mitigate this impact.
• A consolidator solution’s primary aim would be to improve member outcomes by
addressing the challenges of deferred small pots and is therefore focused on the
lower end of the market with a focus on unprofitable pots. At implementation only
deferred pots with a value below £1,000 would be eligible for consolidation under a
consolidator solution.
• For any members with pots outside of this eligibility criteria they would need to
continue to seek the services of existing consolidator schemes if they wanted their
pensions pots across multiple schemes to be consolidated. Therefore, keeping the
higher end of the market with larger, more profitable pots still open to the existing
consolidator schemes.
• Individuals would also retain the right to opt-out of any consolidation solution and
therefore even those members with small pots could choose to have their small pots
consolidated themselves through an existing consolidator scheme.
• So, whilst there is a potential business impact on the existing schemes offering
consolidation services, a consolidator solution would be focused on addressing the
member and scheme detriment of the low-value and unprofitable deferred pots and
therefore the wider consolidation market would remain unimpeded. Competition
within the existing consolidator market of higher value and profitable pots would not
be directly impacted by the implementation of a consolidator solution which at
implementation would only focus on those deferred pots with a value below £1,000.
• For the existing consolidator schemes much of their focus is likely on pots of a higher
value than £1,000 due to the unprofitable nature of these pots, which is supported by
the continued proliferation of small pots suggesting very little member-led
consolidation of small pots is currently taking place.
Benefits to Wider UK Economy
195.
Error! Unknown documentproperty name.
195
241. One key wider benefit of an increase in the consolidation of small pots could be the
increased share of assets saved in large, well-governed DC schemes potentially able
to direct funds towards longer-term, illiquid investments. This could mean that key,
potentially strategically important sectors of the economy such as smaller innovative firms,
housing, infrastructure, and green infrastructure receive more investment flows than
previously which could have wide-ranging benefits across society.
242. There remains no consensus on what is the optimal size of DC pension fund in terms
of assets but a growing number of papers suggest that the number of benefits increases at a
scale of £25bn-£50bn AUM and above338
. With the scale of benefits thought to increase for
those schemes at a higher level in terms of AUM.
243. It is likely that the schemes that would choose to become consolidators would be at
the larger end of £25bn-£50bn AUM with the continued growth of the largest Master Trust
schemes as consolidation of the DC trust-based market continues at a rate of around 12%
each year. The opportunity for consolidators to grow in scale as a result of the consolidation
of small pots should mean that the consolidator schemes are best placed to benefit from the
economics of scale experienced by larger pension funds.
Equality impacts with respect to the protected characteristics
244. The characteristics that are protected by the Equality Act 2010339
are age, disability,
gender and gender reassignment, ethnicity, marriage or civil partnership, pregnancy and
maternity, religion or belief, sexual orientation. To enable Ministers to fulfil the requirements
of the Public Sector Equality Duty (PSED), the Department has undertaken an Equality
Analysis of the May 2025 pensions package. Ending the proliferation of deferred small pots
is one of a number of measures in the Pension Schemes Bill and therefore considerations of
any equalities implications are included in the wider Pensions package Equality Analysis.
245. Overall, the department does not consider that the proposals materially impact any of
the groups with protected characteristics under the Equality Act 2010 (in Northern Ireland,
the Equality Act is not enacted but other antidiscrimination legislation applies). However, this
will continue to be considered as final policy details emerge.
• However, according to recent analysis from the Institute for Fiscal Studies – based on
longitudinal analysis of survey respondents using the Understanding Society dataset
– groups most likely to build up small pots over their working life were women, low
earners, and potentially younger employees340
. This means that the small pots policy
may have some (positive) equality impact consideration along sex and age
dimensions.
Sensitivity analysis of Multiple Default Consolidator (preferred option)
246. Due to the uncertainty behind much of the data that surrounds small pots, the
Department has conducted a sensitivity analysis of the costs and benefits to members and
schemes to explore this uncertainty.
247. Tables displaying sensitivity analysis of a Pot follows Member solution are included in
Annex D.
248. Figure 21 below summarises the high estimate of the costs and benefits under a
multiple default consolidator solution.
Figure 21 - High estimate of costs and benefits of a multiple default consolidator
solution
Multiple Default Consolidator
Industry Individual
Familiarisation Costs: £0.3m Consumer Surplus (benefit): £155.5m
338
https://assets.publishing.service.gov.uk/media/673f3ca459aab43310b95a8d/pension-fund-investment-uk-economy.pdf
339
https://www.legislation.gov.uk/ukpga/2010/15/contents
340
https://ifs.org.uk/publications/small-pension-pots-problems-and-potential-policy-responses
196.
Error! Unknown documentproperty name.
196
Small Pots Data Platform (cost): £324.0m Lower Charges (benefit): £1,208.7m
Transfer Costs: £255.3m
Pot Administration Savings: £1,382.3m
Net Benefit: £802.8m Net Benefit: £1,364.2m
249. Figure 22 below summarises the low estimate of the costs and benefits under a
multiple default consolidator solution.
Figure 22 - Low estimate of costs and benefits of a multiple default consolidator
solution
Multiple Default Consolidator
Industry Individual
Familiarisation Costs: £0.1m Consumer Surplus (benefit): £46.3m
Small Pots Data Platform (cost): £108.0m Lower Charges (benefit): £402.9m
Transfer Costs: £178.0m
Pot Administration Savings: £970.3m
Net Benefit: £684.2m Net Benefit: £449.2m
250. Figures 21 and 22 display the low and high estimates for the monetised costs of a
multiple default consolidator solution, the sensitivity analysis is explained in further detail
below.
251. The sensitivity analysis of the pot administration savings and the transfers costs is
based on a number of assumption changes that impact the number of transfers and overall
cumulative reduction of small pots estimated; the cost of each transfer and the
administration costs per pot have themselves not been assumed to change. However, the
impact of a change in transfer and administration costs has been modelled in Annex B.
252. The sensitivity analysis of the other costs and benefits (included in Figures 21 and
22) are based on stand-alone changes in the assumptions for each individual cost and
benefit and are based (where applicable) on the number of transfers and the cumulative
reduction in small pots modelled previously in Figure 13.
253. Figure 23 below displays the low, central and high estimate for the monetised costs
and benefits of a multiple default consolidator solution, with the change in assumption
explained alongside each monetised cost/benefit (except transfer costs and administration
costs, where the change in assumptions are explained in Figure 24).
Figure 23 – Sensitivity Analysis of a Multiple Default Consolidator Solution
Costs/Benefit Low Central High
Familiarisation Costs £94,000: Based on a
reduction in the
estimated number of
policy documentation
pages.
£189,000 £283,000: Based on
an increase in the
estimated number of
policy documentation
pages.
Small Pots Data
Platform and Data
Standardisation
(cost)
£108m: Based on
1/3rd
of the upfront
cost estimates of the
Pensions Dashboard
to account for the
significant data
standardisation that
will already have
taken place for the
Pensions Dashboard
that could potentially
£216m £324m: Based on
the estimates of the
upfront costs of the
Pensions
Dashboard.
197.
Error! Unknown documentproperty name.
197
be leveraged upon
for a consolidator
solution.
Transfer Costs £178m £215m £255m
Pot Administration
Savings (benefit)
£970m £1.2bn £1.4bn
Consumer Surplus
(benefit)
£46m: Based on
median WTP of
£5.00
£81m £155m: Based on
mean WTP of only
those respondents
who thought the
automatic
consolidation of
small pots should be
offered, £16.80
Lower Charges
(benefit)
£403m: Based on 1
basis-point reduction
in the Average %
AMC.
£806m £1.2bn: Based on 3
basis-points
reduction in the
Average % AMC.
254. Figure 24 below explains the changes made in the assumptions behind the
Department’s modelling that influences the low and high estimates for the transfer costs and
pot administration savings. The low and high estimate for the number of transfers and
cumulative reduction of small pots is modelled in Annex E.
Figure 24 – Low and High assumptions for the modelling of a Multiple Default
Consolidator solution
Assumption Low Central High
Yearly growth
in Small Pots
1.0m based on the first 12
years of AE.
1.3m 1.6m based on analysis of
HMRC RTI data on the
instances of members ceasing
pension contributions, to reflect
that not all schemes are
represented in the Department’s
data collected from industry.
Stock of
Small Pots
19.0m: Based on a yearly
growth of 1.0m small pots
(above) from the current
estimate of 13m small pots.
20.8m 22.6m: Based on a yearly
growth of 1.6m small pots
(above) from the current
estimate of 13m small pots.
Opt-Out Rate 5%: Based on a 1.5
percentage points increase
over the central estimate of
3.5% - still below the opt-out
rate for AE but represents
the potential that some
members may engage with a
consolidator solution and
choose to opt-out.
3.5% 2%: Based on a 1.5 percentage
points decrease over the central
estimate of 3.5% - significantly
below the opt-out rate for AE
but represents the low
engagement of members
already AE enrolled.
198.
Error! Unknown documentproperty name.
198
Mismatch
Rate
9%: Based on the
assumption that the level of
mismatches will not
decrease overtime and is
kept in-line with ITM’s341
analysis of mismatch
estimates.
5% 1%: Based on the assumption
that overtime the level of
mismatches will decrease and
evidence342
around the
Pensions Dashboard
suggesting that continuous
matching attempts could result
in correct matches being made
with a mismatch rate below 1%.
255. The low and high assumptions in Figure 24 above are based on calculating a high
and low estimate for the number of transfers and cumulative reduction in the number of
small pots under a multiple default consolidator solution. The transfer costs and
administration savings are then estimated based on the change in the number of transfers
and the cumulative reduction of small pots. Therefore, for the mismatch and opt-out rate
assumptions, the higher the % the lower the number of transfers and the cumulative
reduction in small pots.
256. The detail of the assumptions in Figure 24 have been discussed in the earlier
sections of this IA in more detail.
Impact on Small and Micro Businesses (SaMBA)
257. The Department has considered the potential impacts that the implementation of a
multiple default consolidator solution could have on micro and small businesses, including
employers and pension schemes. Whilst a number of potential costs have been identified,
attempts have been made to mitigate the impact that small and micro businesses may face
as a result.
258. Some small pension schemes could be considered smaller businesses and to be
consistent with the Pensions Dashboard Impact Assessment343
, as well as with other
Pension Schemes Bill Measures, Small and Micro businesses are defined as DC schemes
having fewer than 1,000 members. This is not a perfect definition of a small/micro business
as scheme size and employer size do not always perfectly correlate, but best attempts to
estimate the impact on smaller schemes. However, trust-based schemes can be set up by
both smaller and larger employers, with a trend of smaller employers using Master Trusts for
workplace pensions to minimise costs and improve governance. The nature of pension
schemes can often differ to that of other businesses, with a large number of assets managed
by a pension scheme not necessarily correlating into a large number of employees.
Exemptions
259. One of the overarching benefits of a default consolidator solution is its automatic
nature and the need for no involvement from employers in the consolidation process. A
consolidator solution would only involve pension pots that are currently deferred and there
would be no implications on pension pots that are currently active. As deferred pots, the only
pots in scope of a consolidator solution, would no-longer be receiving any employer
contributions and therefore should not impose any costs on employers. The costs would be
on the pension schemes themselves who would carry the costs of the transfer process.
341
https://www.plsa.co.uk/Portals/0/Documents/Policy-Documents/2021/Small-pots-cross-industry-co-ordination-group-update-
report.pdf
342
https://www.pensionfusion.com/sites/default/files/2022-
09/Pension%20Fusion%20-%20Pensions%20Dashboards%20-%20Getting%20to%20the%20heart%20of%20matching%20-%
20Single%20page%20view.pdf
343
https://www.legislation.gov.uk/ukia/2022/81/pdfs/ukia_20220081_en.pdf
199.
Error! Unknown documentproperty name.
199
260. A default consolidator model would be focused on pension schemes (rather than
wider businesses or employers) and the costs would be borne by schemes themselves, with
benefits for both members and schemes expected.
261. As discussed previously [line 10], the Department proposes based on the grounds of
proportionality that Small Self-Administered Schemes and Executive Pension Plans would
be excluded and that to apply the Default Consolidator framework to these micro schemes
would be disproportionate due to the cost the schemes would incur as a result. Therefore,
the very smallest pension schemes have been exempted.
262. As per the above referenced definition, small schemes (defined as having between
12 and 999 members) would be within the scope of a default consolidator solution.
Proportionality
263. The Department has estimated the monetised costs and benefits to small schemes,
along the same methodology as described previously within the main parts of this Impact
Assessment. As described below this shows that there is estimated to be a net benefit to
small schemes from this legislation.
264. To estimate the total number of small schemes in scope at the start of the appraisal
period, a number of assumptions have been used.
265. Consolidation – The reduction in the number of DC schemes each year has been
based on the assumption that the recent trend of consolidation will continue, with analysis of
TPR scheme returns data344
, suggesting an average consolidation rate around 12% per year
for the last three years. The number of contract-based schemes has been kept constant
across the appraisal period at around 30 contract-based schemes as the consolidation of the
DC market is currently focused on the trust-based side of the market. Some consolidation
within the contract-based market could occur but any such consolidation cannot be known in
advance and the absence of consistent consolidation over recent years means the
Department cannot quantify any potential impacts, any such consolidation would be
expected to be minimal.
266. Proportion of Small Schemes – Small schemes were calculated to account for 71%
of total DC schemes. This proportion has been kept constant across the analysis over the
10-year appraisal period due to the uncertainty of the extent to which consolidation might
impact this.
• The rate of consolidation of DC schemes is being driven by the reduction in small
schemes as they consolidate into the larger Master Trusts. Therefore, it could be
considered likely that with continued consolidation the proportion of small schemes in
the DC market will fall over time. If the number of small schemes were to fall in-line
with the expectation that the consolidation of the market will continue the costs and
benefits to small schemes outlined in Figure 25 could be reduced.
267. Based on these assumptions, the estimated number of small schemes in scope at
the start of the appraisal period (2028) is around 490.
268. Familiarisation costs have been estimated at around £135,000 for small schemes
split evenly across the two years of transition costs (2028, 2029). Whilst this represents a
significant proportion of the total estimated familiarisation costs, due to the larger number of
smaller schemes these costs would represent an average total cost of around £270 for each
of the 490 small schemes.
269. The costs and benefits to small schemes after implementation (2030-2037) are
based on the number of small pot transfers (modelled in Figure 13) that would be expected
344
https://webarchive.nationalarchives.gov.uk/ukgwa/20240605050724/https://www.thepensionsregulator.gov.uk/en/document-
library/research-and-analysis/occupational-defined-contribution-landscape-2023/occupational-defined-contribution-landscape-
2023-annex
200.
Error! Unknown documentproperty name.
200
to be transfers from small schemes. Based on TPR data345
, just 0.53% of deferred
memberships within trust-based schemes are thought to be within small schemes and this
proportion has been kept constant over the 10-year appraisal period.
• Therefore, as the majority of small pots are thought to be within trust-based schemes,
0.53% of all transfers each year have been assumed to be transfers from small
schemes.
270. Figure 25 estimates the costs and benefits to small schemes over the 10-year
appraisal period.
Figure 25 – The estimated costs and benefits to small schemes of a Multiple Default
Consolidator solution346
Estimated
Number of
schemes in
scope
… of which
small
schemes
Estimated
costs to
small
schemes
Estimated
cumulative
benefit to small
schemes
Net
2028 690 490 £67,000 -£67,000
2029 620 440 £67,000 -£67,000
2030 550 390 £431,000 £793,000 £362,000
2031 490 350 £27,000 £843,000 £816,000
2032 440 310 £27,000 £892,000 £865,000
2033 390 280 £27,000 £942,000 £915,000
2034 350 250 £27,000 £992,000 £965,000
2035 310 220 £27,000 £1,041,000 £1,014,000
2036 280 200 £27,000 £1,091,000 £1,064,000
2037 250 180 £27,000 £1,141,000 £1,114,000
Cumulative £754,000 £7,734,000 £6,980,000
271. Figure 25 does not monetise the potential cost implications on small schemes of a
central mechanism (referred to throughout as a Small Pots Data Platform) but there would
be the potential for small schemes to face some cost as a result depending on the decisions
of the Department on how to recoup the costs from schemes.
272. Work is ongoing to consider the feasibility and implementation of a central mechanism
and how options to fund the build and set-up costs may work in practice. Therefore, it is not
currently known what the cost implications on small schemes may be as a result of the
implementation of a central mechanism. Based on a Small Pots Data Platform any costs
could potentially be proportioned across schemes of different sizes, with the largest
schemes being those schemes that would benefit the most from the consolidation of small
pots. At this stage it is not possible, however, to proportion the costs to small schemes
specifically.
273. The most significant costs to small schemes are expected in the year of
implementation (2030) where the current stock is expected to be dealt with and therefore is
expected to be the year with the highest number of transfers. Costs in 2030 to small
schemes are estimated at around £431,000 and are expected to be outweighed by benefits
345
https://webarchive.nationalarchives.gov.uk/ukgwa/20240605045559/https://www.thepensionsregulator.gov.uk/en/document-
library/research-and-analysis/occupational-defined-contribution-landscape-2023
346
The number of schemes within the table have been rounded and the cost and benefit figures have been rounded to the
nearest £1,000 where applicable
201.
Error! Unknown documentproperty name.
201
of around £793,000. The costs are then expected to level off, with an estimated annual cost
just below £27,000.
274. The costs are the result of the estimated cost of transfers, with the cost kept steady at
£10 per pot for each scheme, representing half of the estimated £20 cost per transfer. The
receiving schemes would be the authorised consolidator schemes and it is anticipated that
these would not be small schemes and are likely to be amongst the largest pension
providers within the DC market. Therefore, only the ceding cost of transfers would be
applicable to smaller schemes. The transfers costs per pot for small schemes has assumed
to remain level over the appraisal period, unlike the wider reduction expected for the average
cost of transfers across the market. This is because small schemes would not be expected
to benefit from the same level of economies of scale like the larger schemes due to the
much smaller number of transfers and reduced use of bulk transfers expected by small
schemes.
275. The benefits to small schemes are the reduction in administration costs through the
reduction in the number of pots to administer as a result of the consolidation of multiple small
pots. Each transfer is assumed to represent a cost saving of £20 minus the average AMC
based on the average small pots value. This is a cumulative benefit each year, with the
benefit through the transfer of a small pot in one year being counted as a benefit each year
thereafter.
276. The Department therefore considers any costs to small schemes associated with a
default consolidator solution to be proportionate, with the Department estimating that on an
aggregate level small schemes will benefit over the 10-year appraisal period.
277. As shown in Figure 26 below, the total benefit over the appraisal period to small
schemes is estimated at £6.4m (Present Value), representing an annual net direct cost to
small schemes of -£0.7m.
• For those schemes with members with small pots the cost of transferring the small
pots to the consolidator schemes would be expected to be outweighed by the cost
saving through a reduction in administration costs each year due to the transfer out of
likely loss-making small pots.
Figure 26 – SAMBA EANDCB – direct costs and benefits to small businesses
Impact Overview Cost/Benefit to small
businesses (2024 prices
summed over appraisal period)
One-off costs Small schemes familiarise
with legislation and
implement systems
£0.1m
Ongoing costs Small schemes comply
with the annual small pots
policy requirements
£0.6m
Total direct costs to small business are £0.7m (£0.1m per year)
Administration savings Small schemes see the
benefit of lower
administration costs due
to the reduction in the
number of small pots.
£6.4m
Total direct benefits to small businesses are £6.4m (£0.7m per year)
EANDCB to small schemes = £0.7m benefit per year (2024 prices)
278. The Department therefore considers it proportionate to include small schemes within
the scope of the multiple default consolidator legislation. Any costs that small schemes
202.
Error! Unknown documentproperty name.
202
would occur are not considered disproportionate, as a consolidator solution will provide the
opportunity for small schemes with small pots to benefit from the removal of likely loss-
making pots.
Mitigations
279. The Department’s view that a default consolidator model should help benefit small
schemes on an aggregate level across the 10-year appraisal period is a significant
mitigating factor for the inclusion of small schemes within the scope of the policy.
280. Small schemes with small pots would be expected to benefit monetarily from the
consolidation of small pots through the reduction in loss-making small pots that they have to
administer.
281. The Department has also considered the following mitigations to the costs imposed on
small businesses:
• Central Mechanism – Whilst there is still uncertainty in the decision and
implementation of a central mechanism to support a multiple default consolidator
solution. The Department is clear that a central mechanism is likely needed to
support the transfer and consolidation process. A central mechanism should help to
mitigate some of the administration costs to small schemes and reduce the
administration time required to administer the transfer of small pots to the
consolidator schemes.
• No employer involvement – There would be no active employer involvement within
a multiple default consolidator solution due it its focus on deferred pots, which would
be no-longer receiving employer contributions. There is therefore no expected costs
to employers as a result of the transfer or consolidation process for small pots under
a multiple default consolidator solution.
• Benefits outweigh the costs – As referred to previously, it is considered that the
costs to small schemes will be outweighed by the benefit of administration savings
from the reduction in the number of small pots. The majority of the costs are
expected to be to the larger pensions schemes where the majority of the small pots
problem is believed to be concentrated within.
Monitoring and Evaluation
282. After implementation the Department recognises the importance of monitoring and
evaluating a multiple default consolidator solution and remains committed to ensuring that
appropriate evaluation is undertaken. Throughout the policy process the Department has
worked closely with industry and would continue to do so in the evaluation of a small pots
solution.
283. One significant element of the Department’s monitoring and evaluation would be a
planned statutory review after implementation. The initial review would then be supported by
a range of future monitoring and evaluation methods, of which some are explored below.
• The first review should be undertaken within 5 years of implementation, with
implementation in this case being defined as the commencement of duties on ceding
schemes to transfer eligible pots for consolidation under the default consolidator
model. Any future reviews should be undertaken periodically as deemed necessary by
the Secretary of State.
284. The Department has considered the following ways to monitor and evaluate a
multiple default consolidator solution:
• Work with industry stakeholders – The Pensions Policy Institute continues to
conduct research on the number of lost pots347
, of which many may be small pots.
347
https://www.pensionspolicyinstitute.org.uk/research-library/research-reports/2024/briefing-note-138-lost-pensions-2024/
(Briefing Note 138 – Lost Pensions 2024)
203.
Error! Unknown documentproperty name.
203
Monitoring any changes in the research findings over time could help to illustrate the
impact of a consolidator solution on the number of small pots across the market and
any wider implications on the number of lost pots overall. The Department would also
continue to work with other industry stakeholders to monitor and evaluate the impact
of a consolidator solution.
• Qualitative or Quantitative research – The Department is considering the potential
to commission or conduct research to explore views across stakeholders, this could
include views from schemes and members. Research could draw on the experiences
from across schemes and members and explore how attitudes towards consolidation
and pension saving as a whole have changed as a result. This could also include
member views of the opt-out process and of having their small pots consolidated.
• Industry Engagement – The Department will continue to work closely with industry
and engage constructively to address any barriers that may arise under a default
consolidator solution. The Department remains committed to ensure that throughout,
a consolidator solution whilst ensuring improved member outcomes works for the
wider pensions industry and schemes.
• Delivery Group Discussions – The Department has chaired a number of group
discussions with industry in the policy development process and could do so if further
consultation is needed both prior to and after the implementation of a policy solution.
• Secondary Sources – The Department has used a number of secondary sources
throughout this Impact Assessment and would look to do so in the evaluation and
monitoring of a consolidator solution. Using sources such as the Financial Conduct
Authority’s Financial Lives Survey or ONS’ Wealth and Assets Survey, will allow the
Department to consider the wider impacts of a consolidator solution. This could
include monitoring changes in member confidence around pension savings or
progress on the consolidation of small pots.
• The Department may also conduct a further data gather exercise with providers after
implementation to evaluate and monitor the impacts of a consolidator solution on the
number of small pots across schemes. Previous data gather exercises would provide
a useful base mark to evaluate the impact of a consolidator solution.
285. The Department will continue to consider further ways it could monitor and evaluate a
consolidator solution.
286. The Department reserves the right to and remains committed to continually review
the eligibility criteria for consolidation to ensure a consolidator solution continues to benefit
members and support the pensions industry. Any specific changes to the eligibility criteria of
pension pots to be in-scope of the default consolidator solution would be subject to
affirmative regulations.
287. The “success” of the default consolidator approach within the first 5 years of
implementation can be assessed against the following but not limited criteria:
• Fewer small pots in the DC market.
• Consolidation of the DC pensions market, with fewer, better managed large
schemes.
• The successful authorisation of consolidators to allow for the consolidation of
deferred small pots across the DC pensions landscape.
• Improved data matching, with the smooth matching of member data across schemes
for the transfer of pension pots between schemes.
• A reduction in the number of pension pots, resulting in members having a lower
number of pension pots but of larger value (helping to support members in
retirement).
• Consistently low levels of mismatches in the movement/consolidation of small pots
between schemes.
204.
Error! Unknown documentproperty name.
204
• Improved performance on average for members with a DC pension, especially those
who previously had a number of small deferred pots.
• A potential for a financially stable and digitally possible expansion in the number of
pots that are eligible for consolidation.
Annexes
Annex A: Estimates of the number of jobs per individual
288. The Department had previously estimated an average of 11 jobs per individual over
their working lives, to support the Department’s understanding and work around the Small
Pots issue, 3 methodologies were explored to strengthen the Department’s estimate for the
average number of jobs per individual. The 3 methodologies used were as follows: HMRC
RTI data, DWP PENSIM models and external research and data as supporting evidence.
289. The analysis of these 3 methodologies was referenced above [line 16] but is
presented further below: His Majesty’s Revenue and Customs (HMRC’s) Real Time
Information (RTI) is a reporting system for income taxed via Pay As You Earn (PAYE). It is a
requirement of employers and pension schemes to report payments to employees or
recipients of occupational pensions to HMRC on or before each payment date where it is
practical to do so. HMRC provided DWP with RTI job count data, which the department has
then used here as a proxy for the average number of jobs per individual over a lifetime by
using the RTI employment tables which show the count of unique employment identifiers for
each NINO.
Figure 27 – Mean and Median job count figures by age and gender
Count of Jobs per Person
Female Male Overall
N Mean Median N Mean Median N Mean Median
Age
Band
Unknown 3,300 2 1 1,500 3 2 3,258,000 1 1
Under 16 10,300 1 1 9,000 1 1 20,000 1 1
16 - 25 3,315,000 4 3 3,319,000 4 3 6,640,000 4 3
26 - 35 5,404,000 5 4 5,618,000 6 4 11,034,000 6 4
36 - 45 4,864,000 4 3 5,201,000 4 3 10,066,000 4 3
46 - 55 4,097,000 4 3 4,271,000 4 3 8,368,000 4 3
56 - 65 4,082,000 4 3 4,155,000 4 3 8,237,000 4 3
66+ 7,248,000 3 2 7,804,000 3 2 15,054,000 3 2
Source: HMRC RTI Employment Tables
290. Figure 27 above summarises the mean and median number of unique jobs held by
individuals within different age bands with a split by gender as reported by HMRC’s RTI data
from April 2014 – March 2024. The age bands outlined within the table were calculated as of
4th
April 2024.
291. The distribution of individuals across the RTI data is heavily focused on a job count
ranging between 1-20 jobs, with less than 1% of individuals having a total job count of 20 or
above and 95% having 10 or less jobs according to the RTI data. Whilst the mean figures
from the table above provide an average number of unique employments by age and
205.
Error! Unknown documentproperty name.
205
gender, it was deemed more appropriate to use the median job count figures to avoid
skewness from a small number of individuals reported to have had a significant number of
jobs.
292. The median level of jobs increases between ages 16-35 with the highest median
number of 4 jobs per individual between ages 26-35. The number of jobs per individual then
begins to fall across the age bands, to a median of 2 jobs for individuals aged 66 and above.
293. Figure 28 combines the mean and median job count figures across the age bands,
excluding those unknown, under 16 or aged 66+ in order to remain consistent with other
analysis where a starting age for employment of 16 and a retirement age of 65 was
assumed. The age band 16-25 has also been excluded as not all the individuals covered
within this age band would be covered by the 10 years of RTI data since 2014.
Figure 28 – Overall mean and median job count figures by gender
Mean Median
Female 17 13
Male 18 13
Overall 18 13
Source: HMRC RTI Employment Tables
294. By combining the job count figures across the age bands to depict an estimate for the
total job count for individuals over their lifetime it should be caveated that these estimates
are extrapolating the trends and figures from the 10 years of RTI data across the assumed
working life of individuals across an averaged basis. Therefore, DWP’s PENSIM model has
also been used to help build up the evidential basis around average job counts.
295. DWP’s PENSIM model is a dynamic micro simulation model that ages individuals
within a sample whilst stimulating the key life events that occur from birth to death. Outputs
have been used from PENSIM 2 from 2010348
which modelled pensions through to 2100
alongside 2024 outputs from PENSIM 3.
296. Unlike with the RTI data, the mean outputs from the two PENSIM models have been
used as estimates for the average job count per individual, with the outputs from both
PENSIM models expected to be an underestimation of the true average job count. Figure 29
summarises the mean job count estimates from the PENSIM models. The outputs from
PENSIM 2 suggest an average of 11 jobs per individual with 25% of individuals having 14 or
more jobs. The outputs from PENSIM 3 suggest a slight reduction in comparison with an
average of 8 jobs per individual with 25% having 10 or more jobs.
Figure 29 – Mean Job count figures from PENSIM models
Sources Mean
2010 report (PENSIM 2) 11
PENSIM 3 (2024) 8
Source: DWP’s PENSIM 2 and PENSIM 3 models
348
https://assets.publishing.service.gov.uk/government/uploads/system/uploads/attachment_data/file/214585/cp-oct10-full-
document.pdf
206.
Error! Unknown documentproperty name.
206
297. Similar to the distribution of the RTI outputs, the distribution across both PENSIM
models is weighted towards the lower end of the job count range; with a peak in distribution
around 10-11 jobs across both models, highlighted by Figure 30.
Figure 30 – Job Count distribution across PENSIM models 2 and 3
Source: DWP’s PENSIM 2 and PENSIM 3 models
298. The outputs from the PENSIM models help to strengthen the decision to use the
median job count figures from HMRC’s RTI data, with the outputs of the PENSIM models
considerably below the mean job count figures from the RTI outputs. The outputs from the
PENSIM models are however, considered to be an underestimation of the average job count
due to the nature in which the models classify a job change. Any change in job that occurs
within the same industry, where the individual stays within the same occupation, is not
classified as a change in job under the PENSIM models and therefore has no impact on an
individual’s overall job count.
299. Based on all the evidence above; by combining the median figures from the RTI data
and the mean figures from the PENSIM models an average of roughly 11 jobs per individual
is considered a sufficient proxy to illustrate that on average an individual has multiple jobs
across their lifetime. A proxy that considers the higher RTI outputs and the potential
underestimation of the PENSIM models.
300. A figure around 11 jobs per individual is comparable internationally with an average
of 12 jobs over a lifetime for individuals in the USA according to the 2019 Bureau of Labor
Statistics (BLS) survey349
.
349
https://www.thebalancemoney.com/how-often-do-people-change-jobs-2060467
0
100
200
300
400
500
600
700
800
1 2 3 4 5 6 7 8 9 10 11 12 13 14 15 16 17 18 19 20 21 22 23 24 25 26 27 28
Number of individuals (thousands)
2010 2024
207.
Error! Unknown documentproperty name.
207
Annex B: Sensitivity analysis of a Change in Transfer or Administration Costs
301. Based on the Department’s best estimate modelling of the number of transfers and
the resultant cumulative reduction in small pots (Figure 13), the impact of a change in the
assumption of transfer and administration costs has been estimated. Figure 31 below
explains the change in the transfer and administration cost assumptions.
Figure 31 – Low and High assumptions of Transfer and administration costs
Assumption Low Central High
Transfer Costs Transfer costs are
assumed to start at
£14 and remain
fixed at £14 per
transfer across the
10-year appraisal
period.
Transfer costs are
assumed to start at
£20 per transfer
before gradually
falling to £14.
Transfer costs are
assumed to remain
fixed at £20 across
the 10-year
appraisal period.
Administration
Costs
Administration
costs are assumed
to be £10 per pot
across the 10-year
appraisal period.
Administration
costs are assumed
to be £20 per pot
across the 10-year
appraisal period.
Administration
costs are assumed
to be £30 per pot
across the 10-year
appraisal period.
302. Figure 32 below displays the high and low estimates for the transfer costs and pot
administration savings of a multiple default consolidator solution across the 10-year
appraisal period based on the change in assumptions above (Figure 31) and the best
estimate modelling (Figure 13).
Figure 32 – The low and high estimate for total transfer costs and pot administration
savings
Assumption Low Central High
Transfer Costs £163m £215m £233m
Pot Administration
Savings
£534m £1.2bn £1.8bn
The cost and benefit estimates have been rounded
208.
Error! Unknown documentproperty name.
208
Annex C: Estimated impact tables of Single Consolidator solutions
303. Figures 33 and 34 below highlight the impact of the transfer and consolidation
process and monetised costs and benefits of the transfer process under a Single
consolidator (new scheme) and Single consolidator (existing scheme) solution.
Figure 33 – Impact of the transfer and consolidation process under a Single
consolidator (new scheme) model
Single Consolidator (new scheme)
No. of transfers
(m)
Cumulative reduction in
deferred small pots (m)
Cost
(£m)
Benefits
(£m)
Net
(£m)
2030/31 19.1 -4.7 381.1 72.4 -309
2031/32 1.2 -5.3 21.5 80.3 59
2032/33 1.2 -5.9 19.1 88.3 69
2033/34 1.2 -6.5 16.7 96.2 80
2034/35 1.2 -7.1 16.7 104.2 88
2035/36 1.2 -7.7 16.7 112.2 95
2036/37 1.2 -8.3 16.7 120.2 103
2037/38 1.2 -8.9 16.7 128.1 111
Cumulative 27.4 -8.9 505.1 801.9 297
Figure 34 – Impact of the transfer and consolidation process under a Single
consolidator (existing scheme) model
Notes (Figure 33 and Figure 34)
i. Solution implemented in 2030/31.
ii. 3.5% of individuals are assumed to opt-out.
iii. 5% mismatch rate
iv. Pot size limit is £1,000 (2024 Earnings Terms)
v. Volumes rounded to the nearest 0.1m
vi. Costs rounded to the nearest £10m.
vii. The costs of administering a deferred small pension pot (and therefore the savings) is assumed to be £20 per
annum. The total cost of transferring a deferred small pension pot is assumed to start at £20 in 2030 and gradually
fall to £14 by 2034.
Single Consolidator (existing scheme)
No. of transfers
(m)
Cumulative reduction in
deferred small pots (m)
Cost
(£m)
Benefits
(£m)
Net
(£m)
2030/31 11.9 -8.4 237.3 145.3 -92
2031/32 0.7 -9.2 13.4 157.2 144
2032/33 0.7 -10.0 11.9 169.1 157
2033/34 0.7 -10.9 10.4 181.0 171
2034/35 0.7 -11.7 10.4 193.0 183
2035/36 0.7 -12.5 10.4 204.9 194
2036/37 0.7 -13.3 10.4 216.8 206
2037/38 0.7 -14.1 10.4 228.7 218
Cumulative 17.1 -14.1 314.5 1496.1 1182
209.
Error! Unknown documentproperty name.
209
viii. Initial stock is estimated to be 20.8m pots in 2030, with an annual flow of 1.3m pots.
ix. Based on trends from Wealth and Assets Survey data, the proportion of individuals with multiple deferred small pots
is assumed to be between 30%-40% in 2030.
x. The scheme chosen to be a single existing consolidator is assumed to account for around 40% of deferred small pot
creation and roughly ¼ active members.
Annex D: Sensitivity analysis of Pot follows Member
304. The Department has conducted a sensitivity analysis of the transfer and
consolidation process of small pots under a Pot follows Member solution, by adjusting the
estimated job churn of those saving into workplace pensions.
305. Low Estimate – Based on the number of individuals that start saving into a pension
each year. Lower charges benefit to members is based on the assumption of a 0.5 basis
points reduction in % AMC.
306. Central Estimate – Based on the total number of members saving within AE
workplace pension schemes350
that are expected to move jobs each year based on the
assumption that individuals move jobs on average every 3 years.
307. High Estimate – Based on the difference between the central and low estimate
added on to the central estimate of the job churn to reflect a higher estimate of job churn
and any potential volatility in the labour market. Lower charges benefit to members is based
on the assumption of a 2 basis points reduction in % AMC.
308. Figure 35 and Figure 36 highlight the high estimate scenario analysis of PfM.
Figure 35 – High scenario estimate of the costs and benefits of PfM
Pot follows Member
Industry Individual
Familiarisation Costs: £0.3m Consumer Surplus (benefit): £107.9m
Small Pots Data Platform (cost): £324.0m Lower Charges (benefit): £805.8m
Transfer Costs: £213.5m
Pot Administration Savings: £1270.1m
Net Benefit: £732.3m Net Benefit: £913.7m
Figure 36 – High estimate scenario impact under a PfM solution
Pot Follows Member (High estimate)
No. of
transfers (m)
Cumulative reduction in deferred
small pots (m)
Cost
(£m)
Benefits
(£m)
Net
(£m)
2030/31 4.1 -4.1 82.1 75.6 -6
2031/32 2.9 -7.0 57.5 128.5 71
2032/33 1.6 -8.6 32.9 158.7 126
2033/34 0.4 -9.0 8.2 166.3 158
2034/35 0.4 -9.4 8.2 173.9 166
2035/36 0.4 -9.9 8.2 181.5 173
2036/37 0.4 -10.3 8.2 189.0 181
2037/38 0.4 -10.7 8.2 196.6 188
Cumulative 10.7 -10.7 213.5 1270.1 1057
350
https://www.gov.uk/government/statistics/workplace-pension-participation-and-savings-trends-2009-to-2023/workplace-
pension-participation-and-savings-trends-of-eligible-employees-2009-to-
2023#:~:text=Trends%20in%20Workplace%20Pension%20Participation,-
The%20workplace%20pension&text=Most%20groups%20have%20seen%20trends,million)%20participating%20the%20year%
20previous.
210.
Error! Unknown documentproperty name.
210
Notes:
i. Solution implemented (transfers begin) in 2030/31.
ii. 2% of individuals are assumed to opt-out.
iii. Pot size limit is £1,000 (2024 Earnings Terms)
iv. 1% mismatch rate
v. Volumes rounded to the nearest 0.1m
vi. An average of 1.3 small pots per individual with small pots
vii. The costs of administering a deferred small pension pot is assumed to be £20 per annum. Accounting for an average
management charge (AMC) of 0.48% based on the average small pot value, the saving through the reduction in
small pots is around £18 per pot per annum.
viii. The total cost of transferring a deferred small pension pot is assumed to be £20 across the 10-year appraisal period.
ix. Based on trends from Wealth and Assets Survey data, the proportion of individuals with multiple deferred small pots
is assumed to be between 30%-40% in 2030.
x. Individuals are assumed to move jobs every 3 years.
309. Figure 37 and Figure 38 highlight the low estimate scenario analysis of PfM.
Figure 37 – Low scenario estimate of the costs and benefits of PfM
Pot follows Member
Industry Individual
Familiarisation Costs: £0.1m Consumer Surplus (benefit): £32.1m
Small Pots Data Platform (cost): £108.0m Lower Charges (benefit): £201.5m
Transfer Costs: £115.0m
Pot Administration Savings: £683.9m
Net Benefit: £460.9m Net Benefit: £233.6m
Figure 38 – Low estimate scenario impact under a PfM solution
Pot Follows Member (Low estimate)
No. of
transfers (m)
Cumulative reduction in deferred
small pots (m)
Cost
(£m)
Benefits
(£m)
Net
(£m)
2030/31 2.2 -2.2 44.2 40.7 -3
2031/32 1.5 -3.8 31.0 69.2 38
2032/33 0.9 -4.6 17.7 85.5 68
2033/34 0.2 -4.9 4.4 89.6 85
2034/35 0.2 -5.1 4.4 93.6 89
2035/36 0.2 -5.3 4.4 97.7 93
2036/37 0.2 -5.5 4.4 101.8 97
2037/38 0.2 -5.7 4.4 105.9 101
Cumulative 5.7 -5.7 115.0 683.9 569
Notes:
i. Solution implemented (transfers begin) in 2030/31.
ii. 5% of individuals are assumed to opt-out.
iii. Pot size limit is £1,000 (2024 Earnings Terms)
iv. 9% mismatch rate
v. Volumes rounded to the nearest 0.1m
vi. An average of 1.3 small pots per individual with small pots
211.
Error! Unknown documentproperty name.
211
vii. The costs of administering a deferred small pension pot is assumed to be £20 per annum. Accounting for an average
management charge (AMC) of 0.48% based on the average small pot value, the saving through the reduction in
small pots is around £18 per pot per annum.
viii. The total cost of transferring a deferred small pension pot is assumed to be £20 across the 10-year appraisal period.
ix. Based on trends from Wealth and Assets Survey data, the proportion of individuals with multiple deferred small pots
is assumed to be between 30%-40% in 2030.
x. Individuals are assumed to move jobs every 3 years.
Annex E: High and Low modelling of a Multiple Default Consolidator solution
310. As part of the sensitivity analysis of a multiple default consolidator solution the
Department has modelled a high and low estimate for the impact of a default consolidator
solution in terms of the number of transfers and the cumulative reduction of small pots.
311. The change in assumptions behind the modelling has been explained previously in
Figure 24 as part of the sensitivity analysis section.
312. The Department’s high estimate modelling of the impacts of the introduction of a
Multiple Default Consolidator solution are modelled in Figure 39 below, calculating the
projected costs and benefits of the transfer process and the reduction of small pots through
consolidation.
Figure 39 – High estimate of the impacts under a Multiple Default Consolidator Model
Multiple Default Consolidator (High estimate)
No. of
transfers
(m)
Cumulative reduction
in deferred small pots
(m)
Cost
(£m)
Benefits
(£m)
Net
(£m)
2030/31 9.3 -7.6 186.5 127.0 -59
2031/32 0.7 -8.5 11.9 140.1 128
2032/33 0.7 -9.4 10.6 153.2 143
2033/34 0.7 -10.3 9.3 166.2 157
2034/35 0.7 -11.1 9.3 179.3 170
2035/36 0.7 -12.0 9.3 192.4 183
2036/37 0.7 -12.9 9.3 205.5 196
2037/38 0.7 -13.8 9.3 218.6 209
Cumulative 14.0 -13.8 255.3 1,382.3 1,127
Notes:
i. Solution implemented in 2030/31.
ii. 2% of individuals are assumed to opt-out.
iii. 1% mismatch rate
iv. Pot size limit is £1,000 (2024 Earnings Terms)
v. Volumes rounded to the nearest 0.1m
vi. The costs of administering a deferred small pension pot is assumed to be £20 per annum. Accounting for an average
management charge (AMC) of 0.48% based on the average small pot value, the saving through the reduction in
small pots is around £18 per pot per annum. The total cost of transferring a deferred small pension pot is assumed to
start at £20 in 2030 and gradually fall to £14 by 2033.
vii. Initial stock is estimated to be 22.6m pots in 2030, with an annual flow of 1.6m pots.
viii. Based on trends from Wealth and Assets Survey data, the proportion of individuals with multiple deferred small pots
is assumed to be between 30%-40% in 2030.
ix. For the purposes of the analysis, it’s assumed there are five consolidators in the multiple default consolidator option.
This is not government policy and will be decided by the number of schemes who apply to and meet the criteria to be
a consolidator. The five consolidators are assumed to cover more than 70% of the market.
212.
Error! Unknown documentproperty name.
212
313. The Department’s low estimate modelling of the impacts of the introduction of a
Multiple Default Consolidator solution are modelled in Figure 40 below, calculating the
projected costs and benefits of the transfer process and the reduction of small pots through
consolidation.
Figure 40 – Low estimate of the impacts under a Multiple Default Consolidator Model
Multiple Default Consolidator (Low estimate)
No. of transfers
(m)
Cumulative reduction
in deferred small pots
(m)
Cost
(£m)
Benefits
(£m)
Net
(£m)
2030/31 7.0 -5.3 139.7 95.2 -45
2031/32 0.4 -5.7 6.6 102.6 96
2032/33 0.4 -6.1 5.9 110.1 104
2033/34 0.4 -6.6 5.2 117.5 112
2034/35 0.4 -7.0 5.2 125.0 120
2035/36 0.4 -7.5 5.2 132.5 127
2036/37 0.4 -7.9 5.2 140.0 135
2037/38 0.4 -8.4 5.2 147.4 142
Cumulative 9.6 -8.4 178.0 970.3 792.3
Notes:
i. Solution implemented in 2030/31.
ii. 5% of individuals are assumed to opt-out.
iii. 9% mismatch rate
iv. Pot size limit is £1,000 (2024 Earnings Terms)
v. Volumes rounded to the nearest 0.1m
vi. The costs of administering a deferred small pension pot is assumed to be £20 per annum. Accounting for an average
management charge (AMC) of 0.48% based on the average small pot value, the saving through the reduction in
small pots is around £18 per pot per annum. The total cost of transferring a deferred small pension pot is assumed to
start at £20 in 2030 and gradually fall to £14 by 2033.
vii. Initial stock is estimated to be 19m pots in 2030, with an annual flow of 1m pots.
viii. Based on trends from Wealth and Assets Survey data, the proportion of individuals with multiple deferred small pots
is assumed to be between 30%-40% in 2030.
ix. For the purposes of the analysis, it’s assumed there are five consolidators in the multiple default consolidator option.
This is not government policy and will be decided by the number of schemes who apply to and meet the criteria to be
a consolidator. The five consolidators are assumed to cover more than 70% of the market.
213.
Error! Unknown documentproperty name.
213
Title: Guided Retirement for Defined Contribution
IA No:
RPC Reference No: RPC-DWP-25032-IA(1)
Lead department or agency: Department for Work and Pensions
Other departments or agencies:
Impact Assessment (IA)
Date: May 2025
Stage: Final
Source of intervention: Domestic
Type of measure: Primary legislation
Contact for enquiries: Adam Sheriwala
Summary: Intervention and Options RPC Opinion: Green (fit for purpose)
Cost of Preferred (or more likely) Option (in 2024 prices)
Total Net Present
Social Value
Business Net Present
Value
Net cost to business per
year Business Impact Target Status
Qualifying provision
£1,550m -£109m £13m
What is the problem under consideration? Why is government action or intervention necessary?
Automatic Enrolment has led to a large increase in the number of workplace pension savers, with 88% of eligible
employees (over 20m) participating in a workplace pension with increasing numbers now reaching retirement with
pension pots. However, individuals must make complex financial decisions and need to manage investment and
longevity risks throughout retirement. Hundreds of pension schemes do not currently provide a decumulation service (a
product to access pension savings) to their members. Taken together this is leading individuals to transfer their pension
with high charges/costs or potentially making sub-optimal decisions. The market failures include an information failure
with only 29% of 55–59-year-olds saying they had a clear plan for how to take their Defined Contribution (DC) pension.
Additionally, there is a principal-agent problem: employers choose the pension scheme on the employees’ behalf,
however, this may result in employers choosing schemes which do not have appropriate decumulation options available
for employees. Overall, inertia around pension savings is often the reason for the lack of member-led action and
awareness of options at decumulation.
What are the policy objectives of the action or intervention and the intended effects?
The policy places duties on DC workplace schemes to: i) Develop and offer a range of decumulation solutions,
products and services, which could be achieved through transferring members to an appropriate scheme; ii)
Develop default solution(s), based on the general profile of their members which would include a later life
income. The member would be placed into the default unless they opt-out. This should ensure all pension savers
have access to decumulation services with longevity protection. The policy objectives are to help to reduce transfer
costs, generate additional investment returns by remaining invested for longer, and support individuals who are
unable—or don’t want—to make a complex decision impacting their later-life (not just at the point of access).
What policy options have been considered, including any alternatives to regulation? Please justify preferred
option (further details in Evidence Base)
Policy option 0: Do nothing – This would lead to millions of individuals being unable to access a drawdown (or similar)
type option and members having high fees/charges from transferring money to another scheme.
Policy option 1: Ensure provision of guidance to members – Although the market is adapting and is increasingly
focused on encouraging members to take-up guidance, this is not consistent and large number of schemes are not
developing their decumulation offering.
Policy option 2 (preferred): Primary legislation (Bill) - This would provide the necessary powers to ensure all
members are provided with a decumulation service which would include a default solution incorporating later life income,
which they can be enrolled into or opt out of.
Will the policy be reviewed? It will be reviewed. If applicable, set review date: May 2030
Is this measure likely to impact on international trade and investment? No
Are any of these organisations in scope? MicroNo
Small
Yes
Medium
Yes
LargeYes
What is the CO2 equivalent change in greenhouse gas emissions?
(Million tonnes CO2 equivalent)
Traded:
N/A
Non-traded:
N/A
I have read the Impact Assessment and I am satisfied that, given the available evidence, it represents a
reasonable view of the likely costs, benefits and impact of the leading options.
Signed by the responsible Minister: Date:
214.
214
Summary: Analysis &Evidence Policy Option 2
Description: FULL ECONOMIC ASSESSMENT
Price Base Year
2024
PV Base
Year 2025
Time Period
Years 10
Net Benefit (Present Value (PV)) (£m)
Low: 270 High: 6,424 Best Estimate: 1,550
COSTS (£m) Total Transition
(Constant Price) Years
Average Annual
(excl. Transition) (Constant
Price)
Total Cost
(Present Value)
Low 28 15 154
High 91 77 718
Best Estimate 56 39 370
Description and scale of key monetised costs (undiscounted) by ‘main affected groups’
All initial set up costs and on-going costs are borne by pension schemes including familiarisation costs with the proposed legislation
(around £300,000). In addition, there will be training requirements for schemes and their employees (estimated at £7m). There will be
further costs to create partnerships to buy-in decumulation services for those not offering a service (estimated at £46m up-front cost)
and reviewing partnerships (every 3 years) costing around £4m over 10 years. For Master Trusts (large multi-employer funds) who do
not currently offer the latest appropriate decumulation products, it is estimated that developing and running a service will cost around
£385m over ten years.
Other key non-monetised costs by ‘main affected groups’
There may be a number of non-monetised costs including reduced innovation (schemes deciding to do the minimum viable product in
developing options). There are opportunity costs from pension schemes having to reallocate some of their resource into developing
these products which may come at the expense of focusing on other initiatives. For members, there may be a loss of welfare if
individuals end-up in a default they would prefer not to be in. However, the proposals do not stop people accessing a lump sum and
individuals can still continue to access their pension in full or transfer.
BENEFITS (£m) Total Transition
(Constant Price) Years
Average Annual
(excl. Transition) (Constant
Price)
Total Benefit
(Present Value)
Low 0 129 988
High 0 858 6,578
Best Estimate 0 251 1,920
Description and scale of key monetised benefits (undiscounted) by ‘main affected groups’
1) Members receive greater investment returns through being defaulted into a decumulation option rather than having to fully
withdraw their pension as cash at point of access (facing lower returns and tax implications). The benefits increase over time
(estimated £480m over 10 years); 2) Members receive greater investment returns in the lead up to retirement, as schemes can
now enter some of their members into a higher-returning asset allocation in anticipation of these members entering a default solution
rather than converting their assets into cash as previously members are more likely to fully withdrawing their pension due to a lack of
decumulation options (estimated £1,690m over 10 years); 3) Members save through fewer transfer costs. As many schemes do
not currently offer decumulation services, members may have to fully withdraw or transfer their pension at retirement. This may lead to
transfer costs or higher charges in retail funds (estimated benefit of £10m over 10 years); 4) Schemes benefit from charges by
money remaining invested in pension funds after members reach retirement. Higher pension pot values and remaining invested will
lead to greater revenues from the charges being applied (estimated benefit totalling £320m).; 5) Schemes benefit from charges by
members entering default asset allocation (which provides higher returns than cash asset allocation) before retirement. Higher
pension pot values and remaining invested will lead to greater revenues from the charges being applied (around £15m).
Other key non-monetised benefits by ‘main affected groups’ There are a range of additional benefits for members which are
incredibly challenging to monetise. For example, members should face reduced complexity, lower search costs and simplification of
decisions (reducing the likelihood of poor financial decisions).
Key assumptions/sensitivities/risks Discount rate (%) 3.5%
Estimates are highly uncertain and will need further development at secondary legislation. Costs are drawn from extensive industry
engagement with large pension funds (who account for the vast majority of savers) but are harder to obtain for smaller pension funds.
Investment returns are a key driver of improved member benefits but are highly sensitive. The results are highly dependent on behaviour
change from members who enter a default solution.
BUSINESS ASSESSMENT (Option 2)
Direct impact on business (Equivalent Annual) £m: Score for Business Impact Target (£m)
Costs: £43 Benefits: £30 Net: £13
215.
215
Evidence Base
Problem underconsideration and rationale for intervention
After the Impact Assessment was completed, more recent information on the DC landscape became
available. The contextual and background information within the impact assessment has been updated
to reflect the latest information. However, it is important to note that the calculations are based on
previous years’ worth of data. The changes in the landscape are in line with expectations, and therefore
it does not materially change the cost or benefits of the policies.
1. Automatic Enrolment (AE) was first introduced in 2012, where employers are required to default
eligible workers into a workplace pension. This has led to a huge increase in the number of
workplace pension savers, with 88% of eligible employees (over 20m) participating in a pension in
2023. The vast majority of savers are saving into a Defined Contribution (DC) pension1
. A DC
pension is a pot of money for retirement which depends upon factors including the amount the
individual and employer pay in, the fund’s investment performance and costs/charges.
2. The workplace pensions market is split into three markets:
. Defined Benefit (DB) – This is a type of pension which pays a retirement income based on
earnings, accrual rate, and length of service rather than the amount of money an individual has
contributed to the pension. Of which, the market is further split into:
o Public sector DB, where the main funded scheme is the Local Government Pension
Scheme in England and Wales (LGPS) which is made up of 86 Administering Authorities
which operate 87 individual funds in 2023/24.
o Private sector DB where there were around 5,000 pension schemes in 2024.
Defined Contribution (DC) – This is a type of pension whereby pension contributions are made
by employees/employers and are invested to create a pension pot at retirement. The DC market
is further split into:
o Trust-based market - A pension scheme governed by a board of trustees who have a
fiduciary duty towards scheme members. The board of trustees manage investments on
the members’ behalf. This is regulated by the Pensions Regulator (TPR). In 2025, there
were around 920 pension schemes with 12 or more members2
.
o Contract-based market - A pension scheme governed by a provider and an independent
governance committee (IGC) where a contract exists between the individual scheme
member and the provider. This is regulated by the Financial Conduct Authority (FCA). In
2023, there were estimated to be around 30 firms with an authorised DC workplace
pension business
Collective Defined Contribution (CDC) – these schemes are an emerging type of pension
scheme based on risk sharing between pension savers. CDCs aim to move the risk away from
the individual (as is the case under Defined Contribution schemes) and away from the employer
(as is the case under Defined Benefit schemes). The only CDC arrangement in the UK so far is a
scheme by the Royal Mail.
3. The vast majority of AE-eligible employees are saving into a Defined Contribution (DC) workplace
pension3
and this market is the focus of this Impact Assessment given this is where the policy
applies.
4. Overall, it is estimated there are around £300bn and 5m active savers in the contract-based DC
market4
, and £200bn and 11m active savers in the DC trust-based market5
. Data is more readily
available on trust side, which has a much greater number of schemes6
. The DC-trust landscape is
1
https://www.gov.uk/government/collections/workplace-pension-participation-and-savings-trends
2
https://www.thepensionsregulator.gov.uk/en/document-library/research-and-analysis/occupational-defined-contribution-landscape-2024
3
https://www.gov.uk/government/collections/workplace-pension-participation-and-savings-trends
4
https://www.fca.org.uk/publication/consultation/cp24-16.pdf
5
https://webarchive.nationalarchives.gov.uk/ukgwa/20240605050724/https:/www.thepensionsregulator.gov.uk/en/document-library/research-
and-analysis/occupational-defined-contribution-landscape-2023/occupational-defined-contribution-landscape-2023-annex
6
https://www.gov.uk/government/publications/trends-in-the-defined-contribution-trust-based-pensions-market/trends-in-the-defined-contribution-
trust-based-pensions-market
216.
216
growing in scaleand maturing quickly with 30.6 million DC memberships7
in 2023, an increase of 6%
since 2024. DC trust workplace pension assets have grown to £205 billion, increasing from only £22
billion in 20128
.
5. There are three main types of pension schemes in the DC market:
o Master Trusts – an occupational pension scheme that provides DC pensions for two or more
unconnected employers (though often a lot more).
o Single Employer Trusts (SETs) – pension schemes which are managed for and on behalf of a
single employer.
o Group Personal Pensions (GPPs) – DC contract-based schemes which are regulated by the
FCA.
6. The DC market has been consolidating, with the number of pension schemes reducing from around
3,700 in 2012 to around 950 schemes now. Close to 900 of these schemes are single-employer
trusts, traditionally set-up by employers to support their workforce. However, as AE resulted in all
employers needing to enrol their employees (where eligible) into a workplace pension, there has
been a rise in Master Trusts (multi-employer pension schemes). Across around 30 schemes, these
now account for 91% total and 90% of active memberships and 81% of assets in the DC trust
market. In addition, there are around 30 GPPs, which operate in the DC contract market. Across
those two markets, there are now 7 DC schemes managing over £25bn worth of bundled assets,
where economies of scale are most apparent enabling schemes to access a wider range of asset
classes, negotiate lower fees and improve their governance9
.
7. AE has led to more people saving into a pension. However, inertia is strong and engagement is low.
For example, 47% have not reviewed how much their pension is worth in last 12 months10
and over
94% of pension savers are invested in a pension scheme’s default investment strategy11
. This
highlights the importance of government intervention, where appropriate, to deliver outcomes for
members who may not otherwise engage with their pension.
Regulation and types of DC pensions
8. DC pension schemes are either personal or stakeholder pensions. They can be workplace pensions
arranged by an employer or private pensions arranged by an individual; the legislation focuses on
workplace pension schemes. Regulation of the pensions industry in the UK is split between the FCA
and TPR:
o Financial Conduct Authority (FCA) regulates personal pensions, including workplace
personal pensions (contract-based pension schemes).
o The Pension Regulator (TPR) regulates occupational pensions (trust-based pension
schemes).
9. The legislation on guided retirement focuses on schemes regulated by the TPR, looking at the DC
Trust market.
Pension Freedoms
10. In 2015, Pension Freedoms were introduced which enabled consumers to flexibly access their DC
pension pots from the age of 55 and use the funds for a wider range of options including full cash
withdrawal and drawdown (where a proportion of the pot is accessed on a regular basis). Prior to
Pension Freedoms, consumers almost always had to purchase an annuity (which provides you with a
regular guaranteed income in retirement, bought from an insurer, for life).
7
‘Memberships’ is used throughout this IA. This more closely represents the number of DC pots - the number of members/savers is not
knowable given an individual may have multiple pots with different providers.
8
https://www.thepensionsregulator.gov.uk/en/document-library/research-and-analysis/occupational-defined-contribution-landscape-2023
9
Corporate Adviser 2024 MT GPP Default Report (https://corporate-adviser.com/research/)
10
https://www.fca.org.uk/publication/financial-lives/fls-2022-pensions.pdf
11
https://www.thepensionsregulator.gov.uk/en/document-library/research-and-analysis/occupational-defined-contribution-landscape-2024
217.
217
11. As aresult, there has been a noticeable shift away from individuals accessing annuities to a greater
number of individuals withdrawing their pension in full or accessing drawdown (see figure 1 below).
There are 4 common ways of accessing a pension now:
i) Full Cash Withdrawal – Where the pension pot is fully cashed out by the individual.
ii) Drawdown – The individual decides how much to take out and when; a regular income can
be chosen. How long it lasts depends on investment performance and withdrawal rate.
iii) Annuities – Buying a guaranteed regular income from an insurer.
iv) Uncrystallised Funds Pension Lump Sum (UFPLS) – The individual leaves money in the
pension pot and take lump sums from it when needed.
Figure 1: Individuals accessing pension pot for the first time by type of pension product
Source: FCA Retirement Income Market Data 2023/2412
12. Through Pension Freedoms and the rise in DC pensions, there are much greater responsibilities on
the individual in retirement:
a) Investment risk – The individual carries the investment risk in a DC pension pot, meaning
this may increase, or decrease, in retirement depending on market conditions and
investment choice.
b) Longevity risk – The individual must consider how long they expect to live for, and therefore
how to spread their pension pot out over their lifetimes (if they choose not to take an
annuity). This uncertainty may mean individuals exhaust their pots too early or potentially
drawdown too little, affecting living standards in retirement while leaving significant assets
when they die.
c) Greater choice/decisions – The individual now faces a much greater choice of available
products to access; but engagement with pensions is very low and suitability of products will
vary across individuals.
12
https://www.fca.org.uk/data/retirement-income-market-data-2023-24
Annuities
Drawdown
UFPLS
Full Cash
Withdrawal
-
50,000
100,000
150,000
200,000
250,000
H2 H1 H2 H1 H2 H1 H2 H1 H2 H1 H2 H1 H2 H1 H2 H1 H2
2015/16 2016/17 2017/18 2018/19 2019/20 2020/21 2021/22 2022/23 2023/24
218.
218
13. To addresssome of these challenges, in 2018, the FCA published its Retirement Outcomes Review
(ROR)13
. It assessed how the DC market was evolving following Pension Freedoms to address
emerging issues that may cause consumer harm and to put the contract-based market on a good
footing for the future. This introduced a number of initiatives in the DC contract-based market
including:
• Wake-up packs (information sent to consumers before they decide which retirement income
product to purchase) are sent from age 50 and with a one-page headline document to support
decision-making ahead of retirement.
• Investment Pathways – Schemes should offer ready-made drawdown investment solutions
within a simple choice architecture. This developed into presenting non-advised savers four
options over a 5-year time horizon14
:
i) I have no plans to touch my money.
ii) I plan to use my money to set-up a guaranteed income (annuity).
iii) I plan to start taking money as a long-term income.
iv) I plan to take out all of my money.
14. A post-implementation review15
by FCA found encouraging signs of Investment Pathways, showing:
▪ Take-up of around 50% in 2023.
▪ Charges on pension pots were generally low, though some firms did charge above the
guidelines of 0.75% of assets under management charge cap.
15. The FCA have also recently consulted on the introduction of Targeted Support as part of their wider
Advice, Guidance Boundary Review work16
. Targeted Support is aimed at providing individuals with
suggestions based on a ‘people like you’ principle. Final decisions on the introduction of Targeted
Support and a rules-based consultation are expected in Summer 2025.
16. However, in the trust-based market, there has been no regulation imposed on schemes in relation to
retirement products since the introduction on Pension Freedoms. This is despite the UK experiencing
significant growth in the number of members saving into DC trust-based schemes from 4.7m in 2015
to 30.6m in 2025. As a result, many more people will need to make important decisions about how
they want to access their pension savings going forward. Although the majority of members are yet to
reach normal minimum pension age (NMPA, currently 55, the age which you can access your private
pension)17
, there are currently 7.9m memberships aged over 50, showing a growing need to support
those coming up to retirement.
17. The decisions pension savers must make when they decide to access their pension assets are
complex. This is particularly true for those members who have been brought into pension saving
through AE, where inertia during the accumulation phase has led to high participation (88% of eligible
employees participate in a workplace pension). However, many are disengaged: for example, the
Financial Lives Survey 2022 found 29% of people currently contributing to a DC pension do not know
how much their pension pot is worth18
. Many UK adults also have limited financial literacy; 38% of UK
adults rated their knowledge of financial matters as low19
. As pot sizes will continue to grow over time
through greater contribution levels (AE was only fully rolled out in 2019 at current contribution levels
of 8% of qualifying earning bands), the importance of decision-making and managing larger amounts
of money during retirement will become increasingly important.
Rationale for intervention
13
https://www.fca.org.uk/publication/market-studies/ms16-1-3.pdf
14
https://www.fca.org.uk/publications/multi-firm-reviews/investment-pathways-post-implementation-review
15
https://www.fca.org.uk/publications/multi-firm-reviews/investment-pathways-post-implementation-review
16
https://www.fca.org.uk/news/news-stories/advice-guidance-boundary-review-november-2024-update
17
The normal minimum age at which consumers can access their pension – currently 55 and rising to 57 in 2028.
18
https://www.fca.org.uk/publication/financial-lives/fls-2022-pensions.pdf
19
https://www.fca.org.uk/publication/financial-lives/financial-lives-survey-2022-key-findings.pdf
219.
219
18. There isa clear rationale for intervention with multiple market failures. In particular:
• Information failure: DWP’s Planning and Preparing for Later Life Survey (PPLL) found only
29% of 55–59-year-olds said they had a clear plan for how to take their DC pension, while
17% reported that they did not know they had to make a choice. As a result, there is a clear
need to increase awareness, communications, and support to individuals given the challenge
of the decision being faced.
• Principal-Agent problem: The employer chooses the pension scheme, but the employee
bears the risk (including poor investment performance and whether the scheme has a
decumulation offering). Only 5% of employers have ever switched DC scheme20
. As
individuals cannot easily switch pension schemes (the employer does not have to pay the
contribution if the employee changes scheme), there is a clear need to ensure all pension
schemes offer a decumulation service (or arrange to transfer to one that does) to avoid
individuals being at risk of needing to transfer their pension pot which may face additional
costs.
• Low take up of guidance and advice: There is a positive correlation with pot size and take-up
of advice/guidance. However, many people are accessing DC pots without advice or
guidance, despite the introduction of the Stronger Nudge to Pensions Wise guidance
legislation21
. DWP’s Planning and Preparing for Later Life Survey (2022) found that nearly
three in ten people (29%) who had accessed a DC pension had not received information,
advice or guidance from their pension scheme, Pension Wise or a financial advisor. This
suggests greater support is needed from schemes, via legislation, to support individuals in
their decision-making.
• Engagement with pensions remains low across the majority of members, with inertia a
significant barrier to member benefits. The inertia around pensions means many members
make uniformed choices with regards to their pension savings, which results in the member
suffering detriment in the future. The default nature of automatic enrolment means that many
members are unaware they are contributing into a pension and therefore remain disengaged
and unaware of the various ways to access their pension savings at retirement. The Financial
Lives Survey (2022) found that 30% of DC members in accumulation did not know the
approximate size of their pension savings.22
Early findings from the Planning and Preparing
for Later Life (PPLL) Wave 2 survey found around one-fifth (21%) of individuals yet to access
their pension did not know that they had to make a choice on how to access their savings at
decumulation.23
If members were more engaged with their pension savings, decisions at
decumulation may look different, particularly around the decision of a full-cash withdrawal,
which most members currently opt for24
. Instead, the inertia and the current pensions
landscape (where there is not a consistent decumulation offering across the market nor a
default decumulation option for members saving through inertia) potentially hampers
retirement outcomes for members and may prevent them from making the most optimal and
sustainable decumulation decision.
• Inequality: There is currently very different decumulation offers in place across the DC trust-
based market and DC contract-based market. Individuals are highly unlikely to know which
type of pension scheme they are enrolled in; but may face very different levels of support and
product offerings. The legislation will help narrow the gap on the support and options
available at retirement for individuals.
19. Although the market is evolving and adapting with an increasing number of schemes offering
decumulation services, there are still many who do not or only offer certain products, and not one
provider offers a decumulation product by default. The decumulation call for evidence on the
20
https://assets.publishing.service.gov.uk/media/6501971439d9f1000d3d3a37/dwp-employer-survey-2022-report.pdf
21
Introduced in 2022, requiring all pension scheme providers to refer their members to Pension Wise guidance when they decided to access
their pension savings, unless the member actively opted out.
22
https://www.fca.org.uk/publication/financial-lives/financial-lives-survey-2022-key-findings.pdf
23
Survey results haven’t yet been published. PPLL (2025) forthcoming.
24
https://www.gov.uk/government/publications/planning-and-preparing-for-later-life/planning-and-preparing-for-later-life;
https://www.fca.org.uk/data/retirement-income-market-data-2023-24
220.
220
proposed legislation25
found decumulationproducts offered in the market differ greatly by scheme
(with many smaller schemes offering no retirement income products), leading to a non-equitable
market. This inequality is not just restricted to smaller schemes. The Corporate Advisor report26
found in their survey of 20 Master Trusts that two schemes did not offer partial withdrawals from the
age of 55, three schemes did not allow flexi-access drawdown and three did not offer partial
uncrystallised funds pension lump sum (UFPLS) withdrawals. A substantial group of schemes did not
offer drip-feed drawdown27
.
20. Around two-in-five schemes (42%) reported offering a different set of decumulation options
depending on pot size, with £10,000 being the most common threshold for allowing drawdown28
. If a
member has several pots each below the value of £10,000, this may result in them cashing their pots
out and not optimising their pension savings.
21. Due to lack of availability, there is a risk members may either transfer their pension pot to another
scheme or fully withdraw their pot as cash. Data from TPR (see Figure 2) shows a growing number
of scheme leavers (members who exit from the scheme they have accumulated in) who are retiring
and are taking full cash withdrawals. The number of retired scheme leavers has increased on
average by 24% each year from 95,000 in 2019 to 222,000 in 2023, albeit there was a slight
reduction between 2023 and 2024 to 219,000. In 2024, DC pots withdrawn at retirement had an
average value of £5,50029
; this is expected to grow over time.
22. Although the average value per pot is low, it is likely many members could see better returns on the
value of their pension by remaining invested. In addition, greater numbers are also transferring out of
the DC trust-based market – likely due to a combination of reasons, including consolidating multiple
pots into one scheme (partly influenced by flagship marketing from certain schemes on the ease of
transfers) or perhaps in anticipation of retirement and the decumulation offer available.
23. This trend is supported by ONS data which shows a growing number of members who are unable to
access drawdown (or similar, UFPLS) products in the trust-market. This is currently around 3m
memberships, and growing30
, highlighting the large numbers currently at risk of poorer outcomes and
increased charges in the market.
Figure 2: Membership count of full cash withdrawals and transfers out of trust-based schemes per
calendar year
25
https://www.plsa.co.uk/Policy-and-Research/Document-library/DC-Decumulation-Call-for-Evidence
26
https://corporate-adviser.com/16pc-difference-between-post-retirement-master-trust-performance-ca-retirement-report/
27
That is, the ability to withdraw tax-free cash and taxable income in ratios other than 25-75.
28
https://assets.publishing.service.gov.uk/media/6571d64f049516000f49be2f/govt-response-helping-savers-understand-their-pension-
options.pdf
29
https://www.thepensionsregulator.gov.uk/en/document-library/research-and-analysis/occupational-defined-contribution-landscape-
2024/occupational-defined-contribution-landscape-2024-annex
30
https://www.ons.gov.uk/economy/investmentspensionsandtrusts/datasets/fundedoccupationalpensionschemesintheuk
0
50,000
100,000
150,000
200,000
250,000
300,000
350,000
400,000
2014 2015 2016 2017 2018 2019 2020 2021 2022 2023 2024
Transfers Out
Full Cash Withdrawals
221.
221
Source: TPR Occupationaldefined contribution landscape in the UK 202431
24. In June 2022, the Department for Work and Pensions (DWP) launched a call for evidence, ‘Helping
savers understand their pension choices: supporting individuals at the point of access’, to gather
evidence regarding member communications, guidance and decumulation products for the trust-based
market. In July 2023, DWP published its response to the product and services element of the call for
evidence as well as a public consultation on a policy framework to support individuals on how they use
their pension savings in decumulation.
25. In DWP’s response, the decision was taken to align with the FCA’s Investment Pathways. However,
DWP signalled its intent, where appropriate, to go further in order to reflect the developments in the
pensions landscape since the FCA’s Investment Pathways were introduced in 2021 to facilitate a
smooth transition from accumulation to decumulation for all pension savers with an occupational
pension.
26. To achieve this, action is required to ensure DC trust-based schemes take on a level of responsibility
for the decision making on behalf of their members through acting as an informed customer on behalf
of the membership. The introduction of a requirement for schemes to offer guided retirement
products and services aims to address the problems outlined above. It will ensure savers are able to
access retirement products irrespective of the scheme they save in, reducing the cost to the member
(the trustee will act as an informed consumer and purchase solutions wholesale at the best price
from the market for members of the scheme) and the risks of sub-optimal decision-making.
27. The policy proposals also support the wider government agenda for greater investment by pension
funds. This will likely be achieved through a greater proportion of assets remaining invested in return-
seeking assets for longer, which should benefit members through investment growth and may help
increase available investments for the UK. The policy should lead to a reduction in lifestyling, that is,
where their funds are invested in less riskier assets that tend to have lower but stable returns (in
anticipation of members withdrawing their funds).
28. To address the issues identified, the Pension Schemes Bill will place duties on DC Occupational
Pension Schemes to provide each member of their scheme support at the point of decumulation.
These duties would require DC occupational pension schemes to:
• Develop and provide a default solution or solutions based on the options available through
pension freedoms and member aspirations for how to use their assets in later life. The solution
can either be delivered in-house or through an arrangement to transfer the member to a scheme
providing an appropriate default solution.
• Pay due regard to the make-up of the membership and their needs when developing suitable
communications and information strategies and partnership arrangements for their members,
including those entering the default.
Rationale and evidence to justify the level of analysis used in the IA (proportionality
approach)
29. The Department has used a wide-range of sources and evidence to build a strong evidence-base to
identify the problem and impacts of the solutions. This has included:
▪ Consultations and Call for Evidence responses to hear from the pension industry, interested
parties and representatives, and consumer bodies (around 100 responses were received in both).
▪ Number of roundtables with industry bodies to help develop the proposals and identify further
challenges to maximise the understanding of the impacts.
31
https://www.thepensionsregulator.gov.uk/en/document-library/research-and-analysis/occupational-defined-contribution-landscape-2024
222.
222
▪ Direct discussionswith pension schemes to test Impact Assessment assumptions and
costings and a scheme data gather to estimate potential costs (with 12 large schemes
responding), with results tested back with schemes to sense check results.
▪ Lessons from FCA’s Investment Pathways which provides the foundation for DWP’s changes
along with the FCA’s cost-benefit analysis.
▪ Analysing a number of key data sources from TPR and FCA, alongside DWP’s quantitative
surveys (such as Preparing and Planning for Later Life) and qualitative surveys (such as Low
Earners and Pensions)32
.
▪ Corporate Adviser’s Annual Retirement Report, a key industry source, which provides a
comprehensive overview of the retirement market offering.
▪ Maximising use of HMRC’s RTI data to understand trends and patterns of people accessing
their pension pot for the first time.
30. Recognising the scale of the potential impacts, the Department has also invested in gathering greater
insights and data for the medium-term and to support Secondary Legislation. For example, a second
wave of PPLL undertaken in 2024, and due to be published later in 2025, will enhance our evidence
on peoples’ understanding of and preferences for a default retirement solution. Early findings are
presented in this IA. In addition, DWP and TPR have been collaborating to improve DC scheme
returns provided to the regulator to understand members in retirement and the schemes’ current
offering.
31. It is recognised at Primary Legislation stage that policy details are still to be fully developed and
worked through. Consequently, the Department will further engage with industry ahead of secondary
legislation stage, to enhance the understanding on costs and benefits of the proposals and develop
the evidence and impacts.
Description of options considered
Policy Option 0: Do nothing
32. This is the status quo, where the government leaves the provision of pension products and service at
retirement to the market without intervention. Although the market is adapting and schemes may be
creating decumulation offers for their members, this is inconsistent across the market and risks putting
millions of pension savers at a disadvantage in accessing decumulation products, resulting in
inequalities in member outcomes. In addition, it would continue to present disparities between the FCA-
related part of the market (DC Contract, where Investment Pathways exists) and the DWP/TPR-related
part of the market (DC Trust, where no decumulation requirements are in place).
33. It is possible all master trusts (which cover over 90% of trust-based savers) will eventually offer a wide-
range of decumulation products, and that several smaller schemes who do not offer products in-house
will either transfer their members in order for them to access guided retirement solutions or consolidate
with the Master Trusts that do. However, without a clear legislative framework in place, market failure
and poor outcomes for members is likely to remain. Without legislation, a default solution is highly
unlikely to materialise.
34. As a result, members may need to continue transferring out of trust-based schemes to other trust-
based schemes or the contact-based market to access decumulation products. This risks individuals
withdrawing their pension pot in full. This may have significant costs, such as tax implications, lower
investment returns, and money being exhausted quicker. In addition, it still leaves individuals having
to make complex financial decisions for decades during retirement, increasing the risk of sub-optimal
decisions.
Option 1: Non-regulatory option
32
https://www.gov.uk/government/publications/planning-and-preparing-for-later-life; https://www.gov.uk/government/publications/low-earners-
and-workplace-pension-saving-a-qualitative-study;
https://webarchive.nationalarchives.gov.uk/ukgwa/20240605050724/https:/www.thepensionsregulator.gov.uk/en/document-library/research-and-
analysis/occupational-defined-contribution-landscape-2023/occupational-defined-contribution-landscape-2023-annex ;
https://www.fca.org.uk/data/retirement-income-market-data-2023-24
223.
223
35. An alternativeoption, without legislation, might be to put guidance in place that recommends
schemes offer a decumulation service, or promote industry charters encouraging pension schemes
to develop decumulation services. This would be non-mandatory and would rely on all trust-based
pension scheme schemes committing to deliver those services.
36. However, many trust-based schemes (particularly smaller single-employer trusts) are less likely to
offer decumulation services as they have historically not done this, and this is unlikely to change
without legislation. A key finding from responses received to the July 2023 Consultation was that not
all trust-based pension schemes are prepared, or able, to provide decumulation services to their
members. Not placing in legislation would also risk decumulation support and coverage being
inconsistent across trust-based schemes, placing individuals at risk. Responses indicated that
without legislation, industry compliance to voluntary measures would be limited, with many trust-
based pension schemes continuing to focus on the accumulation phase (as reflected in their own
rules). This would still leave many pension members in a position similar to the ‘do nothing’ option.
Option 2: Legislation (preferred option)
37. The preferred way forward is legislation, building on stakeholder feedback to ensure fairness across
the pensions landscape. Legislation will provide each member of a trust-based occupational pension
scheme with a minimum expectation that their scheme will provide them a default solution at the
point of decumulation. Primary legislation is necessary to achieve this for all members saving into a
trust-based DC occupational pension.
38. These duties would require DC occupational pension schemes to:
• Develop a default solution or solutions, which provide a later-life income based on the
general profile of their members. The member will be placed into this solution if they do not
opt-out.
• Pay due regard to the make-up of the membership and their needs when developing and
implementing appropriate communication strategies.
• Pay due regard to longevity protection when developing the default solution(s).
39. This is the only way identified to help resolve the market failure, ensure consistency across the market,
and help members achieve greater outcomes. This is the preferred option.
Policy objective
40. The overarching policy objective is to support and protect member retirement outcomes for all savers
in the trust-based market. This is through ensuring and establishing a broad duty on trustees of all
schemes in the market to provide a default guided retirement solution for their members. This should
lead to no member having to make decumulation decisions, unless they want to and exercise their
choices.
41. However, there is a recognition of the diverse nature of the trust-based market, and as such, DWP
are not proposing a prescriptive decumulation default solution for all schemes to follow. Instead,
schemes should adapt their solution or solutions based on their understanding of their membership.
42. Members of an occupational pension scheme will have access to a suitable guided retirement
solution for their retirement which would include later life income, based on the goals of the majority,
all while retaining the freedom to use their pension pot as they wish (as part of the Pensions
Freedom Act).
43. Figure 3 outlines the member journey and potential pathways at retirement.
224.
224
Figure 3: Memberguided retirement journey and potential pathways outlined
Key: Pink boxes represent changes to the member journey under the proposed legislation
Summary and preferred option with description of implementation plan
44. The preferred option will be enacted with primary legislation with a further consultation at the secondary
legislation stage. Therefore, the policy details will continue to be finalised and the Impact Assessment
presents the best possible estimates at this point in time.
45. The intention is to place a duty on trustees to provide decumulation solutions for their members through
a default. A default option is where the pension scheme places a member into a solution that they have
determined meets the aspirations of the majority of the membership, following engagement with their
members. Members placed into the default option will be able to opt-out, should they wish, and be able
to access other products and services available under pension freedoms if they wish to.
46. As part of these duties, trustees will need to offer these services in-house, either through provision of
the solution directly or by ‘buying-in’ solution(s) on behalf of the members or have an arrangement in
place where the member is transferred to a scheme where an appropriate default is in place.
47. DWP are content if the range of services are wrapped up within one overall package; for example, in
their ‘DC Decumulation: Evolving the Pension Freedoms – Final Recommendations’ report33
, Pensions
and Lifetime Savings Association (PLSA) suggest that products and services should provide:
• Access to cash and/or flexibility,
• Sustainable income, and
• Secure income in later life.
48. As part of this framework approach described above, the policy requires schemes to develop the
products and services they offer to provide a later-life income and guide their members towards them.
While schemes may develop any decumulation product to provide an income for their members, it is
likely that a blended solution, including an element of drawdown, followed by a level of guarantee, will
be the most common product developed, because it provides an element of flexible income, which is
reversible unlike an annuity (members can decide to switch to another product at a later stage).
33
https://www.plsa.co.uk/Portals/0/Documents/Policy-Documents/2020/DC-Decumulation-Final-Recommendations-Oct-2020.pdf
In retirement
Defined Contribution Occupational Pension Journey
Member receives
information on day 1 of
their pension journey
explaining the income
solution/s they will be
placed into at the point
the trustees decide the
default would apply.
Frequent communications
will continue throughout
the member’s working life
– details be developed
Life Events
affecting
contribution
decisions –
throughout
contribution
journey
Member’s decision
Can select from:
Range of products
offered by scheme
in-house or from
partner
Or
Can self-select
alternative solution
offered by another
provider and transfer
funds to that
provider
?
5 years before
NMPA (currently
55 rising to 57 in
2027) receive
wake-up pack
providing more
detailed
information on in-
house and open
market options
Member continues with
selected in-house or
partner retirement option.
Funds remain invested.
Trustees’ fiduciary duty
continues
Member
contacts
scheme to
discuss
access to
pension
fund
Member
offered
Pension
Wise appt.
Member
Communication
throughout
pension journey
includes Annual
Benefit
Statement
If no active
decision by
member placed
into the default
pension solution
at the point
determined by the
trustees – can
opt-out dependent
on scheme rules
Member
Communication
throughout
pension journey
If no active decision
received member
continues in default offer.
Funds remain invested.
Trustees’ fiduciary duty
continues.
225.
225
Therefore, this impactassessment assumes schemes will develop and primarily offer drawdown to
their members post-legislation. However, this is an assumption for the purposes of the IA and not a
government recommendation. It will be for schemes and Trustees to decide on the most appropriate
default(s) to offer to their membership.
49. The decumulation policies are designed to shift the industry’s focus towards providing members with
a pension, including solutions for later-life income. If schemes do not have the scale or expertise to
provide decumulation solutions that meet the member needs, then they should consider transferring
members into a partner scheme that can where this is in members’ best interests.
50. DWP acknowledge there is a challenge for trustees in having a clear sight of cohort or individual
aspirations. However, DWP wants user insight and user-centric design to be much more at the
forefront of all trustees thinking. The intention is to rely on the trustee’s fiduciary duty to act in the
members’ best interests when developing the suite of products and services. However, DWP will
keep this under review and may introduce further requirements. With these considerations in
mind, DWP will at the earliest opportunity place duties on all trustees of occupational pension
schemes to offer a range of different decumulation products and services to members at the point of
access.
51. DWP will also work closely with the Regulator (TPR) to ensure compliance and act appropriately if
schemes are not meeting the new requirements. The delivery timetable around the decumulation
legislation is yet to be finalised but considering the other Bill measures announced and the potential
chronology of introducing these legislations, it is estimated that schemes will begin to ensure
compliance around 2027. However, given the uncertainty and that this is subject to change, the ten-
year appraisal period of analysis for the costs and benefits begins in 2028 in the impact assessment,
with costs being accrued from the onset. Benefits, meanwhile, begin to accrue in 2030 once the new
decumulation products and default retirement solutions are up and running and once the first cohort
of members are able to enter into them.
Monetised and non-monetised costs and benefits of each option (including
administrative burden)
Summary of costs and benefits
52. The proposed legislation aims to cover all non-micro schemes (those with 12 or more members) in the
trust-based market. There are currently 1,080 non-micro schemes. Although it is expected the market
will continue to consolidate over time (see section on consolidation below), the costs and benefits are
still expected to be large given the scale of the change being offered. The equivalent annual net cost
to businesses (EANDCB) is outlined in Table 1, while the overall costs and benefits (for both members
and schemes) considered are outlined in Table 2 below:
Table 1: Summary of EANDCB
Discounted direct costs and benefits to businesses over ten-year appraisal period (2028-2037)
Direct Impact Overview Cost / Benefit
(discounted, 2024 prices)
Direct Costs to business
One-off costs Familiarisation, Partnering, Training, In-house
decumulation development
£56.3m
Ongoing costs In-house decumulation development, Reviewing
transfer arrangements with schemes for
decumulation
£314.0m
Direct Benefits to business
Benefits to Pension
Schemes
Charges from reduced full-cash withdrawals £250.4m
226.
226
Benefits to Pension
Schemes
Chargesfrom members entering default asset
allocation prior to retirement
£11.2m
EANDCB £12.6m
Table 2: Summary Table
Discounted costs and benefits over ten-year appraisal period (2028-2037)
Impact Overview Cost/Benefit
(2024 prices)
Costs to business
One-off costs Familiarisation, Partnering, Training, In-house
decumulation development
£56.3m
Ongoing costs In-house decumulation development, Reviewing
transfer arrangements with schemes for
decumulation
£314.0m
Costs to members Not expected to be passed on given the
competitive DC workplace market.
-
Benefits to business
Benefits to Pension
Schemes
Charges from reduced full-cash withdrawals £250.4m
Benefits to Pension
Schemes
Charges from members entering default asset
allocation prior to retirement
£11.2m
Benefits to savers
Benefits to Savers –
investment returns
Investment returns from reduced full-cash
withdrawals
£371.0m
Benefits to Savers –
reduced transfers
Savings in transfer costs £8.2m
Benefits to Savers –
investment returns
Greater investment returns pre-access by
staying in higher-returning assets
£1,279.2m
Costs to businesses – one-off and ongoing costs
53. As outlined above, the IA has used a number of key sources to estimate the costs of the legislation
on schemes, including direct surveys to schemes, working with industry bodies, and working with the
regulator to address key data gaps. Where information has been harder to identify, evidence has
been drawn from the FCA’s cost-benefit analysis on Investment Pathways as a proxy for the guided
retirement legislation. Although the policies are not identical, there are many similarities, and the
policy intention is the same (to enhance member retirement outcomes). This therefore acts as a
reasonable estimation of industry costs for this IA.
54. Costs are then grossed up to the whole market based on the scheme size. This recognises costs may
differ depending on the size (measured by member size) given the economies of scale which could
arise. The proposed methodology ensures these different scheme structures are better reflected in the
estimates. Two important adjustments are made to the costs:
a. Consolidation - It is expected the DC market will continue to consolidate. As shown below, it
has been doing so at a consistent rate of 10% to 12% per year over the past decade and it can
be reasonably expected this will continue. Using the trend from the past few years, it is
estimated the DC market could have under 350 schemes by the end of the 10-year appraisal
period (2037). It is acknowledged this measure and other Pension Schemes Bill measures
(particularly the Value for Money framework) may speed up or interact with further
consolidation. At this point, the interactions across the measures cannot be known and is highly
227.
227
dependent on pensionscheme behaviour, timings of implementation, and final policy details (at
secondary legislation) are still needed. Therefore, at this point, no estimate is made of the
interactions within each individual IA or on the additional consolidation rates these
decumulation measures may cause. This is covered within the overarching summary IA for the
Bill.
b. Optimism Bias in line with Green Book standards has been applied; this is estimated at around
25% (and is consistent with other impact assessments for the Pension Scheme Bill). Optimism
bias is applied to costs where there is little or no scheme input, and it reflects the uncertainty
on the final policy details and the potential underestimating of some costs. As for costs which
rely heavily on scheme input, this is not adjusted for optimism bias as it is assumed schemes
may have a natural tendency to overstate their potential costs from the proposed legislation to
highlight the high costs of change involved.
Figure 4: Consolidation of schemes in the DC trust market at the current rate34
Source: Trends in the Defined Contribution trust-based pensions market, DWP35
One-off costs
Familiarisation costs
55. Familiarisation costs refer to the expenses incurred by businesses to understand and comply with the
new regulations. The estimate of familiarisation costs for the proposed legislation covers the time and
cost for staff of schemes to familiarise themselves with the new guided retirement legislation,
including reading the legislation and undertaking a gap analysis (to recognise what is required to
comply with the legislation).
56. The assumptions for costs are taken from the FCA’s cost-benefit analysis on Investment Pathways
with some adaptions to the trust-based market36
. This was based on a survey of around 70 pension
34
DWP analysis of TPR data. More details available in: https://www.gov.uk/government/publications/trends-in-the-defined-contribution-trust-
based-pensions-market/trends-in-the-defined-contribution-trust-based-pensions-market
35
https://www.gov.uk/government/publications/trends-in-the-defined-contribution-trust-based-pensions-market/trends-in-the-defined-
contribution-trust-based-pensions-market
36
https://www.fca.org.uk/publication/consultation/cp19-05.pdf
0
500
1,000
1,500
2,000
2,500
3,000
3,500
4,000
2012 2015 2018 2021 2024 2027 2030 2033 2036
Forecast
228.
228
schemes and supplementedwith the FCA’s wider evidence base on costs of compliance, therefore
giving confidence in the estimates and wide-spread market coverage. This estimated:
• The policy documentation to be 40 pages which would take around 2 hours to read. Given
similarities in the proposals, it is assumed the proposed guided retirement legislation is similar
in length.
• Based on TPR input, the average number of trustees at schemes is assumed to be around 3
and the average hourly wage of trustees, using ONS ASHE data, to be around £36.51.
• This is scaled up across the whole market (1,080 schemes) to get a total familiarisation cost
of around £296,000, after the 25% optimism bias is applied. This is a direct cost to pension
schemes, as all schemes will need to immediately familiarise themselves with the policy
details to understand what actions are required to comply with the legislation.
In-house decumulation product development costs and partnering
57. All schemes under the proposal will either need to offer a decumulation solution in-house (including
buying-in solutions through a partnership arrangement) or organise an arrangement where they can
transfer their members to a scheme which provides an appropriate default solution(s). TPR analysis
from a selected 580 schemes shows around 160 single-employer trusts (30% of sample) currently
offer a decumulation service37
, while around 30 Master Trusts offer a decumulation service. This
leaves hundreds of schemes who would be required to develop a decumulation offer or develop an
arrangement with another scheme. Based on industry engagement, it is assumed:
▪ Only Master Trusts will develop an in-house decumulation product (where they are not
currently doing so)
▪ All single-employer trusts will look to establish an arrangement to transfer their
members to another scheme.
58. Discussions with industry highlighted the costs and risks of setting up an in-house service were likely
to be disproportionate for non-Master Trusts given their size and scope. The greater level of assets
Master Trusts hold offers economies of scale in producing in-house default solutions and greater
ability to spread risk and offer longevity pooling. Therefore, it is assumed these schemes will opt for
this route in order to capitalise on increased charges from their members who will enter drawdown.
59. For Master Trusts developing a decumulation offer, the Corporate Advisor Retirement Report and
desk research was used to estimate that 5 to 10 Master Trusts will need to develop a decumulation
product38
. Based on the various engagement with industry, it is estimated the up-front cost of
developing a drawdown solution to be £1m (the Corporate Advisor report highlights the majority of
products not offered among Master Trusts is drawdown). Since most schemes currently offer UFPLS
to their members, it is estimated the upfront cost per Master Trust will in fact be half this cost at
£500,000. This is because UPFLS is not too dissimilar a product from drawdown, and thus, schemes
will not have to engage in as much product development to now offer drawdown to their members as
opposed to developing the product from scratch. The total up-front costs of product development are
estimated to be £3.5m. This is a direct cost to pension schemes who currently do not offer
decumulation products and decide to develop an offering in-house, as this will be a necessary cost to
comply with the legislation.
60. For non-Master Trusts, it is assumed those not currently offering a decumulation product will partner
with another scheme. This is due to the large differential between the cost of developing an in-house
decumulation product versus partnering with a scheme offering decumulation products to transfer
members to access these products; single-employer trusts tend to be significantly smaller in size
than Master Trusts and thus would likely lack the economies of scale necessary to develop in-house
products profitably. Using TPR scheme returns and coverage of decumulation estimates, this puts
around 620 schemes in scope.
o 510 small schemes [12 to 999 members]
37
https://www.thepensionsregulator.gov.uk/en/document-library/research-and-analysis/use-of-decumulation-products-within-occupational-dc-
schemes
38
For the purposes of the analysis, a midpoint of 7 Master Trusts as a midpoint which also reflects the best available information whilst
recognising commercial sensitivity.
229.
229
o 80 mediumschemes [1,000 to 4,999 members]
o 30 large schemes [5,000+ members]
61. Based on industry engagement, larger schemes will be able to conduct a wider and more complex
market search to find the most suitable partnerships and will be able to secure the services of
employer benefit consultants (EBCs) to support this. Whereas it may be expected for smaller
schemes to reach out to those with high brand recognition rather than conducting significant
searches. Partnership costs may comprise of the potential use of innovation firms, such as fin-techs,
to develop interfaces and solutions to share data across schemes, legal fees in producing
partnership contracts, and the use of EBCs to search the market. Industry engagement and
discussions estimated the cost of partnering for small schemes will be around £50,000, for medium
schemes £150,000, and £250,000 for large schemes. In total, the industry-wide up-front cost of
partnering is expected to be £45m. This is a direct cost to pension schemes who currently do not
offer decumulation products and decide to secure transfer arrangements for their members at
decumulation, as this will be a necessary cost to comply with the legislation.
Table 3: Estimated schemes in scope of partnering and costs to partner
Scheme Size Number of schemes to
partner
Cost per scheme to partner Total Costs
Small 510 £50,000 £25.6m
Medium 80 £150,000 £12.0m
Large 30 £250,000 £7.9m
Total 620 £45.5m
Source: DWP roundtables and one-to-one meetings with pension schemes. Schemes rounded to the
nearest 10
Training
62. Training costs are incurred as schemes will need to train their employees on the new legislation,
including its implications and the necessary adjustments required to take members through their
guided retirement journey. The estimated training cost is derived from assumptions gathered through
consultations with industry experts on their implementation plans and the FCA’s cost-benefit analysis
for Investment Pathways (which drew on survey responses from pension schemes). Key
assumptions include:
• Large schemes (including Master Trusts) will need to train 75 staff. This has been pro-rata
adjusted for medium schemes (17 staff) and small schemes (3 staff, where the number is
assumed to be the same as that of trustees).
• All large schemes (including Master Trusts) will train their staff internally, 50% of medium
schemes will provide internal training, while 25% of small schemes will do so.
• The cost of external training is assumed to be £910 per person39
, while for internal training,
the hourly wage for a trainer and trainee is assumed to be £27.42 and £21.81 respectively40
.
• Staff at Master Trusts will require bespoke training. This is estimated at around 6 hours of
classroom training and 40 hours preparation.
• All non-Master Trusts are expected to do basic training (as they are expected to partner with
a MT). This is estimated at around 6 hours of classroom training and 8 hours preparation.
63. Overall, total industry-wide training costs are estimated to be £7m. This is a direct, unavoidable cost
to pension schemes, as it will be necessary to ensure staff are aware of the legislation and what it
39
This is based on the FCA’s assumptions on the cost of external training in their cost-benefit analysis and uprated by CPI since their
publication. https://www.fca.org.uk/publication/consultation/cp19-05.pdf
40
Wage data is sourced by ONS Annual Survey of Hours and Earnings 2022 data
(https://www.ons.gov.uk/employmentandlabourmarket/peopleinwork/earningsandworkinghours/datasets/occupation2digitsocashetable2) and
uplifted by 27% as per the archived Green Book guidance.
230.
230
entails with regardsto member correspondence and taking members through their retirement options
and journeys.
Ongoing costs
In-house decumulation solution costs
64. While schemes may offer alternative default solutions (and are free to do so), it is assumed
drawdown will be the most likely option being offered as a default in-house solution. This is due to it
being the most popular income product (as seen in Figure 1) and because of the flexibility it offers –
members entering drawdown can change their mind and switch to a different retirement product
whereas this is not the case for, say, annuities. It is important to note this is just an assumption for
the IA and not a government recommendation. Trustees should decide which is the most appropriate
default solution(s) for their membership.
65. In DWP’s engagement with industry, it was highlighted by a number of schemes that developing
decumulation products in-house will result in running costs. Running costs for pension schemes can
be commercially sensitive, and therefore information can be challenging to obtain, and any disclosed
information needs to be handled sensitively. This impacts some of the estimates and assumptions
across the IA, especially for Master Trusts, where the number of schemes is relatively low and it is
important not to disclose commercial information in a competitive market.
66. Nevertheless, from discussions with schemes, it is understood an approximate running cost for a
drawdown product is around £50 per member per year. This seems a largely appropriate cost given
many drawdown products are not offered on pension pots below £10,000, which at an average
industry price of 0.5% of assets under management, would suggest at least a breakeven point of
around £50 per member.
67. Throughout this impact assessment, FCA Retirement Market Income data from the contract-based
market is utilised when TPR data for the trust-based market is not sufficient to draw an assumption.
Since Automatic Enrolment, the two markets have been converging over time and are becoming
more similar in nature (in relation to the duration members are saving for, their pension contributions
and thus pot sizes). While differences do still exist (where possible, this is accounted for and
adjusted), it is on balance a good proxy to use for modelling behavioural change.
68. The FCA’s Retirement Income data estimates 31% of savers access drawdown and TPR data
estimates 90% of the trust-based membership are based in Master Trusts. Using this information
together with TPR’s DC landscape data, it is estimated how many members across the assessment
period will enter drawdown within Master Trusts.
69. The ongoing costs of developing a drawdown solution for Master Trusts is estimated as follows:
• Growth rate: TPR’s DC landscape shows the growth in membership for age cohorts able to
access their pension (those aged 55+) has been, on average, 8% per annum over the past
few years. This growth is applied across the ten-year assessment period41
.
• Master Trust coverage: Of these members able to access their pension, around 90% are
pots with Master Trusts.
• Drawdown take-up: The FCA’s Retirement Income data estimates 31% of savers access
drawdown; this is used to derive an estimate for new entrants into drawdown within Master
Trusts each year.42
• New drawdown savers: Based on membership data, the 5-10 Masters Trusts assumed to
develop an in-house drawdown are estimated to account for around 60% of total membership
across all Master Trusts.
41
Although the NMPA rises to 57 in 2028; there are some protections in place which means not all members may be impacted and, as the
growth rate is uncertain, it is assumed to still be appropriate for the purposes of this IA.
42
https://www.fca.org.uk/data/retirement-income-market-data-2023-24
231.
231
70. From thecost perspective, the above indicates the assumed counterfactual trend in the absence of
the legislation:
• Decumulation coverage: In the counterfactual, it is assumed that the Master Trusts currently
offering decumulation solutions continue to do so, while the 5-10 Master Trusts that currently
don’t offer decumulation solutions do not develop an offering in the future. Automatic
Enrolment was launched in 2012, which has given schemes desiring to offer their members
decumulation products ample time to do so.
• Drawdown take-up: The FCA’s Retirement Income Market data estimates that 31% of
savers currently access drawdown in the contract-based market. This is assumed to be the
take-up rate of drawdown in the trust-based market once the legislation is introduced and is
assumed to remain constant throughout the appraisal period.
• Growth rate: TPR’s DC landscape shows the growth in membership for age cohorts able to
access their pension (those aged 55+) has been, on average, 8% per annum over the past
few years. This growth is applied across the ten-year assessment period43
.
71. Thus, the difference between the counterfactual and post-legislation is that the 5-10 Master Trusts
will now develop a decumulation offering to their members, including a default pathway. The costs of
in-house product development thus fall on these 5-10 Master Trusts.
Table 4: Estimated ongoing in-house decumulation solution costs to schemes
Year
Projected new
entrants into
drawdown
(nearest 100)
Projected new entrants into
drawdown in Master Trusts
that require product
development
(nearest 100)
Cumulative entrants
in drawdown at
Master Trusts which
develop products
(nearest 100)
Running costs for
these members (£50
per member per
annum)
(nearest £0.1m)
2029 163,300 96,100 343,30044
£17.2m
2030 176,500 103,800 447,100 £22.4m
2031 190,700 112,200 559,300 £28.0m
2032 206,100 121,300 680,700 £34.0m
2033 222,800 131,100 811,800 £40.6m
2034 240,800 141,700 953,500 £47.7m
2035 260,200 153,100 1,106,600 £55.3m
2036 281,300 165,500 1,272,100 £63.6m
2037 304,000 178,900 1,451,000 £72.6m
Source: TPR DC landscape, FCA Retirement income market data, industry engagement
Notes: In calculating the ongoing costs, the cumulative entrants into drawdown in Master Trusts that develop
drawdown due to the legislation is calculated. For example, in 2033, there are 131,100 new drawdown entrants into
these Master Trusts alongside the 680,700 from previous years (2029-2032), bringing the total number of
43
Although the NMPA rises to 57 in 2028; there are some protections in place which means not all members may be impacted and, as the
growth rate is uncertain, it is assumed to still be appropriate for the purposes of this IA.
44
This consists of 247,200 entrants into drawdown at these Master Trusts prior to 2029, and 96,100 entrants in 2029. This is because it is
estimated that Master Trusts required to develop decumulation products may begin to do so in 2025 in anticipation of the legislation, such that
by the start of 2029, there are around 247,200 entrants into drawdown at Master Trusts which develop produ cts.
232.
232
drawdown members inthese schemes to be 811,800. The running costs of drawdown is £50 per member per year,
bringing the ongoing costs in 2033 to be £40.6m (811,800 multiplied by £50). It is estimated Master Trusts required
to develop decumulation products begin to do so in 2025 in anticipation of the legislation, such that by the start
of 2029, there are around 247,200 entrants into drawdown at Master Trusts which have developed new products.
This is an assumption. However, it may mean some running costs occur in advance of the implementation date;
this is attempted to be accounted for in Table 4.
72. Accounting for the cumulative increase in pensioner membership in these schemes and the £50
annual per member costs to schemes to administer the pension pot, it is estimated to cost around
£17m in ongoing costs in 2029, steadily rising to £73m in 2037. This is a direct cost to pension
schemes who currently do not offer decumulation products and decide to develop an offering in-
house, as this will be a necessary cost to comply with the legislation. It is important to note, schemes
would only provide this service where it is beneficial to do so (otherwise they could partner to arrange
the transfer of membership at a much lower cost). Therefore (as discussed in benefits section), the
benefit of offering drawdown via greater charges should offset the costs of running the service.
Reviewing partnerships
73. Scheme feedback (within the consultation responses and in industry discussions) was that transfer
arrangements would likely be reviewed at regular intervals. This would allow schemes seeking these
types of arrangements to hold Master Trusts (or other third-party partners) accountable in terms of
performance (such as investment returns) and ensuring trustees’ fiduciary duty to continue to act in
the members’ best interests. Consequently, it is assumed partnerships will be reviewed every three
years. The period of review will give schemes an opportunity to conduct a market search to ensure
they are getting the best partnership deal; however, this is an assumption and not a requirement.
Based on scheme feedback, it is estimated for the cost of such a review to be £5,000 for small
schemes, £15,000 for medium schemes, and £25,000 for large schemes. After accounting for
consolidation in the DC trust-based market, this will result in ongoing costs of £2.0m, £1.4m and
£1.0m respectively on three separate occasions across the assessment period. This is a direct cost
to pension schemes who currently do not offer decumulation products and decide to secure transfer
arrangements for their members at decumulation, as this will be a necessary cost to comply with the
legislation.
Cost to The Pensions Regulator
74. Any related costs to the regulator from the developing, implementing, and undertaking ongoing
regulatory activity under the VFM framework would be drawn from TPR’s existing budget. Further
detail will be provided once the compliance regime and policy position has been finalised.
Table 5: Estimated itemised ongoing costs to schemes over the appraisal period (£m)
2028 2029 2030 2031 2032 2033 2034 2035 2036 2037
In-house decumulation solution 0 17.2 22.4 28.0 34.0 40.6 47.7 55.3 63.6 72.6
Reviewing partnerships 0 0 0 2.0 0 0 1.4 0 0 1.0
Total ongoing costs 0 17.2 22.4 30.0 34.0 40.6 49.1 55.3 63.6 73.6
75. Accounting for both one-off and ongoing costs, as well as the consolidation rate estimated above (see
figure 4), the average cost per scheme across the appraisal period is estimated to be £130,000. Some
schemes, such as Master Trusts in need of developing decumulation products, are likely to accrue
higher costs than this, while many smaller schemes will accrue costs lower than this, either due to
comparatively lower transfer arrangement costs, or even because they may consolidate as costs
become disproportionate to their scheme.
233.
233
Non-monetised costs:
76. Thereis significant uncertainty around the behavioural responses that may be observed from the
policy, and how schemes may develop their defaults. In addition, data is not always readily available
or easy to measure. As a result, there are a wider range of costs that could arise from the legislation
but are hard to monetise at this point in time. These include:
▪ Reduced innovation: although the suite of decumulation products is broad and the
legislation is designed to promote innovation by not being prescriptive on the type of default
to implement, it is possible schemes decide to focus on complying with duties rather than
creating new and more innovative solutions. This may be particularly the case given risks of
introducing a default option members may not like or understand. Costs of introducing may
also mean schemes invest less in innovation. However, it is not easy to know nor monetise
the impacts.
▪ Opportunity Cost: pension schemes may be required to reallocate some of their resource
into developing these products which comes at an opportunity cost of focusing on other
initiatives. Segments of the market is already adapting and recognising the need for
decumulation products, the opportunity cost may be low but is an important consideration.
▪ Designing and reviewing the default: schemes will have the flexibility to develop a default
solution according to the general profile of their members. As member demographic changes,
as well as further developments and evolution in decumulation products, schemes may need
to update their default solution, which may come at an additional cost. However, schemes are
only likely to enhance their offering if this is a net business benefit.
Non-monetised costs to savers:
77. The main costs are estimated to be placed on the pension schemes. However, there are 2
implications (non-monetised) for the saver:
▪ Schemes’ costs passed on: there is a possibility schemes may pass the costs of complying
with the legislation onto their members through higher fees and charges. Costs have the
potential to be particularly large for some schemes that engage in product development, and
it is reasonable to assume they may attempt to recoup some of this through higher charges.
At the same time, competition in the trust-based market is high, there is a strong focus on
costs, and there has been a noticeable fall in charges over time (now less than 0.5%). Given
the fall in costs, the continued competition, and that there is a charge cap in place (set at
0.75% of the pension pot), it is expected schemes will not pass on costs to members in order
to retain market share.
▪ Loss of welfare: people draw utility from accessing a lump sum in their pension, with nearly
everyone (92%) who had taken a lump sum since 2015 saying they were happy with this
decision, including 66% who were very satisfied45
. Evidence also found a wide range of uses
for lump sums being withdrawn. For example, the most common use, mentioned for 43% of
pensions, was for people to save or invest the cash, while it is relatively common for people to
use the cash lump sum to cover living costs (38% of pensions) and pay off debts (31%)46
.
However, the PPLL survey also shows how a significant proportion of individuals plan to take
some of their pension as an income; 39% planned to take an annuity while 37% planned to
take purchase an income drawdown47
. The proposals do not stop people accessing a lump
sum and individuals can still continue to access their pension in full. Nevertheless, it may
encourage individuals to keep their pension invested and not withdraw this to spend on a
large expense, which they may have otherwise found to be welfare-enhancing. The potential
welfare gains, or losses, from the proposals are not monetised but it is recognised there may
be implications.
45
https://www.gov.uk/government/publications/planning-and-preparing-for-later-life/planning-and-preparing-for-later-life
46
https://www.gov.uk/government/publications/planning-and-preparing-for-later-life/planning-and-preparing-for-later-life
47
https://www.gov.uk/government/publications/planning-and-preparing-for-later-life/planning-and-preparing-for-later-life
234.
234
Benefits
78. There aresignificant benefits some schemes and members will gain from the proposals, particularly
through increased investment returns and supporting individuals in making complex financial
decisions.
Benefits to Members
79. Many schemes in the trust-based market are currently accumulation-only (possibly due to scheme
rules)48
and do not offer decumulation services. As a result, members may be obliged to fully
withdraw or transfer their pension at retirement. This risks two key costs:
a) Members losing out on investment returns by having their savings in cash or spending the
money when it otherwise could be invested in a pension, resulting in investment returns and
being within a tax-free wrapper. Investment returns may also offset any tax implications on
pension withdrawals, which would not be the case if the member withdraws
b) Members facing higher fees or transfer costs by having to transfer their pension to another
pension scheme as a result of not being able to access appropriate products within their own
scheme.
The legislation should help reduce both of those impacts, compared to the counterfactual, generating
significant benefits to members over time.
Greater returns from reduced full-cash withdrawals
80. It may be in some members’ best interest to fully withdraw their pension into cash, and individuals
can continue to do so under the proposed legislation. However, this may not be appropriate for all as
pensions can offer greater investment returns compared to saving accounts and be a more tax-
efficient way of saving. Nevertheless, full cash withdrawals are the most common way of accessing a
pension pot – likely influenced by the fact that many pots are still small due to Automatic Enrolment
being a relatively recent introduction. In 2024, DC pots withdrawn in the trust-based market at
retirement had an average value of £5,500.49
This point is further supported by the FCA’s Retirement
Income Market Data, which found that 86% of accessed pension pots worth less than £10,000 are
taken as cash.50
81. Automatic Enrolment has shown the power of defaults and inertia, with opt-out rates being around 8-
10% and pension participation for those eligible being close to 9-in-10 workers. This is largely
consistent across all income and age groups. Evidence also shows individuals do not shop around
for pension products, and 38% of UK adults rated their knowledge of financial matters as low51
.
Therefore, it is reasonable to assume a default decumulation product is likely to shift behaviour for
many individuals. The early findings from the PPLL Wave 2 survey found that while around a third
(32%) of individuals below normal minimum pension age (55) wanted to decide for themselves on
how to access their pension, nearly half (43%) of respondents between age 40-75 said that they
wanted their pension scheme to provide the option of a default pathway.52
82. However, estimating behavioural change is incredibly challenging, especially as the default offer by
schemes may be different across—and within—schemes depending on their member demographics.
A number of highly uncertain assumptions have been applied based on the best available evidence.
These include:
▪ Drawdown – It is assumed most schemes will offer drawdown as a default product. This is
based on industry engagement and that drawdown offers the most flexibility to members (for
example, allowing members to access different levels while not being an irreversible decision,
unlike an annuity). However, the legislation allows schemes to design any appropriate default
48
That is, the rules of a pension scheme may have been established to consider the accumulation phase as pre-automatic enrolment, DC
pensions were then used to purchase an annuity.
49
https://www.thepensionsregulator.gov.uk/en/document-library/research-and-analysis/occupational-defined-contribution-landscape-
2024/occupational-defined-contribution-landscape-2024-annex
50
https://www.fca.org.uk/data/retirement-income-market-data-2023-24
51
https://www.fca.org.uk/publication/financial-lives/financial-lives-survey-2022-key-findings.pdf
52
Planning and Preparing for Later Life 2024, DWP, publication forthcoming’
235.
235
they consider bestfor their members; this assumption is just used for the purpose of the
impact assessment.
• No pots with a value of £10,000 or less are offered drawdown – Based on current
offerings in the market and industry engagement (via roundtables and consultations), an
approximate breakeven point for offering drawdown is a pot size of around £10,00053
. As a
result, all pots below this are unlikely to be offered drawdown to avoid industry facing losses
(though it is recognised there may be variance in the market regarding this). FCA retirement
market data illustrates that 90% of pots below £10,000 are withdrawn in full as cash, further
supporting this point. Therefore, only pots above £10,000 are estimated to be impacted.
Using trends of average pot size from TPR/FCA and pension engagement on potential
trends, it is expected the percentage of pots over £10,000 will grow by around 2-3ppts each
year reflecting contributions and investment returns which continue to be made (see table
below). In estimating the post-legislation full-cash withdrawals, it is adjusted year-on-year
from the counterfactual trend. Some pots over £10,000 will continue to be fully withdrawn as
the subsequent behavioural points capture. In other words, as per table 6, 60% of pots are
assumed to be below £10,000 in 2030 and thus are fully withdrawn, while in 2031, this is
adjusted down to 59%.
Table 6: Estimated proportion of pots above and below £10,000
Year Proportion of pots below £10,000 Proportion of pots above £10,000
2024 70% 30%
2025 69% 31%
2026 66% 34%
2027 65% 35%
2028 63% 37%
2029 62% 38%
2030 60% 40%
2031 59% 41%
2032 57% 43%
2033 56% 44%
2034 54% 46%
2035 53% 47%
2036 51% 49%
2037 49% 51%
Source: DWP estimates based on Helping savers understand their pension choices (2023), roundtables
and discussions with pension schemes
▪ Proportion receiving advice/guidance – A proportion (32%) of people receive financial
advice or guidance ahead of accessing a pension54
. Given this group have shown greater
levels of engagement and are receiving additional support/help, it is unlikely this group would
consequently take a different approach when accessing their pension. Therefore, it is
conservatively assumed only those not receiving advice/guidance may change their
behaviour around access. This is likely to be highly dependent on how strong the default is.
For example, if schemes put in place multiple steps and communication ahead of placing an
individual into a default, there may be greater numbers who choose an alternative approach.
Nevertheless, it seems reasonable to assume those individuals aware of their choices and
receiving support/help in making a decision are likely to continue making the same decision
going forward (especially the case for those with a financial adviser).
53
https://www.gov.uk/government/consultations/helping-savers-understand-their-pension-choices-supporting-individuals-at-the-point-of-
access/helping-savers-understand-their-pension-choices
54
https://www.fca.org.uk/data/retirement-income-market-data-2023-24
236.
236
▪ Behavioural assumptions– The FCA introduced Investment Pathways in 2019 and have
estimated that around 50% of people take-up the Investment Pathways approach when
accessing their pension. This is used to split behaviour into two groups for the IA:
▪ The 50% of individuals who don’t make an active decision are assumed to enter a
default solution. This is assumed to be drawdown.
▪ The 50% who take-up Investment Pathways is used as a proxy for those who will
engage in decision-making with their pension at decumulation. In order to determine
what individuals choose to do, the Pensions Policy Institute (PPI) report the following
decisions from engaging with Investment Pathways:
▪ Around one-third (34%) of individuals select to fully withdraw their pension
even after going through investment pathways,
▪ A small proportion of individuals (5%) opt for annuities55
,
▪ A quarter (25%) of individuals opt for drawdown,
▪ The rest (37%) of the individuals have no plans to access their pension.56
▪ From those who have no plans to access their pension, it is assumed two-thirds of
these individuals will opt for drawdown when they decide to access (while the
remaining third will fully withdraw their pension). While there is no available data
underpinning this assumption, it captures the likelihood of most of these members
remaining invested and being less inclined to fully withdraw their pension. It also
reflects that defaults can be strong. However, there is still likely to be a minority of
members who choose to withdraw in full, reflecting circumstances or they have other
pots which are larger.
83. As a result, it is assumed around three-quarters (77%) will change their behaviour as a result of the
default being available/offered. This comprises of the individuals who do not engage in with their
pension (50%) and around half of the individuals who do engage in active decision making (27% of
total). This assumption is made in order to not overestimate the benefit; some members who initially
do not have plans to touch their pension may decide to later fully withdraw their pension. This is a
highly uncertain assumption but is the best available estimate given the highly limited evidence
available on how individuals may respond, learning from similar initiatives.
84. Table 7 outlines this assumption in tabular form, and Figure 5 maps out this assumption together with
the other behavioural assumptions mentioned in this section.
Table 7: Estimated behavioural change from a default decumulation offering
Behavioural choice
Subset
behavioural
choice
Second
order
subset
behavioural
choice
Change
behaviour
Proportion of
total that change
behaviour
Enter default 50% Yes 50%
Don't enter default, of which 50% -
Fully withdraw pension 34% No
Purchase annuity 5% Yes 2.5%
Enter drawdown 25% Yes 12.5%
No plans to access pension, of which 37% -
Enter drawdown later 67% Yes 12%
Fully withdraw pension 33% No
Total 77%
As Table 7 outlines:
55
For sake of simplicity, it is assumed the same returns for the small proportion of individuals who select annuities as they would receive in
drawdown.
56
https://www.pensionspolicyinstitute.org.uk/media/xfybvxtq/20230926-the-dc-future-book-9-2023.pdf
237.
237
▪ 50% enterthe default
▪ From the remaining 50% that do not enter the default:
▪ 5% opt for annuities – that is, 2.5% of the total
▪ 25% opt for drawdown – that is, 12.5% of the total
▪ 37% have no plans to access, for which we estimate:
▪ 67% will enter drawdown – that is, 12% of the total
Therefore, in total, 77% of members are estimated to change their behaviour once there is a
default offering across the market.
▪ Average pot size in 202957
(£15,400) – This is derived from the FCA full cash withdrawals
data in 2023/24. The data shows average full cash withdrawals including all pot sizes in the
contract-based market to be £14,400 (Table 8, below), while TPR data shows it to be £5,600
in the trust-based market, which is 39% of the contract-based market value. Since only pots
above £10,000 are estimated to be impacted, the average full cash withdrawals over £10,000
from the FCA data (£32,400) is adjusted accordingly by 39% to reflect the trust-based market
(£12,600). This value is then uprated by average real investment returns (around 4%)58
until
when the legislation is expected to come into force and schemes are compliant (2029), which
gives an estimated average pot size of £15,400.
Table 8: Number of plans fully withdrawn at first time of access - by pot size (contract
market, 2023/24)59
Pot size Mid-
point
Number of
plans
(nearest 100)
Sum
(nearest £0.1
billion)
Less than £10,000 £5,000 309,000 £1.5bn
£10,000 - £29,000 £19,500 113,300 £2.2bn
£30,000 - £49,000 £39,500 27,700 £1.1bn
£50,000 - £99,000 £74,500 15,600 £1.2bn
£100,000 - £249,000 £174,500 3,500 £0.6bn
£250,000 and above £250,000 600 £0.1bn
Average full withdrawal pot size £14,400
Average full withdrawal over £10,000 pot size £32,400
Source: FCA Retirement income market data 2023/24
85. To estimate the projected number of full-cash withdrawals into the future, a number of trends are
considered and projected forward (which considers demographic shifts too, such as increasing
contributions to pension and growth in pot sizes):
▪ TPR data shows the number of people withdrawing their pension in the trust-based market
has been growing at around 22% year-on-year for three years prior to 2023, with around
222,000 accessing (retired) in 2023.
▪ FCA data on full cash withdrawals shows the equivalent year-on-year growth figure for the
past three years to 2023 is 6%.
57
Benefits are estimated to start accruing after 2029, once schemes are compliant with the legislation, and decumulation default solutions are
put in place.
58
The value of £12,600 (estimated average full cash withdrawal over £10,000 in 2023/24) is uprated by returns of 3.96% (see Table 11 below)
to reflect further pension contributions and investment returns.
59
https://www.fca.org.uk/data/retirement-income-market-data-2023-24
238.
238
▪ HMRC dataon people making their first pension cash withdrawal in 13 months60
shows that
over the past three years to March 2023 the year-on-year growth figure is 13%.
▪ TPR data also shows a growing number of savers aged 50+ (around 16% year-on-year since
2019), and who are therefore approaching the age at which they may access their pension.
▪ PPLL research found the average age of accessing a DC pension was around 60 years old.
▪ Scheme discussions on the projection of the volume of pension pots outlined decreasing
growth to a ‘steady state’ of 5% by the mid-2030s.
86. Using a combination of the various sources, a growth rate is applied (see table 9) which:
▪ Starts at 10%, which is the midpoint between the growth rate seen from the HMRC data
(13%) and the FCA data (6%).
▪ Slowly declines by around half a percentage point per year (0.5ppt) given the maturing of the
market (as shown from the FCA data which indicates a slowdown in the growth rate in the
contract-based market).
▪ Reaches a steady state of 5% growth in the mid-2030s reflecting scheme discussions and
projections.
This growth rate recognises growth in withdrawals in the trust-based market is unlikely to continue to
be as strong over time and that FCA and HMRC data also shows slower but still positive growth in
withdrawals in more recent years. The average growth across the period is estimated 7%, with the
distribution around this mean outlining the maturing of the trust-based market.
Table 9: Growth in counterfactual full-cash withdrawals
Year
Growth from
previous year
2024 10%
2025 10%
2026 9%
2027 8%
2028 8%
2029 7%
2030 7%
2031 6%
2032 6%
2033 6%
2034 5%
2035 5%
2036 5%
2037 5%
87. Table 10 shows the counterfactual versus post-legislation full-cash withdrawals, after adjusting to
include the behavioural assumptions discussed above:
▪ 30% of individuals receive advice or guidance before fully withdrawing and thus do not
change their behaviour; 70% of individuals who fully withdraw are in scope to change their
behaviour.
▪ From these 70% of individuals, 50% of individuals do not engage with any decision-
making and enter the default (and thus no longer fully withdraw).
▪ From the remaining 50% of individuals who engage with making a decumulation decision,
over half (54%) now remain invested with their scheme, while 46% from this group
continue to fully withdraw.
60
HMRC define first pension cash withdrawal as someone accessing a pension amount where there has not been a withdrawal in the last 13
months.
239.
239
Table 10: Estimatedcounterfactual and post change full cash withdrawals
Year Full Cash Withdrawals
(Counterfactual)
(nearest 100)
Full Cash Withdrawals
(post change)
(nearest 100)
Difference
(nearest 100)
2029 249,800 249,800 -
2030 267,300 185,100 82,200
2031 283,300 192,900 90,400
2032 300,300 201,000 99,300
2033 318,300 209,400 108,900
2034 334,300 216,000 118,200
2035 351,000 222,800 128,200
2036 368,500 229,700 138,900
2037 386,900 236,700 150,300
88. Once considering the numbers who may fully withdraw their pension, it is important to consider what
the individual may subsequently do with their pension pot. The FCA’s Financial Lives Survey61
found
of those fully encashing their pension:
• 38% put their funds in a savings product.
• 14% invest their funds.
• 29% make a large expense with the funds.
• 20% pay off their debts using the funds.
89. Withdrawals are a personal decision, and it is incredibly challenging to know what an optimal (and
sub-optimal) outcome may look like. This will be dependent on personal preferences, satisfaction
from the decision, and how the money was used. Nevertheless, there are some individuals who are
having to withdraw their pension who may benefit from a default offering. This is particularly the case
given large percentages report wanting an income from their pension pot; much greater than the
proportion who currently access their pension as an income (PPLL found “similar proportions
planned to take an annuity (39%) or to purchase an income drawdown product (37%)”62
. To approach
this, a very simplistic design of member benefits is derived from the Financial Lives Survey (2022)
which, in the absence of alternative evidence, is likely to be a significant underestimate of the benefit.
See table 11.
Table 11: Assumptions of the impacts of reducing full cash withdrawals
Individuals
who…
The potential benefit Monetised or
Non-Monetised
Put their
funds into a
Saving into a pension (which tend to be invested in higher risk, and
therefore higher returns in the long-run) should deliver greater
returns compared to average saving accounts. The difference
between the average returns for those around State Pension Age
Monetised
61
https://www.fca.org.uk/financial-lives/financial-lives-2022-survey
62
https://www.gov.uk/government/publications/planning-and-preparing-for-later-life/planning-and-preparing-for-later-life#private-pension-
provision
240.
240
savings
product
from large pensionschemes (3.96% from Corporate Adviser63
) and
the average savings account (assumed to be lower at around 3%64
)
is used to monetise the potential gains. There are tax advantages
too (which is not monetised here): some individuals may have to
pay tax on interest returns, whereas capital gains are tax-free in a
pension wrapper. Drawing from the Financial Lives Survey (2022),
it is assumed 38% of members who fully withdraw put their funds
into a savings product.
Invest their
funds
Although “invest” could account for a wide range of types of
savings, such as ISAs to high-risk investments, the Financial Lives
Survey does not ask for further details. As a result, it is assumed
investing funds will deliver similar returns/benefits compared to
remaining in a pension fund. Although a simplistic assumption, it
can be reasonably assumed someone deciding to invest their fund
may have a greater level of financial capability and therefore would
have considered the financial implications of their decision, so is
unlikely to be facing higher or lower financial returns. Drawing from
the Financial Lives Survey (2022), it is assumed 14% of members
who fully withdraw invest their savings.
Non-Monetised
Make a large
expense
It could be considered someone spending their pension pot might
be “better off” by keeping their money invested due to the
investment returns they would receive. However, this is difficult to
monetise the benefits as an individual may derive significant utility
from making a large expense, such as a new car or holiday,
offsetting any financial gains. Equally, a large expense could
include buying an asset, such as a second home, which could be
used to derive an income. As a result, no attempt is made to
monetise this but recognise there are potential costs/benefits to this
group. Drawing from the Financial Lives Survey (2022), it is
assumed 29% of members who fully withdraw use their funds to
make a large expense.
Non-Monetised
Pay off debts For some individuals, they may pay off their mortgage or a loan
with their pension pot. Although this would result in missing out of
financial returns, it equally could save money through avoiding
paying high interest rates. This is a highly complex financial
decision with significant trade-offs for which there is insufficient
evidence to explore this in more detail. Therefore, this benefit is not
monetised. Drawing from the Financial Lives Survey (2022), it is
assumed 20% of members who fully withdraw put their funds use it
to pay off outstanding debts.
Non-Monetised
90. Using the assumptions outlined above, of those who save into a pension, the investment returns
between a cash savings account (3% annual returns) and remaining invested in a pension (4%
annual returns) can be compared. The average wealth in year zero is estimated to be £15,400 as
derived in paragraph 84 above, but this is then adjusted to account for the growth in the proportion of
63
The Corporate Advisor Master Trusts and GPP Report gives a five-year average return of 3.96% for an investor in a workplace default fund
one day before State Pension age. It is assumed that members who opt to remain invested with their pension scheme will receive returns on
this scale (subtract the 0.5% providers tend to charge on investment returns).
64
https://www.statista.com/statistics/1455355/interest-rate-of-instant-access-deposits-uk/
241.
241
pots over £10,000.Projecting future pension pot sizes is challenging due to the very limited data and
the counteracting drivers at play. For example, greater contributions will continue to push up average
pot values, with the Workplace Pension Participation publication showing that the average private
sector saver contributed £2,840 to their pot in 2023.65
Greater investment returns will also push up
the average pot value. As more pots cross the £10,000 threshold however, this will push down the
average pot value of all pots over £10,000.
91. To account for these unknowns and opposing impacts, the average pot size over £10,000 is adjusted
by half of the growth in the proportion of pension pots over £10,000. Table 12 below illustrates the
impact of this:
Table 12: Adjustment to average pension pot value over £10,000
Year Year-on year growth
in proportion of pots
over £10,000
Year-on-year downward
adjustment to average
pot value over £10,000
(rounded to the nearest
ppt)
Pre-adjustment
average pot size
over £10,000 for
remaining invested
(nearest £100)
Post-adjustment
average pot size
over £10,000 for
remaining invested
(nearest £100)
2029 4.1% 2.0% £15,400 £15,000
2030 3.9% 1.9% £16,000 £15,700
2031 3.8% 1.9% £16,600 £16,300
2032 3.6% 1.8% £17,300 £16,900
2033 3.5% 1.7% £17,900 £17,600
2034 3.4% 1.7% £18,600 £18,300
2035 3.3% 1.6% £19,400 £19,100
2036 3.2% 1.6% £20,200 £19,800
2037 3.1% 1.5% £21,000 £20,600
Source: DWP calculations based on industry engagement
92. The estimates above on the counterfactual and post-legislation full-cash withdrawals are multiplied
by 38% to restrict to those who would have put their pension funds into a savings account (see table
13 below). Those who no longer withdraw to put their funds into a savings account will now earn an
extra 1 percentage point in returns (3.96% as opposed to 3% – see table 11). As Table 13 below
demonstrates, it is estimated that 31,000 more individuals remain invested in 2030, earning £145
more by 2031 than if they had withdrawn their funds into a savings account – this results in £5m
benefits to members in 2031. An individual remaining invested in 2029 as opposed to withdrawing
into a savings account would earn on average around £1,500 more by 2037 (the end of the ten-year
period of analysis). The benefits gradually increase from around £5m in 2031 to £173m in 2037 as
returns accumulate and further cohorts of members enter retirement. This is a direct benefit to
pensioner members, as they are realised as a direct consequence of the estimated reduction in full
cash withdrawals.
65
https://www.gov.uk/government/statistics/workplace-pension-participation-and-savings-trends-2009-to-2023
242.
242
Table 13: Estimatednumbers of counterfactual and post change full cash withdrawals into a
savings account (with no financial advice or guidance)
Year Full Cash Withdrawals
(Counterfactual)
(nearest 100)
Full Cash Withdrawals
(post change)
(nearest 100)
Difference
(nearest 100)
2029 94,300 94,300 -
2030 100,900 69,900 31,000
2031 106,900 72,800 34,100
2032 113,300 75,900 37,500
2033 120,100 79,000 41,100
2034 126,200 81,500 44,600
2035 132,500 84,100 48,300
2036 139,100 86,700 52,400
2037 146,000 89,300 56,700
243.
243
Figure 5: Flowchartdemonstrating the behavioural change assumed for reduced full-cash withdrawals
244.
244
Savings in transfercosts
93. Many schemes in the trust-based market are currently accumulation-only and do not offer
decumulation services. This results in members being obliged to fully withdraw or transfer their
pension at retirement. This creates a significant risk as members who wish to access a decumulation
product, such as a drawdown, have to transfer their money. HSBC analysis1
suggested this could
create significant costs to members, for example:
▪ Moving to a retail pension platform could lead to greater annual management costs
(potentially 2% compared to around 0.5% in trust-based market and transfer fees (around
0.8% of assets).
▪ Moving to an existing Master Trust which offers drawdown could lead to similar annual
management charges but still result in a transfer fee cost (around 0.8% of assets).
94. Nest Insight evidence2
shows 11% of transfers out of Nest are by those aged 55+; a group most
likely to be entering the decumulation phase. Nest do not represent all schemes, and the
demographic of their members may differ from the rest of the schemes in the market; thus, the
proportion of their transfers for age 55+ may not represent the entire market. Nevertheless, it is the
largest scheme by membership size, and in the absence of any other data, this assumption is
adopted for the entire market.
95. To estimate the number of transfers into the future, a number of trends are projected forward:
▪ TPR data shows the number of people in the trust-based market transferring has increased
across the past couple of years, but at varying rates. This includes transfers across all ages.
Based on Nest evidence (see paragraph 94), it is assumed 11% of all transfers are by those
aged 55 or above and restrict the analysis to this subset.
▪ TPR data also shows a growing number of savers aged 50-59 – an average of 11% per
annum between 2021-2023 – and who are therefore approaching the age at which they may
access their pension. HMRC data on people making their first pension cash withdrawal in 13
months3
shows that over the past three years to March 2023 the year-on-year growth figure is
13%.
▪ PPLL research found the average age of accessing a DC pension was around 60 years old.
▪ Scheme discussions on the estimated projection of the number of pension pots, outlined a
trend of decreasing growth to a ‘steady state’ of 5% by the mid-2030s.
▪ It is assumed the growth rate in transfers for age 55+ members across the next five years
matches the trend estimated for the growth in full-cash withdrawals (Table 9), as these are
both based on the projected growth of 55+ membership. Higher growth in the initial period is
also consistent with the above findings.
96. Using a combination of the various sources, a growth rate akin to the growth in full-cash withdrawals
(see table 9 above) is applied which:
▪ Starts at 10%, which acknowledges recent trends in the growth of 50-59 membership (11%),
but accounts for a slightly more mature market since 2023.
▪ Slowly declines by around half a percentage point per year given further maturing of the
market (as shown from the FCA data which indicates a slowdown in the growth rate in the
contract-based market).
▪ Reaches a steady state of 5% growth in the mid-2030s, reflecting scheme discussions and
projections.
▪ This growth rate recognises growth in transfers in the trust-based market is unlikely to
continue to be as strong over time. The average growth across the period is estimated 7%,
with the distribution around this mean showing the maturing of the trust-based market (see
table 14 below).
1
https://online.email.hsbc.co.uk/HSBC_Tomorrow_Report_Converting_pension_pots_into_incomes.pdf
2
Nest Retirement Saving in the UK
3
HMRC define first pension cash withdrawal as someone accessing a pension amount where there has not been a withdrawal in the last 13
months.
245.
245
Table 14: Growthin counterfactual transfers (in the absence of a policy change)
Year
Growth from
previous year
2024 10%
2025 10%
2026 9%
2027 8%
2028 8%
2029 7%
2030 7%
2031 6%
2032 6%
2033 6%
2034 5%
2035 5%
2036 5%
2037 5%
97. The above steps allow us to reach a counterfactual estimate of transfers for members who are aged
55 or above and able to access their pension. To estimate the effect of the proposed legislation, it is
assumed around 50% of transfers at retirement are to access a decumulation product from another
scheme; therefore, the legislation is expected to reduce transfers by 50% compared to the
counterfactual. As outlined previously, this is highly uncertain but recognises the existing challenge in
the market. A range is computed on this assumption (and this benefit as a whole) based on other
available data (see sensitivity analysis section).
98. To estimate the benefits of having decumulation products available, it is estimated by the reduction in
the number of transfers being made as a consequence of having decumulation available and
multiplied by the average pension pot size (£15,400, which is uprated by 3.96% a year) and by the
average transfer fee (estimated at 0.8% of the fund value).
99. Not all pension funds will charge exit and entrance fees for transferring, such as contract-based
schemes which also operate in the trust-based market. Around a quarter of contract-based schemes
also operate in the trust-based market and have approximately 13% of the trust-based membership.
Large master trusts like Nest and The People’s Pension – who have a combined market share of
67% – also do not charge transfer fees4
. It is therefore assumed three-quarters (75%) of transfers will
not accrue fees.
100. Transfer fees are estimated as some funds may have greater fund charges (though this hugely
varies and would be dependent on scheme chosen) and is a similar saving estimated by the FCA on
Investment Pathways (adding validity to the estimate). Nevertheless, this is likely to underestimate
the benefit to members. While some schemes will lose out on revenue from transfer fees, other
schemes will stand to benefit from retained membership, leading to a greater pool available for
investment, and thus higher returns and charges.
101. In summary, it is expected members may benefit by £1m in 2030, slowly rising to £2m in 2037
reflecting the growth in DC trust-based membership. For example, in 2030, there is an estimated
27,700 reduction in transfers, from which 25% were estimated to accrue transfer fees in the
4
See https://www.nestpensions.org.uk/schemeweb/nest/my-nest-pension/transfer-your-pension-pots.html and
https://members.tpt.org.uk/combining-your-pensions/
246.
246
counterfactual (6,900 individuals).The average pot size is estimated to be £16,000, and by applying
the average transfer fee (estimated at 0.8% of the fund value) to this, the transfer cost saved would
be £130. Applying this to the 6,900 individuals who now save on transfer fees gives a benefit of
£0.9m in 2030. Savings in transfer costs is a direct benefit to pensioner members as they will be
realised as an immediate consequence of the estimated reduction in transfers.
Table 15: Estimated counterfactual and post change transfers and fees saving
Year Transfers
(Counterfactual)
(nearest 100)
Transfers
(post change)
(nearest 100)
Average transfer
pot value
(nearest £100)
Transfer fee
saving (0.8%)
2028 - - - -
2029 51,700 51,700 £15,400 £0.0m
2030 55,300 27,700 £16,000 £0.9m
2031 58,700 29,300 £16,600 £1.0m
2032 62,200 31,100 £17,300 £1.1m
2033 65,900 33,000 £17,900 £1.2m
2034 69,200 34,600 £18,600 £1.3m
2035 72,700 36,300 £19,400 £1.4m
2036 76,300 38,200 £20,200 £1.5m
2037 80,100 40,100 £21,800 £1.7m
Greater returns from entering default retirement product
102. Schemes should be able to make longer term investment decisions knowing a greater proportion
of their membership will not be fully withdrawing or transferring their pension in full at the point of
retirement. Where schemes are anticipating full cash withdrawals, their asset allocations are in highly
liquid assets (such as cash and government bonds) for older savers – this is evident in schemes who
do not currently offer decumulation products5
. However, encouraging greater numbers to remain
invested (through the default decumulation offering) can mean investment in return-seeking and
more illiquid assets. This will deliver stronger returns for members and may lead to greater
investment in more productive assets (such as private equity and infrastructure) which tend to have a
greater home bias compared to other assets such as listed equities.
103. Schemes invest their members’ pension pots according to certain milestones; for example, the
funds of younger savers tend to be invested in riskier, high-returning assets with the view that this will
produce the highest returns in the long term. Closer to retirement, members enter an investment
phase referred to as lifestyling, where their funds are invested in less riskier assets that tend to have
lower but stable returns6
. Investment performance for pension schemes tend to thus be reported for
these different stages; one such stage is the five-years pre-retirement, where schemes tend to
allocate members’ funds according to their chosen path for decumulation. Where no decumulation
solution is available, funds are moved into cash and liquid assets, in anticipation of members fully
withdrawing their pension.
104. With the introduction of a default retirement solution for members, individuals who currently save
into accumulation-only schemes will no longer be compelled to transfer or withdraw their pension. AE
has shown the power of defaults due to inertia, with opt-out rates being around 8%-10% and pension
participation for those eligible being close to 9-in-10 workers. It can be expected most savers who
5
Corporate Advisor Retirement Report, 2023
6
Corporate Advisor Retirement Report, 2023
247.
247
would have previouslywithdrawn or transferred but will not do so post-legislation will now enter their
respective scheme’s default retirement solution. Since having a default solution reduces the risk of
large cash withdrawals, this allows schemes to invest for longer and not need as much liquidity (as
the probability of full-cash withdrawals is lower).
105. As a result, schemes will be able to ensure members approaching retirement remain invested in
higher-returning assets, as members saving through inertia will no longer be compelled to make a
decision at retirement, whether that means transferring their pension pot to another scheme or fully
withdrawing their pension into a savings account. The Corporate Advisor report found that for
members entering investment pathways, the returns for members staying invested (option 1) was
2.86% in 2023 and 11.54% in 2024, whereas for individuals intending to withdraw their entire pension
in the next five years (option 4), it was 0.47% in 2023 and 6.78% in 20247
. An average is taken for
the returns for both options from 2022 and 2023 to reflect the inevitable varying market conditions
across the ten-year period analysis. This results in an estimated 7.2% returns per annum when
invested in higher-returning assets, compared to an estimated 3.6% returns in the counterfactual
where funds are invested in liquid assets. The 7.2% returns are a proxy for schemes allocating
members’ assets in anticipation of them entering their default product as opposed to withdrawing or
transferring their pensions (in which case the returns are proxied at 3.6%).
106. Table 10 above shows the counterfactual versus post-legislation full-cash withdrawals based on
all options selected following the withdrawal (see table 11 for the four broad options members are
found to select); since the reduction of full-cash withdrawals is premised on a default product being
available/offered, it is assumed the entirety of the difference between the counterfactual and post-
legislation will enter a default drawdown solution. As for transfers, it is assumed above that the
reduction post-legislation occurs for those individuals who were previously saving in a scheme which
did not offer adequate decumulation services. It is therefore assumed that once a default retirement
solution is offered by schemes according to the profile of their membership, those individuals who no
longer transfer post-legislation enter their respective scheme’s default solution.
Table 16: Estimated counterfactual and post-change transfers & full-cash withdrawals and
decumulation decision making
Year Transfers
(Counterfactual)
(nearest 100)
Transfers
(post
change)
(nearest
100)
Previous
transfers
that now
enter
default
(nearest
100)
Full-cash
withdrawals
(Counterfactual)
(nearest 100)
Full-cash
withdrawals
(post
change)
(nearest
100)
Previous
Full-cash
withdrawals
that now
enter
default
(nearest
100)
2029 51,700 51,700 - 249,800 249,800 -
2030 55,300 27,700 27,700 267,300 185,100 82,200
2031 58,700 29,300 29,300 283,300 192,900 90,400
2032 62,200 31,100 31,100 300,300 201,000 99,300
2033 65,900 33,000 33,000 318,300 209,400 108,900
2034 69,200 34,600 34,600 334,300 216,000 118,200
2035 72,700 36,300 36,300 351,000 222,800 128,200
2036 76,300 38,200 38,200 368,500 229,700 138,900
2037 80,100 40,100 40,100 386,900 236,700 150,300
107. The initial average wealth in year zero is estimated to be £15,400, as derived in paragraph 84
above. Paragraph 105 outlines the estimated difference in returns when members are expected to
7
Corporate Advisor Retirement Report, 2023; Corporate Advisor Retirement Report, 2024
248.
248
enter the defaultcompared to being expected to fully withdraw or transfer their pension (7.2%
compared to 3.6%). The differences in returns can be estimated for members (who now no longer
fully withdraw their pension or transfer) in the five years leading up to retirement (after adjusting for
charges of 0.5%). Paragraph 103 outlines the working assumption that the asset allocation for
members’ pots occurs five-years pre-retirement; therefore, the first cohort of members to benefit in
higher returns pre-retirement will be in 2034, five years after the legislation is estimated to be
enacted. The benefits significantly increase from around £41m in 2033 to £765m in 2037. This is a
direct benefit to pensioner members that is realised as a result of members remaining invested with
their scheme in the long run as opposed to deciding to fully withdraw or transfer their funds to
another scheme. See tables 17a and 17b for how the benefits are computed.
Table 17a: Difference in returns through remaining invested in higher-returning assets
Year Returns (cash-based
investment)
Returns (pension-
based investment)
Difference in returns
Year 1
£15,900 £16,500
£500
Year 2
£16,500 £17,600
£1,200
Year 3
£17,100 £18,900
£1,800
Year 4
£17,700 £20,300
£2,600
Year 5
£18,300 £21,700
£3,400
Notes: Nearest £100, average pot size of £15,400 in Year 0.
249.
249
Table 17b: Computationof benefits to members pre-retirement through default offering (first three years cohorts)
Year
Cohort 1
(first receiving benefits in 2033)
Cohort 2
(first receiving benefits in 2034)
Cohort 3
(first receiving benefits in 2035)
Reduction in
transfers and full-
cash withdrawals
(nearest 100)
Aggregate
increased
returns for these
members (after
0.5% charge)
(nearest £m)
Reduction in
transfers and
full-cash
withdrawals
(nearest 100)
Aggregate
increased
returns for
these members
(after 0.5%
charge)
(nearest £m)
Reduction in
transfers and
full-cash
withdrawals
(nearest 100)
Aggregate
increased
returns for
these members
(after 0.5%
charge)
(nearest £m)
2033 74,100 £41m
2034 £86m 79,200 £43m
2035 £136m £93m 84,700 £47m
2036 £191m £145m £98m
2037 £251m £204m £155m
Notes: The aggregated increased returns are calculated by multiplying the reduction in transfers and full-cash withdrawals by the difference in returns
from remaining invested in higher-returning assets (see Table 17a). For example, there is a 74,100 reduction in full-cash withdrawals and transfers for
Cohort 1 in 2033. This is multiplied by the difference in returns in year 2 (£1,200, rounded to the nearest £100 – see table 17a) and multiplied by 99.5%
(to adjust for the 0.5% scheme charge). This results in an aggregate increased return of £86m in 2033 for this cohort. There are a total of five cohorts that
are estimated to benefit throughout the appraisal period (2028-2037).
250.
250
Benefits to Schemes
Areduction in full-cash withdrawals leading to increased revenue from charges
108. As explained above the proposed legislation should lead to a reduction in money leaving the
trust-based pension market. This can generate a number of benefits for the pension schemes,
including:
• Greater investment returns (and thus charges) as knowing members are more likely to
remain within the scheme can lead to the asset allocations of funds taking a more long-term
approach (and thus delivering greater returns). Higher pension pot values will lead to greater
revenues from the charges being applied.
• Offering a decumulation service – it is assumed only those who can make a profitable
decumulation service (in the medium to long-term) will create one. This should develop a
profitable product for the industry, especially as pension pots continue to grow, leading to
greater revenue. Those who are unable to deliver at a profit (or without loss, for those non-
profit organisations) will transfer their members to a relevant scheme that can offer a
decumulation service.
109. The challenge in monetising some of the benefits of decumulation is that the gain for trust-based
schemes (who may not all offer decumulation services now) may be a loss to contract-based
schemes (who would otherwise have received the pension pot). This may be best considered a
transfer rather than a fully monetised benefit.
110. The above section on the benefits to members from reduced full-cash withdrawals explains the
method employed to calculate this reduction from the proposed legislation. Paragraph 84 also
derives an estimate of the average full-cash withdrawal over £10,000 (the threshold) in the trust-
based market to be £15,400.
111. The Corporate Advisor found a five-year average return of 3.96% for an investor in a workplace
default fund one day before State Pension age. It is assumed members who opt to remain invested
with their pension scheme as opposed to fully withdrawing will receive returns on this scale. Table 18
outlines how many people are expected to remain invested post-policy who would have fully
withdrawn in the counterfactual scenario. Schemes charge, on average, around 0.5%1
on pension
pots. This should deliver additional revenues in charges of around £6m in 2030, rising to £85m in
2037 reflecting the reduction in the growth of full-cash withdrawals compared to the counterfactual
(arising from a growth in DC trust-based membership). This is a direct benefit to pension schemes
arising from a greater number of members deciding to remain invested as opposed to fully
withdrawing their pension.
112. Note that the benefit to schemes in terms of additional revenue from charges arises from the
entire pension pot that now remains invested (that was fully withdrawn in the counterfactual), not only
on the additional investment returns generated. Schemes will also benefit from all pots that are
withdrawn in the counterfactual and not post-policy, unlike for members where it is assumed that only
those fully withdrawing into a savings product in the counterfactual, but no longer post-policy, stand
to benefit. This is because irrespective of whether the member benefits by remaining invested as
opposed to fully withdrawing, schemes will receive additional revenue from charges on pot funds
remaining in the market.
1
https://www.gov.uk/government/publications/pension-charges-survey-2020-charges-in-defined-contribution-pension-schemes/pension-
charges-survey-2020-charges-in-defined-contribution-pension-schemes
251.
251
Table 18: Estimatedcharges collected by schemes due to reduction in full-cash withdrawals
into savings account
Year Difference in
counterfactual vs
post-policy full-
cash withdrawals2
(nearest 100)
Average pot size
with returns (for
the first cohort)
(nearest £100)
Total cumulative
increase in
funds in the
trust-based
market due to
reduction in full-
cash
withdrawals
(nearest £0.1bn)
Charges
collected
(0.5% on pot
size)
(nearest £0.1m)
1 - £14,500 - -
2 - £15,000 - -
3 82,200 £15,700 £1.3bn £5.8m
4 90,400 £16,300 £2.8bn £12.6m
5 99,300 £16,900 £4.6bn £20.7m
6 108,900 £17,600 £6.7bn £30.2m
7 118,200 £18,300 £9.1bn £41.2m
8 128,200 £19,100 £12.0bn £53.8m
9 138,900 £19,800 £15.2bn £68.4m
10 150,300 £20,600 £18.9bn £85.1m
Notes: To calculate the benefit to schemes per year, the cumulative reduction in full-cash withdrawals is
multiplied by the average pot size with returns that now remains in the trust-based market. For example,
in year 4, there is estimated to be a reduction in full-cash withdrawals of 90,400 – this is multiplied by the
estimated average pot size that remains invested post-policy adjusted for returns, which is £16,300 in year
4. However, there is also estimated to be a reduction of full-cash withdrawals in year 3 of 82,200, and that
too is multiplied by the pot value £16,300 in year 4. Thus, this gives a total increase of funds in the trust-
based market in year 4 of £2.8bn. As discussed above, schemes are estimated to charge 0.5% on pension
pots, leading to charge revenue of £12.6m in year 4 (see column 5). In summary, the scheme benefits
from this charge revenue is cumulative, so in year 4, schemes benefit in the reduction from the
counterfactual from both years 3 and 4.
Default decumulation retirement options leading to increased revenue from charges
113. The benefits of a default decumulation option for members is explained in detail above. Defaults
will also generate benefits for pension schemes through greater investment returns (and thus
charges), as knowing members saving through inertia are more likely to remain within the scheme
can lead to the asset allocations of funds taking a more long-term approach (and thus delivering
greater returns). Higher pension pot values will lead to greater revenues from the charges being
applied.
114. The above section on the benefits to members explains the method employed to calculate how
many members will benefit from a default product. Members are estimated to receive 3.58% higher
returns per annum (see paragraph 105) for five years prior to retirement on their pension pot, which it
2
Note that here, the counterfactual versus post-legislation full-cash withdrawals is not adjusted to only account for those members who would
have put their funds in a savings account in the counterfactual. This is because schemes would stand to benefit with all reductions in full-cash
withdrawals, irrespective of what the members decides in the counterfactual scenario (which, other than putting the funds in a savings account,
could be to invest separately, pay off debts, or make a large expense).
252.
252
is estimated tobe £15,400 in year zero. Schemes charge, on average, around 0.5%3
on pension
pots. The higher returns should deliver additional revenues in charges of around £0.4m in 2033,
rising to £7m in 2037. This is a direct benefit to pension schemes arising from a reduction in full-cash
withdrawals and transfers due to a default decumulation offering. Note that the benefit to schemes
here in terms of additional revenue from charges arises only from the additional investment returns
generated, as the pension pots are expected to remain in the trust-based market until members
reach retirement.
Table 19: Estimated itemised ongoing benefits over the appraisal period, undiscounted (£m)
2030 2031 2032 2033 2034 2035 2036 2037
Greater returns from reduced full-
cash withdrawals (member benefit) -
4.5 14.2 29.9 52.7 83.5 123.3 173.5
A reduction in full-cash withdrawals
leading to increased revenue from
charges (scheme benefit)
5.8 12.6 20.7 30.2 41.2 53.8 68.4 85.1
Savings in transfer costs
(member benefit)
0.9 1.0 1.1 1.2 1.3 1.4 1.5 1.7
Greater returns from entering default
solution (member benefit)
- - - 40.5 128.6 272.5 481.1 764.5
Default solution leading to increased
revenue from charges
(scheme benefit)
- - - 0.4 1.1 2.4 4.2 6.7
Scheme benefits 5.8 12.6 20.7 30.6 42.3 56.2 72.6 91.8
Member Benefits 0.9 5.5 15.3 71.6 182.6 357.4 605.9 939.7
Total Benefits 6.7 18.1 36.0 102.2 224.9 413.6 678.5 1031.5
115. As table 19 outlines, the vast majority of benefits are obtained by members; for those members
who stand to benefit either by no longer transferring or fully withdrawing their pension into a savings
account, the average benefit per these members is estimated to be £1,900 across the appraisal
period.
116. Table 1 outlined how the legislation results in an estimated equivalent annual net direct cost to
business (EANDCB) of £13m. This is largely due to costs to schemes accrued being immediate (and
a significant proportion of costs being upfront), while benefits in the form of increased revenue from
charges begin to be realised from year 3 of the ten-year appraisal period, once decumulation
offerings are in place. The proposed policy is estimated to become a net benefit to business by
year 12, as revenue from charges outweighs ongoing running costs at an increasing rate. So,
while there is net cost to business in the immediate ten-year appraisal period, there is likely to
be a significant net benefit to business in the long term.
3
https://www.gov.uk/government/publications/pension-charges-survey-2020-charges-in-defined-contribution-pension-schemes/pension-
charges-survey-2020-charges-in-defined-contribution-pension-schemes
253.
253
Figure 6: Flowchartmapping the estimated benefits arising post-legislation and its associated behavioural changes
254.
254
Non-monetised benefits:
117. Thereis significant uncertainty around the policy, behavioural responses observed,
and how schemes develop their defaults. In addition, data is not always readily available or
easy to measure. As a result, there are a wider range of benefits that could arise from the
legislation but are hard to monetise at this point in time. These include:
▪ Reduced complexity: Members may be more likely to understand the options that are
available to them as a result of schemes giving greater levels of information on
decumulation and develop a suitable pathway for those who do not want to, or unable
to, make complex decisions. This should reduce the search costs and complexity to
members. As a result, members should find the decision-making simplified and less
complex, reducing the risk of taking a wrong financial option. This benefit to welfare
could be significant; however, it cannot be monetised due to complexities in doing so.
▪ Greater innovation: The legislation is intended to allow schemes to develop
decumulation products as they see best for their membership. As argued previously, this
could limit innovation with schemes taking a risk averse approach. Equally, schemes
may seek to maximise the opportunity and become more competitive on their
decumulation offer to members. This could drive innovation in the market, leading to
new and innovative decumulation products, which could lead to greater outcomes for
individuals. This benefit cannot be known nor quantified with any robustness.
▪ Asset allocations leading to higher returns: Given the default solution, schemes can
invest in invest in longer-term, higher-returning assets knowing that less members are
likely to withdraw – this could result in higher investment returns than what is currently
estimate based on investment data of pension schemes. This may also have wider
spillovers and benefits in the UK and with the goal of productive finance and economic
growth. The magnitude of this is incredibly difficult to determine, and thus, these
potential further benefits have not been monetised.
▪ Reduced reliance on advice/guidance: The legislation entails that schemes will
develop a default solution, based on the general profile of their members. As a
backstop, the member would be placed into this solution if they do not make an active
choice on accessing their pension savings. This may potentially reduce the need for
financial advice or guidance (which may come at a cost, for financial advisers, or time
costs in the case of guidance), as the default is expected to be a low-risk, sustainable
solution for members who do not engage or do not desire to purchase an alternative
product. While members wishing to access their pension savings will still be nudged to
attend a Pension Wise appointment, the existence of a default solution may potentially
reduce the need for financial advice for those members unsure of which decumulation
product to purchase. The extent of this, however, is difficult to quantify.
▪ Managing longevity risk: The default solution is expected to lead to a reduction in full-
cash withdrawals, as explored above. One key benefit of this not monetised is that this
will manage longevity risk. The IFS report426
that individuals in early retirement tend to
underestimate their life expectancy, which potentially hinders their ability to plan their
retirement – if an individual is to fully withdraw their pension in such a case, it is likely
that that they will spend their pension savings at a rate which may not last them
throughout their retirement. It also may entail that individuals become reliant of state
benefits such as Pension Credit later in retirement if they run out of private pension
savings – this could come at a significant cost to the government. The default is
expected to mitigate this risk, though the extent of this cannot be known or quantified at
this point in time.
426
https://ifs.org.uk/publications/subjective-expectations-survival-and-economic-behaviour
255.
255
Sensitivity analysis
Costs
• Policylength for familiarisation cost (central estimate: £296,000, one-off cost) – In
accordance with the FCA’s Investment Pathways cost-benefit analysis, the policy
documentation is assumed to be 40 pages in length, which takes two hours for trustees
to read. However, since the policy details and clauses have not been finalised, it is
acknowledged that policy documentation either be longer or shorter. For the low and
high scenarios, it is assumed 20 and 60 pages respectively, and this gives a one-off
familiarisation cost range between £148,000 – £444,000.
• Transfer arrangements costs – In roundtables and one-to-one meetings with industry,
there were various potential one-off cost estimates for partnering. While the IA settles on
estimates that were more widely reported, the various cost estimates given does create
a degree of uncertainty. For example, it could be the case that schemes face lower
costs for a partnership if they do not engage in a comprehensive search for a suitable
arrangement. A range of total one-off transfer arrangements cost is therefore presented
of £19m – £77m based on the various estimates received.
Table 20: Range of one-off transfer arrangement costs
Scheme Size Cost per scheme to
partner
Number of
schemes
Total Costs
Small £10,000 – £100,000 510 £5m – £51m
Medium £100,000 – £200,000 80 £8m – £16m
Large £200,000 – £300,000 30 £6m – £10m
Total 620 £19m – £77m
Table 21: Range of ongoing reviewing transfer arrangement costs excluding
consolidation impacts
Scheme Size Cost per scheme to
partner
Number of
schemes
Total Costs
Small £1,000 – £10,000 510 £0.5m – £5m
Medium £10,000 – £20,000 80 £0.7m – £1m
Large £20,000 – £30,000 30 £0.6m – £1m
Total 620 £1.9m – £7.5m
Note: Number of schemes declines over the 10-year period and partnerships are
reviewed every 3 years. Total may not sum due to rounding.
In-house decumulation product development (one-off costs, and ongoing costs
between 2028-2037) – Similar to the transfer arrangements cost, estimated in-house
product development estimates are from industry roundtables and one-to-one meetings, and
there were various estimates. Based on this, across the ten-year appraisal period (2028-
2037), a range of £153m to £763m has been used around the central estimate of £381m
which was discussed in detail above. The range is based on various reports of one-off
256.
256
development costs andper member costs of running drawdown, with the lowest and highest
estimates being used to present the low-high scenarios.
Table 22: Range of in-house decumulation development costs (£m)
(undiscounted) Low Central High
One-off upfront costs £0.3m £0.5m £1m
Ongoing costs per
member
£20 £50 £100
Total one-off costs £1.8m £3.5m £7m
Total ongoing costs £153m £381m £763m
Table 23: Estimated change in costs by varying costs-related assumptions
Costs range (undiscounted)
Low Central High
Familiarisation £0.1m £0.3m £0.4m
Training £6.9m £6.9m £6.9m
Partnering for
transfer
arrangements
£21.3m £50.1m £84.2m
In-house
development
£154.3m £384.8m £769.5m
Total costs £182.6m £442.1m £861.0m
Benefits (all benefits are ongoing across the appraisal period 2028-2037)
• Behavioural assumption for post-legislation full-cash withdrawals – Estimates for the
change in full-cash withdrawals post-legislation is based on behavioural responses to the
Investment Pathways options. For the central estimate, it is assumed one-third (33%) of the
37% of individuals who select option 4 (have no plans to access their pension) will opt for
drawdown when they decide to access. This gives a central estimate for this benefit for
members and schemes of £799m across the ten-year appraisal period (2028-2037). Since it
is uncertain whether individuals will accord to this behaviour, for the low scenario, it is
assumed all individuals who select option 4 fully withdraw eventually. For the high scenario,
it is assumed that the default decumulation offering will eventually have the same
behavioural effect as Automatic Enrolment, where around 90% of eligible employees (over
20m) participating in a pension in 2023 (the policy was initially introduced in 2012). It is thus
assumed that in the high scenario, post-legislation full-cash withdrawals reduce
incrementally over the appraisal period to 10% of the counterfactual trend by 2037. The
sharp reduction in full-cash withdrawals in this high scenario represents an increasing take-
up of the default decumulation offering. This gives a range of £600m – £2,829m.
• Reduction in transfers assumption – It is assumed transfers to reduce by 50% compared
to the counterfactual. As outlined previously, this is highly uncertain but recognises the
existing challenge in the market. This gives a central estimate for this benefit of £10m. Nest’s
257.
257
Retirement Saving inthe UK report states that active member-directed switches were 32%427
of total switches, that is, around a third of total switches are from members choosing to
switch from their default pension fund to a fund of a different composition. This can be used
as a proxy for members deciding to transfer even when they have access to decumulation
options with their current scheme. This would leave 68% who transfer to have any access to
a decumulation product (high scenario), with the reverse low scenario being 32%. This gives
a range of £6.4m – £13.6m across the ten-year appraisal period (2028-2037).
• Returns for members entering asset allocation for default solution pre-retirement – It
is assumed returns for a pension pot in a default fund is equivalent to the average returns in
2023 and 2024 for option 1 of Investment Pathways where members remain invested
(7.20%), with the counterfactual being 3.63% based on option 4 of Investment Pathways
where members fully withdraw (difference in returns thus being 3.58%). The central estimate
for this benefit is £552m across the ten-year appraisal period (2028-2037).
• Investment returns can be considerably volatile and subject to change, and a small change
in returns can have significant impacts on the benefits estimated due to compounding
returns. Barnett Waddingham’s has five-year investment performance data at the retirement
phase for 22 trust-based schemes. The research found the following average returns across
the five-year period:
▪ Schemes that offer drawdown: 4.5%
▪ Schemes that do not offer drawdown: 2.5%
▪ Schemes that do not offer drawdown or UFPLS: 1.6%.428
Meanwhile, the Corporate Advisor reported an average return of 11.54% in 2024 for option 1
of Investment Pathways where members remain invested in a drawdown product.429
It is
assumed returns for schemes that offer drawdown provide a reasonable proxy for the low
scenario returns for a default solution. This is because—while schemes may offer alternative
default solutions (and are free to do so)—it is assumed drawdown will be the most likely
option being offered as a default in-house solution. Based on the above information, for the
high scenario:
▪ The counterfactual selected is the returns for schemes that do not offer drawdown
or UFPLS (1.6%) as per the Barnett Waddingham report,
▪ The returns on a default product are selected as 11.54% (as per the Corporate
Advisor Retirement Report in 2024)
For the low scenario:
▪ The counterfactual selected is the returns for those schemes that do not offer
drawdown only (2.5%), as per the Barnett Waddingham report.
▪ The returns on a default product are selected as 4.5%, as per the Barnett
Waddingham report on schemes that offer drawdown.
This gives a total range of this benefit from £608m – £5,742m. The large range reflects the
significant uncertainty and impact differing returns can have on a pension pot.
Table 24: Estimated change in benefits by varying benefits-related assumptions
Benefits range
(undiscounted)
Low Central High
Reduced transfers £6.4m £10.1m £13.6m
427
https://www.nestinsight.org.uk/wp-content/uploads/2022/10/Retirement-saving-in-the-UK-2022.pdf
428
https://www.barnett-waddingham.co.uk/comment-insight/research/dc-governed-default-investment-strategy-insights-2024/
429
Corporate Advisor Retirement Report, 2024
258.
258
Reduced
withdrawals
£600.1m £799.3m £2,841.4m
Defaultsolution
returns
£608.3m £1,701.9m £5,741.7m
Total benefits £1,214.8m £2,511.3m £8,596.7m
Table 25: Combined sensitivity in total costs and benefits
Total estimated range of costs and benefits
(Undiscounted)
Low Central High
Total costs £182.6m £442.1m £861.0m
Total benefits £1,214.8m £2,511.3m £8,596.7m
Risks and assumptions
118. As discussed and outlined, there are a number of key risks and assumptions
throughout the Impact Assessment. However, the main areas of risk include:
• Data and data assumptions (amber): The industry costs calculated in this Impact
Assessment have been extrapolated from industry engagement and feedback.
Although this is representative for the majority of savers, there is a risk smaller
schemes face different costs. Nevertheless, hearing directly from schemes on their
anticipated costs, and engaging with them directly gives us confidence on the scale
and estimates of costs. Assumptions employed in this Impact Assessment have been
drawn from a wide array of sources and transparency on the level of evidence has
been employer throughout. Some assumptions which underpin large values are based
on limited evidence, which naturally poses a risk. The sensitivity analysis aims to
capture the risk and uncertainties involved in the central estimate. Nevertheless, a big
challenge is lack of data from TPR on individual decumulation decision-making. This is
an area the department and regulator are working closely together on improving for the
future. Where TPR data is not available, the data from the contract-based side (FCA-
regulated) is used. Although the demographic of members is potentially quite different
from the trust-based market (which the proposed legislation impacts); analysis shows
similar levels of earnings between the two markets and AE has resulted in the two
markets converging somewhat given widespread pension participation. Nevertheless,
a number of adjustments have been made in an attempt to best replicate and account
for known differences (such as lower pension pots) to better reflect the trust-based
market and have tested these adjusted assumptions with industry. As more data
becomes available and the policy develops, assumptions will be developed and
estimates enhanced at the secondary legislation stage.
• Investment returns (amber): Investment returns are a key driver of improved
member benefits. As outlined, this has drawn on multiple sources to verify this
estimate, and investment performance (particularly given the tax advantages of
pensions) should outperform savings in a bank account. However, it has to be
recognised investment returns are highly uncertain and dependent on market
conditions and will vary by scheme.
• Final policy details (amber): At this stage there is uncertainty over the full impacts of
the proposal as policy details are yet to be finalised. DWP will continue to work with
industry in understanding the potential impacts and implications from the changes on
259.
259
industry and members.Timings of implementation, the specific details of the policy
(including how the market responds to offering defaults), and future decumulation
decision-making all make this incredibly challenging to estimate.
• Pessimism Bias (green): There is a further risk of the data collected and extrapolated
that schemes have overestimated their costs. One potential reason why this may have
happened is schemes cannot anticipate their costs without the final policy detail or
may want to reduce the regulatory burden to them. As a result, the cost estimations
may be higher than what schemes may face in reality.
• Behaviour change (red): There are assumptions about behaviour change happening
as a result of schemes putting defaults in place. AE has shown the power of defaults,
with 88% of eligible employees participating in a workplace pension; this is much
higher than originally anticipated. As decumulation is a complex decision, it is
reasonable to expect large numbers to follow this option. To illustrate this, early
findings from the Planning and Preparing or Later Life wave 2 survey430
show those
aged 40-75 with a DC pension, 43% would like their pension scheme to provide the
option of a default pathway. For those who think the default pathway should be
offered, the average amount they would be willing to pay as a one-off payment is £25
(this figure falls to £7 if looking at all adults who responded to the question). This figure
is a clear indication of the value attached to the default pathway, although it will be
offered free of charge to members. Nevertheless, survey evidence also shows many
people are happy with the decision to take a lump sum (or fully withdraw their
pension). Early findings from the PPLL wave 2 survey shows 87% of those aged 55+
who have taken a lump sum from a DC pension since 2015 are very or quite satisfied
with their decision.431
To add to the complexity, decisions may change over time as pot
sizes grow, products may become more or less popular and default offerings may
change to account for this. Innovation in the market may also change existing trends; it
is likely that financial advice and guidance may evolve to adapt to changes in the
market – all of this could also significantly affect changes in behaviour. The ‘stickiness’
of defaults may also largely depend on how schemes notify their members of it, that is,
whether members receive a one-time notification or regular reminders. This is a critical
assumption, hence the sensitivity, and one that will be monitored closely.
• Data collection costs (green): The trust-based market is regulated by The Pensions
Regulator (TPR). DWP will also work closely with TPR to ensure compliance.
However, TPR’s check on compliance may involve data collection, which may result in
the accrual of costs of administrative burdens or from employing extra resource.
Impact on small and micro businesses
119. To be consistent with the Pensions Dashboard Impact Assessment, and with other
Pensions Scheme Bill Measures, Small and Micro businesses are defined as DC schemes
with fewer than 1,000 members, though this definition isn't perfect as scheme size and
employer size don't always correlate. Importantly, trust-based schemes can be set up by
both smaller and larger employers, with a trend of smaller employers using Master Trusts for
workplace pensions to minimise costs and improve governance
Exemptions
120. Trust-based schemes with fewer than 12 members are exempt and out of scope from the
legislation. All Trust-based DC schemes with 12 members or over are in scope. This is to
ensure nearly all members can benefit from greater likelihood of receiving their pension
entitlement. There are currently 1,080 trust-based schemes in the DC market. Trust-based
schemes may be set up by both smaller and larger employers; however, it is important to
note pension funds are different to employers. These regulations do not impose costs on
430
Planning and Preparing for Later Life, 2024, Research Forthcoming
431
Planning and Preparing for Later Life, 2024, Research Forthcoming
260.
260
employers/businesses, but onpension funds (which may have a large amount of assets but
not necessarily large number of employees).
121. There has been a growing trend of smaller employers using Master Trusts when enrolling
their employees into a workplace pension. These employers will not face any costs; only the
Master Trust (or very small number of employers running a single-employer trust) would face
a cost of implementation.
Proportionality
122. From TPR’s scheme return data 2023-24432
, there are 790 schemes with between 12 and
999 members and for the purposes of this analysis, this is the definition of small businesses.
This definition is consistent with the DC IAs for all elements of the Pension Scheme Bill.
Further, there are 26,000 members aged 50+ in these schemes as of 2023 (this is 0.36% of
the total of 7.2 million members of this age in all schemes)433
.
123. The costs to small schemes outweigh the direct benefits given the costs of partnering to
transfer members to schemes with decumulation products. However, savers in smaller
businesses will significantly benefit as this is a group who are currently unlikely to be offered
decumulation services and therefore risk making sub-optimal decisions.
124. It is on the basis that savers in small businesses stand to gain in their long-term outcomes
that the inclusion of small businesses is proportional. It protects the equity of savers in small
businesses who would otherwise not be offered decumulation services in their schemes.
125. This measure also delivers a benefit to all small and micro businesses across the economy
through providing more choice of decumulation options in the pension market. This creates
benefits for employers when selecting or switching pension schemes. These benefits are not
captured but could be significant; therefore, reinforcing that the measures are proportionate.
Mitigations
126. There are also a number of mitigations put in place for smaller businesses:
• Micro schemes are out of scope of the new legislation (i.e. where there are less
than 12 members).
• A number of options have been created to limit cost (e.g. transfer arrangements
for smaller schemes).
• Smaller schemes could decide to merge and consolidate into a larger Master
Trust if they cannot deliver for their members. This would result in no cost from
the policy and may better meet their members’ needs.
• Larger schemes are expected to have to implement the policy first, giving time for
smaller schemes.
127. Most of the estimated costs for small schemes are driven by transfer arrangement costs
(£27.2m) to provide the decumulation products. This assumes individual partnering
agreement costs at around £50,000 per small scheme, with further ongoing costs to review
partnerships. Partnering costs are derived from industry discussions, involving survey
responses, roundtables and one-to-one meetings. A further £2.2m is accounted for by the
estimate of training costs (derived from the FCA’s cost-benefit analysis on Investment
Pathways). It is assumed small schemes split the training 75% to 25% between external and
internal training respectively – the commissioning of external training costs £1.9m.
128. In terms of monetised direct benefits to small schemes, it is expected to be negligible; this
is because all small schemes with no current decumulation offering are expected to partner
432
https://webarchive.nationalarchives.gov.uk/ukgwa/20240605050724/https:/www.thepensionsregulator.gov.uk/en/document-
library/research-and-analysis/occupational-defined-contribution-landscape-2023/occupational-defined-contribution-landscape-
2023-annex
433
https://webarchive.nationalarchives.gov.uk/ukgwa/20240605050724/https:/www.thepensionsregulator.gov.uk/en/document-
library/research-and-analysis/occupational-defined-contribution-landscape-2023/occupational-defined-contribution-landscape-
2023-annex
261.
261
with larger schemesto offer their members retirement products. As a result, any charges
accrued from these members will be by the larger schemes. Additionally, the main policy
benefit of staying invested for longer and improved investment returns accrues to members
directly, not businesses.
129. However, there are likely to be significant non-monetised benefits associated with smaller
schemes. It is often not financially viable for smaller schemes to offer decumulation products
to their members, however, the legislation allows transfer arrangements, which was found in
industry engagement to be much more cost-effective for smaller schemes. Arranging for
members to access decumulation solutions will positively impact the profile of smaller
schemes, both to members and employers who arrange for their employees to save with
these schemes. Not offering decumulation solutions risks members being significantly worse
off and having to make complex financial decisions at the point of retirement.
130. Table 26 breaks down the EANDCB calculation for small schemes only – showing an
EANDCB of £3m per year to small schemes. Importantly, members within these small
schemes can be expected to benefit from the legislation and the above has highlighted the
indirect benefits also available to small schemes and businesses that are not scored below.
Table 26: Direct impact on small and micro businesses (EANDCB)
Impact Overview Cost / Benefit to
business
(NPV over 10-
year appraisal)
Costs to small business
One-off costs Familiarisation, Partnering, Training £28.6m
Ongoing costs Reviewing partnerships £2.1m
Total Cost to all small Pension
Schemes
Total one-off and ongoing costs £30.7m
Benefits to small businesses
Benefits to small Pension Schemes Negligible (but members within small
schemes should benefit)
-
EANDCB of £3.6m per year
Wider impacts
131. There are a number of wider benefits and implications from the policy measures which may
arise outlined below.
132. Market consolidation: As a result of the proposal, it is possible many schemes may
decide to consolidate. The DC trust-based market has been consolidating over time with the
number of schemes falling by around 10% each year since 2012434
. This has resulted in a
fall from around 3,700 schemes in 2012 to around 1,100 in 2024. Over the same time period,
the assets held, driven by the rollout of Automatic Enrolment, has been rapidly rising (an
increase of 546% since 2012 to £143bn). Part of the increase has been driven by Master
434
https://webarchive.nationalarchives.gov.uk/ukgwa/20240605050724/https:/www.thepensionsregulator.gov.uk/en/document-
library/research-and-analysis/occupational-defined-contribution-landscape-2023/occupational-defined-contribution-landscape-
2023-annex
262.
262
Trusts (multi-employer pensionfunds), with around 30 Master Trusts accounting for around
three-quarters of DC assets, 90% of DC memberships, and 95% of active savers.
133. It is expected this trend of consolidation will continue. As outlined in DWP’s previous
consultation in 2021435
, consolidation can help ensure all savers are receiving the best
value, through better governance, lower costs and charges, and greater investment
opportunity (helping diversification). Nevertheless, it is important consolidation is done in the
interests of the member and that the wider pensions market continues to have competition
and innovation.
134. The case for consolidation has been explored in detail. DWP have previously explored the
evidence on the potential benefits of DC consolidation and the optimal size of pension
schemes: in a Call for Evidence436
; in the Pension Trends analytical report437
; and in a review
of Master Trusts438
. Across those reports a wide range of evidence has been provided on the
benefits of scale within the pension market. Key benefits include:
• Better governance.
• Economies of scale, with greater size helping to reduce average costs per member.
• The ability to move investment in-house, potentially reducing investment costs.
• Access to a wider range of assets.
• Being able to invest directly in certain assets, rather than needing to be part of a
pooled fund to do so.
• An improved bargaining power, including the ability to pay lower investment fees.
135. This reform may further support consolidation through the additional costs that might arise
(particularly for smaller schemes), however any behavioural effect of schemes cannot be
known in advance. The potential costs and benefits of greater consolidation have been
considered but have not been monetised. This is explored in the overarching Summary IA.
136. Better investments, higher growth and deeper markets: By promoting a greater focus
on decumulation, this should encourage pension schemes to keep pension pots invested
(rather than moving to liquid assets in anticipation of individuals withdrawing them). This can
benefit savers in the first instance through improved compounded returns. However, there
may be further benefits on capital markets and private companies as a second order impact
through larger pools of risk capital becoming available to them and more emphasis being
placed on the diversification benefits these assets pose to investors. These first and second
order effects can indirectly help to boost economic growth, deepen capital markets and
increase the UK’s low investment levels.
137. Pension adequacy: The decumulation legislation aims to provide a sustainable income in
retirement for pensioner members, as opposed to pensioners simply accessing their savings
in cash, which may be accessed at a quicker rate. Default solutions ensure members
continue to receive investment returns on their pot, which may partially offset withdrawals
made. While pension adequacy largely focusses on the accumulation stage and whether
individuals are saving enough up until retirement, a sustainable decumulation solution can
also help to ensure that pension savings are adequate throughout a member’s retirement
journey.
435
https://www.gov.uk/government/consultations/future-of-the-defined-contribution-pension-market-the-case-for-greater-
consolidation/future-of-the-defined-contribution-pension-market-the-case-for-greater-consolidation
436
https://www.gov.uk/government/consultations/future-of-the-defined-contribution-pension-market-the-case-for-greater-
consolidation/future-of-the-defined-contribution-pension-market-the-case-for-greater-consolidation
437
https://www.gov.uk/government/publications/trends-in-the-defined-contribution-trust-based-pensions-market/trends-in-the-
defined-contribution-trust-based-pensions-market#the-potential-benefits-of-consolidation
438
https://www.gov.uk/government/publications/evolving-the-regulatory-approach-to-master-trusts/evolving-the-regulatory-
approach-to-master-trusts
263.
263
138. Innovation inpension investment and decumulation products: It is estimated the
legislation will allow schemes to retain a greater proportion of their membership in
retirement. This may incentivise and provide the platform for schemes to innovate, such as
longevity pooling DC pensions or investing in a wider range of decumulation products.
Schemes may also innovate in their investment strategy, such as investment in non-
traditional assets, which may provide higher yields.
Monitoring and Evaluation
139. Improving retirement outcomes for consumers is of fundamental importance to the
Department and forms the central objective of this policy. Given the costs to industry,
regulators, and government, extensive monitoring and evaluation will be essential focussing
on both those delivering the policy and the consumer impact. The impact on returns, transfer
costs, and wider retirement planning will all be closely monitored and evaluated. DWP plans
to achieve this in a number of ways outlined below.
140. In terms of monitoring and evaluating the implementation process, DWP will aim to:
• Work closely with pensions industry throughout any proposed secondary
legislation, ensuring both schemes and consumers’ views are considered in
developing the detail of the policy.
• Work with pension schemes to understand their experiences of implementation.
This may take the form of informal conversations, as well as more formal, structured
roundtables. This will help understand how schemes are taking a user-centred
design approach effectively and understand the policy impacts on schemes and their
consumers.
• Regularly monitor key industry reports to track implementation. This includes
Corporate Advisor, for example, who report on the largest schemes and their
retirement offerings, including quantitative research from around 20 schemes as well
as qualitative research and analysis of the sector.
• Regularly monitor data such as HMRC’s RTI data and TPR’s DC scheme returns to
look at trends in pension access.
• Explore, with TPR, quantitative surveys to understand readiness, awareness of
the policies, and potential barriers which may be placed through Trustee surveys.
• Explore qualitative research around the motivations and decision-making at
decumulation, to better understand the thought-process behind certain decisions and
the impact of having default decumulation pathways.
• Closely monitor the industry, assessing the emerging default products of the
largest schemes to ensure they are offering the sufficient flexibility and support for
savers.
141. In terms of monitoring and evaluating the policy impact, DWP will aim to:
• Work closely with industry and regulators to enhance data collection on decumulation
product take-up and transfers and monitoring information collected. This will be
crucial in assessing the impact of the changes and the choices consumers make.
• Work closely with TPR to monitor levels of scheme compliance.
• Develop quantitative and qualitative research with members to better understand
consumer impact. For example, how many are taking the default option, how are
individuals using their pension pot, and how is this changing over the course of their
retirement. DWP has already commissioned two waves of Planning and Preparing for
Later Life over the last 5 years, offering unique insights into retirement planning and
access decisions.
• Develop quantitative and qualitative research with providers to understand the
responses to the policy, any emerging challenges, and how providers are innovating.
• Monitor trends in how savers are accessing their pension pot – it is expected
the policy will reduce the number of full cash withdrawals.
264.
264
• Maximise therange of surveys to understand trends, such as Financial Lives
Survey and Family Resources Survey, allowing information on pension pot access to
be closely monitored.
• Conduct a post-implementation review of the proposals. This will particularly
focus on the cost of the regulations, whether DWP may need to be more prescriptive,
and how well the defaults are aligned to saver preferences.
142. In addition, DWP will support this monitoring and evaluation with a wider research
programme which continually monitors pensions take-up, adequacy, engagement and
decumulation. This information will be used to continually assess the impact of the policy
change and whether the benefits to members have been achieved. If throughout this
evaluation any problems are identified, DWP will review the policy to ensure it is delivering
for consumers and the pensions industry.
265.
Error! Unknown documentproperty name.
Title: DC Megafunds
IA No:
RPC Reference No: RPC-DWP-25032-IA(1)
Lead department or agency: DWP
Other departments or agencies:
Impact Assessment (IA)
Date: May 2025
Stage: Final
Source of intervention: Domestic
Type of measure: Primary legislation
Contact for enquiries:
christopher.ellis3@dwp.gov.uk
Summary: Intervention and Options RPC Opinion: Green (fit for purpose)
Cost of Preferred (or more likely) Option (in 2024 prices439
)
Total Net Present Social
Value
Business Net Present
Value
Net cost to business per
year Business Impact Target Status
Qualifying provision
£1,911m £231m -£26m
What is the problem under consideration? Why is government action or intervention necessary?
The Defined Contribution (DC) pensions market is fragmented, with around 900 smaller DC schemes and around 60
multi-employer DC schemes. Alongside other market failures, a principle-agent problem exists, with employers (agent)
choosing the pension scheme for their employees (principal), who bear the risks and reward associated with scheme
selection. Given the fragmented market, and evidence that the main criteria used to select pension schemes are
convenience of enrolment and cost, savers may be enrolled in smaller schemes and miss-out on the benefits of scale.
What are the policy objectives of the action or intervention and the intended effects?
The scale measures aim to build a market of fewer, but larger, multi-employer DC workplace pension schemes,
consequently improving member outcomes. Evidence suggests that scale benefits directly accrue from numerous
sources: A) better governance; B) economies of scale, whereby greater size reduces average costs per member; C)
the ability to move investment in-house, reducing investment costs; D) access to a wider range of assets,
increasing diversification; E) the ability to invest directly in assets, rather than needing to be part of a pooled fund to
do so; F) improved bargaining power, enabling schemes to negotiate lower investment fees, improving net returns.
Alongside these benefits, risks are sought to be mitigated against, including any potential reduction in market competition.
What policy options have been considered, including any alternatives to regulation? Please justify preferred
option (further details in Evidence Base)
Policy option 0: DWP to do nothing - consolidation would continue naturally, though concentrated among the smaller
single employer trusts, meaning the evidence-supported levels of pension scheme scale may not be achieved.
Policy option 1 (preferred): Primary legislation – introduce a minimum AUM threshold of £25bn to be met by 2030, with
time-limited exemptions if scheme scale is at least £10bn, and specific schemes out of scope of the legislation.
Policy option 2: Absence of legislation – utilising statutory guidance. This would fail to have a sufficient policy impact
against the agreed objectives or provide necessary powers to regulate and enforce effectively.
The driving of meaningful consolidation across multi-employer DC workplace pension schemes requires primary
legislation, with existing powers insufficient and statutory guidance ineffective. Consequently, option 1 is preferred.
Will the policy be reviewed? It will be reviewed. If applicable, set review date: May 2030
Is this measure likely to impact on international trade and investment? No
Are any of these organisations in scope? Micro No Small No Medium: Yes Large Yes
What is the CO2 equivalent change in greenhouse gas emissions?
(Million tonnes CO2 equivalent)
Traded: Non-traded:
I have read the Impact Assessment and I am satisfied that, given the available evidence, it represents a
reasonable view of the likely costs, benefits and impact of the leading options.
Signed by the responsible Minister: Date:
439
The aggregated monetised impacts are calculated for a ten-year appraisal period and all costs are given in 2024 prices and use 2025 as the
base year for the present value calculation, as given in the RPC/DBT Impact Assessment Calculator. 2024 prices are sh own because this is
when the Department considered the policy evidence and 2025 is the present value base year as this is when the policy measures – and wider
Pension Schemes Bill – will be implemented or begin to impact the market
266.
Error! Unknown documentproperty name.
Summary: Analysis & Evidence Policy Option 1
Description: Pension Scheme Bill – Primary Legislation to achieve scale in the defined contribution market
FULL ECONOMIC ASSESSMENT
Price Base
Year 2024
PV Base
Year 2025
Time Period
Years 10
Net Benefit (Present Value (PV)) (£m)
Low: £847m High: £2,976m Best Estimate: £1,911m
COSTS (£m) Total Transition
(Constant Price) Years
Average Annual
(excl. Transition) (Constant Price)
Total Cost
(Present Value)
Low £4m 1 £7m £64m
High £4m 1 £18m £167m
Best Estimate £4m 1 £12m £115m
Description and scale of key monetised costs by ‘main affected groups’
All monetised costs are for pension schemes. To ensure understanding of the legislation, there will be
familiarisation costs for all schemes, estimated at £4m. For schemes leaving the market there will be search
costs, where a larger scheme is selected and engaged to consolidate funds into, estimated at £8m (present value).
From transferring those assets, this results in consolidation costs, estimated at £103m (present value).
Other key non-monetised costs by ‘main affected groups’
To members: Members may face indirect costs if the costs incurred by pension schemes are passed-on. However,
this is not expected given the competitiveness of the market and low fees already charged.
BENEFITS (£m) Total Transition
(Constant Price) Years
Average Annual
(excl. Transition) (Constant Price)
Total Benefit
(Present Value)
Low N/A £130m £1,013m
High N/A £389m £3,040m
Best Estimate N/A £260m £2,027m
Description and scale of key monetised benefits by ‘main affected groups’
Lower investment fees, enabled by additional scale, create increased profits for pension schemes (estimated at
£339m present value), with these partially passed-on as lower charges to enable increased net returns for
members (estimated at a further £339m present value). The members transferred into larger schemes also benefit
from the lower charges offered by their new scheme (estimated at £402m present value). Alongside this,
investment diversification facilitated by scale results in additional returns for members (estimated at £939m
present value), with the larger pension pots they build resulting in higher charge revenue being received by pension
schemes (estimated at £7m present value).
Other key non-monetised benefits by ‘main affected groups’
To employers: Given there will be fewer, larger schemes in the market, this should reduce the search cost time
when looking for a new pension provider and give greater certainty on the quality of the provider being chosen.
Key assumptions/sensitivities/risk Discount rate (%) 3.5%
AUM projections: Future AUM values are projected by applying historic growth rates to current AUM values, with
schemes possessing insufficient scale modelled to leave the market and their assets consolidated into larger
schemes. However, estimating growth in AUM is challenging and each provider will see different levels of growth.
Familiarisation and search costs: Costings utilise analysis relating to other proposed private pensions measures
given the similarities of the processes involved.
Consolidation costs: Costings are based on industry consultation responses around transfers of assets. However,
a wide-range of responses were provided, from which an average taken, with responses not providing complete
market coverage.
Diversification benefits: The increased returns from diversification into private markets is informed by Government
Actuary’s Department (GAD) analysis and industry capital market assumptions, with an average taken.
BUSINESS ASSESSMENT (Option 3)
Direct impact on business (Equivalent Annual) £m: Score for Business Impact Target (qualifying provisions
only) £m:
Costs: £13m Benefits: £39m Net: -£26m
267.
267
Evidence Base
Policy Background:
AutomaticEnrolment has led to a large increase in Defined Contribution members
and assets
1. Automatic Enrolment (AE) was first introduced in 2012 and has led to a huge increase in the
number of workplace pension savers, with 88% of eligible employees (over 20m)
participating in a pension. The vast majority of these savers are saving into a Defined
Contribution (DC) workplace pension440
. A DC pension is a pot of money for retirement
which depends upon factors including the amount the individual and employer pay in, the
fund’s investment performance and costs/charges.
2. Workplace pensions are split into three markets:
a) Defined Benefit (DB) – This is a type of pension which pays a retirement income based
on earnings, accrual rate, and length of service, rather than the amount of money an
individual has contributed to the pension. Of which, the market is further split into:
• Public sector DB, where the main funded scheme is the Local Government
Pension Scheme in England and Wales (LGPS) which is made up of 86
Administering Authorities which operated 87 individual funds in 2023/24441
.
• Private sector DB where there were around 5,000 pension schemes in 2024442
.
b) Defined Contribution (DC) – This is a type of pension whereby pension contributions
are made by employees/employers and are invested to create a pension pot at
retirement. The DC market is further split into:
• Trust-based market - A pension scheme governed by a board of trustees who
have a fiduciary duty towards scheme members. The board of trustees manage
investments on the members’ behalf. This is regulated by the Pensions Regulator
(TPR). In 2025, there were around 920 pension schemes with 12 or more
members443
.
• Contract-based market - A pension scheme governed by a provider and an
independent governance committee (IGC) where a contract exists between the
individual scheme member and the provider. This is regulated by the Financial
Conduct Authority (FCA). In 2023, there were estimated to be around 30
firms with an authorised DC workplace pension business444
.
c) Collective Defined Contribution (CDC) – these schemes are an emerging type of
pension scheme based on risk sharing between pension savers. CDCs aim to move the
risk away from the individual (as is the case under Defined Contribution schemes) and
away from the employer (as is the case under Defined Benefit schemes). The only CDC
arrangement in the UK so far is a scheme by the Royal Mail.
3. The vast majority of AE-eligible employees are saving into a Defined Contribution (DC)
workplace pension445
and this market is the focus of this Impact Assessment given this is
where the policy applies. After the Impact Assessment was completed, more recent
440
https://www.gov.uk/government/collections/workplace-pension-participation-and-savings-trends
441
https://www.gov.uk/government/statistics/local-government-pension-scheme-funds-for-england-and-wales-2023-to-
2024/local-government-pension-scheme-funds-for-england-and-wales-2023-to-2024
442
https://www.ppf.co.uk/Purple-Book
443
https://www.thepensionsregulator.gov.uk/en/document-library/research-and-analysis/occupational-defined-contribution-
landscape-2024
444
https://www.fca.org.uk/publications/consultation-papers/cp24-16-value-for-money-framework
445
https://www.gov.uk/government/collections/workplace-pension-participation-and-savings-trends
268.
268
information on theDC landscape became available. The contextual and background
information within the IA has been updated to reflect the latest information. However, it is
important to note the calculations are using the previous years’ worth of data. The changes
in the landscape are in line with expectations and therefore it would not materially change
the cost or benefits of the policies.
4. Overall, it is estimated there are around £300bn and 5m active savers in the contract-based
DC market446
, and £200bn and 11m active savers in the DC trust-based market447
. Data is
more readily available on the trust side, which has a much greater number of schemes448
.
5. The DC-trust landscape is growing in scale and maturing quickly with 30.6 million DC
memberships449
in 2025, an increase of 6% since 2024. DC trust workplace pension assets
have grown to £205 billion, increasing from only £22 billion in 2012450
.
6. There are three main types of pension scheme in the DC market:
• Master Trusts – an occupational pension scheme that provides DC pensions for two or
more unconnected employers (though often a lot more).
• Single Employer Trusts (SETs) – pension schemes which are managed for and on
behalf of a single employer or two or more legally connected employers.
• Group Personal Pensions (GPPs) – DC contract-based schemes which are regulated
by the FCA.
7. AE has led to more people saving into a pension. However, inertia is strong and
engagement is low. For example, 47% have not reviewed how much their pension is worth in
the last 12 months451
and over 94% of pension savers are invested in a pension scheme’s
default investment strategy452
. This highlights the importance of government intervention,
where appropriate, to deliver outcomes for members who may not otherwise engage with
their pension.
Regulation and types of DC pensions
8. DC pension schemes are either personal or occupational pensions. They can be workplace
pensions arranged by an employer or private pensions arranged by an individual; the scale
measures focus on workplace pension schemes. Regulation of the pensions industry in the
UK is split between the FCA and TPR:
i) FCA regulates personal pensions, including workplace personal pensions (contract-
based pension schemes).
ii) TPR regulates occupational pensions (trust-based pension schemes).
Current Trends in Scale and Consolidation
9. The DC market has been consolidating, with the number of pension schemes reducing from
around 3,700 in 2012 to around 950 schemes now. In the trust-based market, over the last
446
https://www.fca.org.uk/publication/consultation/cp24-16.pdf
447
https://webarchive.nationalarchives.gov.uk/ukgwa/20240605050724/https:/www.thepensionsregulator.gov.uk/en/document-
library/research-and-analysis/occupational-defined-contribution-landscape-2023/occupational-defined-contribution-landscape-
2023-annex
448
https://www.gov.uk/government/publications/trends-in-the-defined-contribution-trust-based-pensions-market/trends-in-the-
defined-contribution-trust-based-pensions-market
449
‘Memberships’ is used throughout this IA. This more closely represents the number of DC pots - the number of
members/savers is not knowable given an individual may have multiple pots with different providers.
450
https://www.thepensionsregulator.gov.uk/en/document-library/research-and-analysis/occupational-defined-contribution-
landscape-2024/occupational-defined-contribution-landscape-2024-annex
451
https://www.fca.org.uk/publication/financial-lives/fls-2022-pensions.pdf
452
https://www.thepensionsregulator.gov.uk/en/document-library/research-and-analysis/occupational-defined-contribution-
landscape-2024
269.
269
three years therehas been an average decline in schemes of around 12% per year, which if
maintained would leave under 500 schemes in 2030. This projection is shown in Figure 1
below.
Figure 1: Count and forecast of trust-based DC pension schemes (including hybrid
schemes453
, excluding micro schemes454
)
Source: DWP analysis of TPR data (455
)
10. Of these schemes, around 900 are single employer trusts, traditionally set-up by employers
to support their workforce. However, as AE resulted in all employers needing to enrol their
employees (where eligible) into a workplace pension, there has been a rise in Master Trusts
(multi-employer pension schemes). Across around 30 schemes, these now account for 91%
of total memberships, 90% of active memberships and 81% of assets in the DC trust market.
In addition, there are around 30 GPPs, which operate in the DC contract market. Across
those two markets, there are now 7 DC schemes managing over £25bn worth of assets,
where economies of scale are most apparent enabling schemes to access a wider range of
asset classes, negotiate lower fees and improve their governance456
. A more detailed
breakdown is shown in Table 1 below.
453
“Hybrid schemes” are pension schemes with both a defined contribution (DC) section and a defined benefit (DB) section.
For more information see: https://www.thepensionsregulator.gov.uk/en/document-library/research-and-analysis/occupational-
defined-contribution-landscape-2023
454
“Micro schemes” are pension schemes with 2-11 members. For more information see:
https://www.thepensionsregulator.gov.uk/en/document-library/research-and-analysis/occupational-defined-contribution-
landscape-2023
455
DWP analysis of TPR data: https://www.thepensionsregulator.gov.uk/en/document-library/research-and-
analysis/occupational-defined-contribution-landscape-2024
456
Corporate Adviser 2024 MT GPP Default Report (https://corporate-adviser.com/research/)
0
500
1,000
1,500
2,000
2,500
3,000
3,500
4,000
2012 2014 2016 2018 2020 2022 2024 2026 2028 2030
Forecast
270.
270
Table 1: DCPension assets, schemes and members
Type Number Assets Active Members
Master Trust 30 £166bn 10m
Single Employer Trust 890 £39bn 1m
GPP 30 £300bn 5m
Sources: Master Trust and Single Employer Trust statistics taken from TPR data (457
); GPP statistics
taken from FCA data (458
)
11. Of the consolidation that has occurred, this has been concentrated within smaller schemes
(single employer trusts), as is illustrated in Figure 2 below. For employers, use of an external
provider rather than administering their own pension scheme may limit costs, with the
competitive pricing and investment expertise offered by multi-employer schemes enabling
them to offer a more attractive benefits package to their employees459
. Within the larger
multi-employer schemes, to which the scale legislation is restricted, consolidation hasn’t
occurred as readily. For these schemes, while they continue to make a profit they are
incentivised to continue operating.
Figure 2: Count of trust-based DC pension schemes by scheme size (including hybrid
schemes, excluding micro schemes)
Source: DWP analysis of TPR data (460
)
457
Statistics taken from the following: https://www.thepensionsregulator.gov.uk/en/document-library/research-and-
analysis/occupational-defined-contribution-landscape-2024/occupational-defined-contribution-landscape-2024-
annex#2cadb7378e6842aba1d92088878d2fa8
458
Statistics taken from the following: https://www.fca.org.uk/publication/consultation/cp24-16.pdf
459
https://www.hymans.co.uk/insights/5-reasons-to-consider-moving-to-a-dc-master-trust
460
DWP analysis of TPR data: https://www.thepensionsregulator.gov.uk/en/document-library/research-and-
analysis/occupational-defined-contribution-landscape-2024
0
500
1,000
1,500
2,000
2,500
2012 2013 2014 2015 2016 2017 2018 2019 2020 2021 2022 2023 2024 2025
100 to 999
1,000 to 4,999
5,000+
12 to 99
271.
271
Industry has beenengaged throughout the development of the scale measures
12. On 20 July 2024, the Chancellor announced a Pensions Review461
, the first phase of which
focussed on exploring new ways of boosting investment in the UK, increasing saver returns
and tackling waste in the pensions system. One of four specific areas highlighted was
“driving scale and consolidation of defined contribution workplace schemes”. This built on
the Labour manifesto commitment for workplace pensions to take advantage of
consolidation and scale462
.
13. DWP was already engaging extensively with industry on consolidation and scale across
several other key policy reforms, including the Value for Money (VfM) framework. This was
designed to ensure pension schemes had sufficient scale to maximise investment
opportunities.
14. The review launched a Call for Evidence on 4 September 2024463
, collaborating with
industry to develop its analysis and policy options. A wide range of external viewpoints were
considered, including from employers, trade unions, the pensions industry, financial
services, local government, and consumer voices.
15. Using this feedback, DWP and HMT launched a policy consultation ‘’Pensions Investment
Review: Unlocking the UK pensions market for growth” on 14 November 2024 to 16 January
2025464
. This sought views on policy proposals to limit multi-employer DC schemes used for
AE to a maximum number of defaults and that those defaults should operate at a minimum
size. Alongside the consultation, research and analysis into “Pension fund investment and
the UK economy” was published465
.
Pension Provider Structures
16. One area where engagement has been extremely valuable, utilising industry expertise, is
to better understand the structure of pension providers.
17. Considering multi-employer DC schemes, being Master Trusts and GPPs, there are some
providers who offer both types of schemes. Alongside this, there are many providers who
offer solely a Master Trust, with a limited number of providers offering only a GPP.
18. There are a several different levels at which you can analyse the scale of pension
providers. These include:
• Provider – The AUM across the entire business, including non-pension assets, though
economies of scale at this level are not necessarily being fully accessed by pension
schemes.
• Product – This is either a GPP or Master Trust.
• Arrangement – This is the level at which contributions are collected, with investment
expertise utilised to set the strategy for how these contributions are invested.
• Fund – Funds are the building blocks used to deliver the investment strategy, each
consisting of a portfolio of investments.
19. Figure 3 below illustrates the structure of an example provider that offers both a Master
Trust and a GPP.
461
https://www.gov.uk/government/news/chancellor-vows-big-bang-on-growth-to-boost-investment-and-savings
462
https://labour.org.uk/wp-content/uploads/2024/06/Change-Labour-Party-Manifesto-2024-large-print.pdf
463
https://www.gov.uk/government/calls-for-evidence/pensions-investment-review-call-for-evidence
464
https://www.gov.uk/government/consultations/pensions-investment-review-unlocking-the-uk-pensions-market-for-
growth/pensions-investment-review-unlocking-the-uk-pensions-market-for-growth
465
https://www.gov.uk/government/publications/pension-fund-investment-and-the-uk-economy/pension-fund-investment-and-
the-uk-economy#executive-summary
272.
272
Figure 3: Structureof a representative Pension Provider offering both a Master Trust
and GPP
Source: Diagram produced by HMT
20. Despite the example given in the prior diagram, consultation responses from the Pensions
Investment Review illustrated there is large variation in structures. For example, there was
shown to be large variation in terms of the number of funds per arrangement:
• For some schemes, many funds sit beneath many arrangements. For example,
where schemes have several default arrangements which each utilise a different
combination of building block funds.
• For some schemes, there are a limited number of funds per arrangement. For
example, where there are two default funds used by a scheme’s default arrangement.
• For schemes utilising more intricate lifestyling (where the risk profile of portfolios is
adjusted given the proximity of a member to retirement), there can be many funds per
arrangement.
• Generally, Master Trusts appear to have fewer funds per arrangement than GPPs.
21. Alongside there being variation in terms of the number of funds per arrangement, there
was also large variation in the number of default arrangements themselves. Though not a
universal rule, GPPs also tended to have more default arrangements, with some having
hundreds. By contrast, there were examples of Master Trusts with tens of billions of pounds
of AUM within a single default arrangement. This finding reflects that GPPs have generally
been around longer than Master Trusts and having negotiated specific arrangements with
employers over an extended period.
22. For the providers offering both a Master Trust and a GPP, the policy consultation asked
whether their default arrangements and default funds are the same across both of their
273.
273
offerings. Most ofthese providers confirmed that these defaults are identical, and
consequently investment performance across offerings is the same, though pricing can differ
at the employer level. It was argued that close alignment between offerings enables
providers to access economies of scale.
23. The consultation also asked whether scale should be set at the fund or arrangement level.
Feedback was strongly in favour that interventions should be considered at the default
arrangement level rather than fund level, as this is the level at which key decisions are
made.
Implementation of industry feedback when designing the policy
24. The policy consultation466
sought views on proposals designed to increase scale in the DC
workplace pension market, including that multi-employer DC schemes should operate at a
minimum level of scale. No exact minimum AUM threshold was proposed, though evidence
was provided regarding the benefits that arise at £25bn-£50bn, and that no such
requirement would apply before 2030 at the earliest.
25. Feedback recognised the benefit of scale but argued a lower scale requirement would be
more appropriate, reflecting potential industry capacity issues, with any such requirements
preferably phased-in over a longer period. It was also agreed any requirements should be
set at the default arrangement level.
26. Consequently, after listening to feedback to the consultation, as well as the wider evidence
base, the proposal has been adapted, with the key components of the proposed legislation
being:
• Multi-employer DC workplace pension schemes must have at least one default
arrangement with £25bn AUM by 2030.
• Schemes with at least £10bn AUM in a default arrangement by 2030 can apply to be
on a ‘transition pathway’, allowing them to continue operating in the AE market
providing they meet certain requirements, including a credible plan to grow that
arrangement to at least £25bn AUM by 2035.
• Certain schemes are out of scope for the legislation (with further details included later
in the Impact Assessment).
27. The proposed legislation is restricted to multi-employer DC workplace schemes, of which
there are around 60. Figure 4 shows AUM at year-end 2023 across the multi-employer DC
schemes for which such data is available (45 schemes) 467
, with the £25bn minimum AUM
threshold also shown. Given the additional contributions and investment growth that will
occur before 2030, the number of schemes with AUM above this threshold is projected to
increase substantially, as is explored later in this Impact Assessment. The very large range
in scale across schemes can be seen, with many schemes operating with limited scale. For
the schemes for which AUM data was unavailable, industry engagement and older data
sources confirm low levels of AUM. Though scheme names are excluded from the chart
given the commercial sensitivities present, it should be noted that AUM figures for some of
the GPPs may also include personal pensions. Given that the policy is restricted to
workplace pensions, some AUM values may therefore appear slightly inflated.
466
https://www.gov.uk/government/consultations/pensions-investment-review-unlocking-the-uk-pensions-market-for-
growth/pensions-investment-review-unlocking-the-uk-pensions-market-for-growth
467
Alongside the schemes with known AUM values, industry engagement and older data sources confirm that there are
around a further 15 multi-employer DC schemes. These are very small GPPs, generally those where members are not actively
contributing into their pension pots, with low levels of AUM relative to the rest of the market (for which a more accurate AUM
picture is known).
274.
274
Figure 4: AUMacross multi-employer DC schemes at year-end 2023 (for schemes with
available data)
Sources: AUM figures are mainly taken from the Go Pensions “DC Master Trust League Tables”
(468
) and CAPA data (469
), though these are supplemented with additional information from Chair
Statements and individual scheme documentation.
Rationale for intervention and intended effects
28. Research and analysis into “Pension fund investment and the UK economy” was
published470
alongside the joint policy consultation on 14 November 2024. This included a
detailed exploration of the evidence relating to the scale of pension funds using national and
international evidence; this informs the Impact Assessment.
29. There are market failures, with intervention therefore required to enable greater levels of
consolidation. In particular:
• Principal-Agent problem – This exists as savers (principal) bear all the risks and
reward, but the choice of scheme is made by the employer (agent). These incentives
can be, and often are, misaligned, with the employer commonly choosing a pension
scheme based on cost rather than performance471
. Employers are also unlikely to
switch or change schemes. Evidence472
from the DWP employer survey showed only
5% of employers with a DC pension scheme had switched to a different scheme, with
their main criteria when selecting a scheme being convenience of enrolment and cost,
not overall value for money. Employees are often not incentivised to switch the scheme
chosen by their employer, given low engagement and information. They may also risk
losing employer contributions if they do so, as employers are not required to contribute
to pensions that they have not enrolled their employees into. As a result, savers may be
468
https://go-group.co.uk/dc-master-trust-league-table-2024-h2/
469
https://capa-data.com/younger-saver-30-years-to-retirement-5-year-annualised-line/
470
https://www.gov.uk/government/publications/pension-fund-investment-and-the-uk-economy/pension-fund-investment-and-
the-uk-economy#executive-summary
471
https://view.officeapps.live.com/op/view.aspx?src=https%3A%2F%2Fassets.publishing.service.gov.uk%2Fmedia%2F65005
83c57e884000de12968%2Fdwp-employer-survey-2022-data-tables.xlsx&wdOrigin=BROWSELINK
472
See table 7.3 and 7.4: https://www.gov.uk/government/publications/department-for-work-and-pensions-employer-survey-
2022/department-for-work-and-pensions-employer-survey-2022-research-report#pensions
£0bn
£10bn
£20bn
£30bn
£40bn
£50bn
£60bn
£70bn
£80bn
£90bn
£100bn
£110bn
Multi-Employer DC Schemes
£25bn
275.
275
enrolled in smallerpension schemes, missing out on the benefits that scale can bring
across investments, costs and services. There are clear and notable examples of
schemes not operating at scale, delivering high costs and lower investment
performance. This has a detrimental impact to members.
• Positive externalities – The measure aims to build a pension market with fewer, but
larger, pension schemes. Consequently, these schemes would have greater capability
to invest in more illiquid and productive assets, including infrastructure and other
private market assets. These investments are more likely to be UK-based when
compared to other asset classes, such as listed equities. As a result, pension funds that
increase their allocations to these assets may generate spillover and positive
externalities to the UK economy. These benefits include crowding in further investment,
supporting start-up businesses to scale up, improving key infrastructure services and
helping capital markets function more efficiently473
.
• Imperfect Information – There is imperfect information regarding the scale of pension
schemes across the market, with no single source for this information. Employers may
be unaware of the benefits scale may provide to them or their employees. As a result,
the DC marketplace remains fragmented with a large number of schemes on offer and,
as explained by the Office of Fair Trading (OFT)474
, there is a very weak demand side
which would drive competition and scale by itself.
• Member benefits – There are a range of benefits (discussed in more detail below)
which can arise through schemes having additional scale. However, given the low
levels of engagement with pensions by employers and savers, these may be missed or
unknown. Government interventions to ensure pension schemes have scale may result
in members growing larger pension pots, improving retirement income adequacy.
• Protecting confidence in pension savings and financial stability – To protect
confidence in pensions saving, it is important that all pension schemes have the highest
standards of governance in place. This is more likely to be achieved at scale, with a
smaller market enabling easier regulation. This would allow regulators to have greater
oversight, requiring relationships to be built with a smaller number of schemes across
the market.
30. The most notable benefit, and aim, of the legislation is to drive consolidation and build
scale. The case for consolidation has been explored in detail. DWP have previously explored
the evidence on the potential benefits of DC consolidation and the optimal size of pension
schemes: in a Call for Evidence475
; in the Pension Trends analytical report476
; and in a
review of Master Trusts477
. Across those reports a wide range of evidence has been
provided on the benefits of scale within the pension market. Key benefits include:
• Better governance.
• Economies of scale, with greater size helping to reduce average costs per member.
• The ability to move investment in-house, potentially reducing investment costs.
• Access to a wider range of assets.
473
https://www.gov.uk/government/publications/pension-fund-investment-and-the-uk-economy/pension-fund-investment-and-
the-uk-economy
474
https://webarchive.nationalarchives.gov.uk/ukgwa/20131101164215/http:/www.oft.gov.uk/shared_oft/market-
studies/oft1505
475
https://www.gov.uk/government/consultations/future-of-the-defined-contribution-pension-market-the-case-for-greater-
consolidation/future-of-the-defined-contribution-pension-market-the-case-for-greater-consolidation
476
https://www.gov.uk/government/publications/trends-in-the-defined-contribution-trust-based-pensions-market/trends-in-the-
defined-contribution-trust-based-pensions-market#the-potential-benefits-of-consolidation
477
https://www.gov.uk/government/publications/evolving-the-regulatory-approach-to-master-trusts/evolving-the-regulatory-
approach-to-master-trusts
276.
276
• Being ableto invest directly in certain assets, rather than needing to be part of a
pooled fund to do so.
• An improved bargaining power, including the ability to pay lower investment fees.
31. These benefits can also be linked to potential changes in pension funds’ asset allocations,
with associated economic and growth impacts. For example, having the scale to bring
investment expertise in-house and to negotiate lower investment fees may allow more scope
to invest in typically more expensive asset classes and private markets. Similarly, having the
scale to diversify investment and to be able to invest directly should allow greater access to
a wider range of asset classes. This is particularly true of asset classes that are shown to
have a high (theoretical or empirical) impact on growth, such as infrastructure.
32. There is some evidence to support the existence of a good governance premium,
particularly in DB pension schemes. For example, research478
by the PPI attempts to
quantify a ‘governance premium’. That research references academic studies479
across
international pension schemes that identify a correlation between the features of better
governance structures and sustained long-term performance.
33. There are, however, potential disadvantages and challenges480
for pension schemes in
reaching a large scale, as measured by AUM. For example:
• Investment difficulties, including the ability to find attractive assets to invest in that
are large enough. This risk is particularly pronounced in the less liquid asset classes.
• Costs can go up, at least in the short-term, due to investing in more expensive asset
types over sustained periods and the cost of bringing more expertise in-house.
• Concentration and competition risks if there are too few schemes holding a large
proportion of assets.
34. The evidence linking pension scheme scale and gross investment returns is mixed. DWP
analysis of CAPA data, as shown in Figure 5, shows weak correlation between the asset
size of Master Trusts / GPPs and five-year gross investment performance. However, this is
based on a small sample of schemes. Across the AUM spectrum, there are examples of
small, medium and large-sized schemes with both high and low gross returns.
478
https://www.pensionspolicyinstitute.org.uk/media/t2djkxca/201702-bn89-db-the-role-of-governance.pdf
479
https://www-2.rotman.utoronto.ca/icpm/2.pdf, https://ux-tauri.unisg.ch/RePEc/usg/sfwpfi/WPF-1623.pdf and
https://mckellinstitute.org.au/wp-content/uploads/2022/02/McKell_Super_A4_WEB.pdf
480
https://www.gov.uk/government/publications/trends-in-the-defined-contribution-trust-based-pensions-market/trends-in-the-
defined-contribution-trust-based-pensions-market#the-potential-benefits-of-consolidation
277.
277
Figure 5: UKDC pension schemes, assets under management (AUM) by annualised
gross returns for younger savers over the last 5 years
Source: DWP calculations of Corporate Adviser MT/GPP Default Report 2024 and Q22024 Returns
35. International evidence also seems inconclusive on the benefits of scale on gross
investment returns481
with any benefit in returns through greater scale often being driven by
lower costs (which improve net returns) due to being able to negotiate lower prices or
conducting investment in-house.
36. There are also examples of smaller schemes, including single employer trusts, who are
delivering good outcomes for their members. Some single employer trusts may offer higher
pension contributions or other guarantees for members. Some single employer schemes are
quite large or may be able to benefit from the expertise of their wider business. For example,
HSBC and J.P. Morgan both run their own DC pension scheme for their employees. Given
their wider financial expertise, they may be able to access similar investment opportunities to
larger pension schemes; for example, J.P. Morgan482
reported 6% of their £6bn pension
scheme is invested in unlisted equities.
37. Therefore, the evidence on the relationship between pension scheme scale and gross
investment returns is mixed. However, as is explored later in the Impact Assessment, there
is evidence that scale can provide diversification benefits through investment into wider
classes, enabling higher risk-adjusted returns. Also, it should be noted that the evidence
presented on the relationship between returns and scale, including the DWP analysis of
CAPA data, has been restricted to analysis of gross returns rather than net returns.
481
For example,
https://www.mckinsey.com/~/media/McKinsey/Industries/Private%20Equity%20and%20Principal%20Investors/Our%20Insight
s/Is%20big%20really%20beautiful%20The%20limits%20of%20pension%20consolidation/Is-big-really-beautiful-the-limits-of-
pension-consolidation.ashx; https://www.ft.com/content/2bea3268-c73d-45a9-b7b0-cd5c33229466; Does Size Benefit Super
Fund Members - Lawrence and Warren (24 March 2023) (theconexusinstitute.org.au); and
https://www.apra.gov.au/sites/default/files/2023-
06/Drivers%20of%20performance%20-%20APRA%20paper%20for%20MMF%20conference%20Feb%202023.pdf
482
https://epa.towerswatson.com/doc/JMC/pdf/jpmuk-pension-plan-chairs-statement--.pdf
0%
2%
4%
6%
8%
10%
12%
14%
£0bn
£20bn
£40bn
£60bn
£80bn
£100bn
£120bn
Bundled DC Assets Gross Return (5yr:
30yrs From SPA
Providers
Assets
5-yr annualised return
(youngersaver)
278.
278
Evidence on benefitsof scale
38. A review of the evidence of scale on pension schemes indicates that benefits can take
effect at a range of different levels, with no clear consensus on the right ‘optimal’ level of
assets. This will depend on which benefits are being considered. Some reports suggest
economies of scale (in terms of costs and charges) begin, and even peak, at low levels,
such as for schemes with assets in the low hundreds of millions of pounds. Other analysis
indicates that scale benefits continue for schemes with a higher level of assets, and that new
advantages arise at this level.
39. Nevertheless, studies tend to suggest broadly around £25-£50 billion may give a wide-
range of benefits (see Table 2 below). However, there is further evidence which indicates
advantages to scale that can only be realised by pension schemes with an even greater
level of assets (£50bn or more). As discussed below, the benefits seen at these higher levels
tend to be around investment capability. This capability may mean pension schemes have a
greater ability to invest in asset classes that have been linked to having a potentially higher
impact on economic growth.
Scale benefits at a lower level (below £25bn AUM)
40. There is evidence from TPR which shows that there are benefits of scale in terms of
scheme governance. One example is research from 2019483
showing a strong positive
correlation between scheme size and the number of key governance requirements being
met. Only 12% of micro schemes (2-11 members) and 15% of small schemes (12-99
members) met two or more applicable requirements. This contrasted with large schemes
(1000+ members) where 84% were meeting two or more applicable requirements, as were
all Master Trusts.
41. This is supported by TPR research published in 2023484
which showed that 78% of Master
Trusts and 53% of large schemes met the requirement for trustee boards to assess the
extent member-borne charges and transaction costs provide good value for money.
However, only 45% of medium and less than 20% of small/micro schemes met this
requirement.
42. This evidence supports the fact that larger pension schemes may be able to offer better
governance than smaller schemes. As this better governance seems to start for schemes
with 1,000 or more members, it could be that governance scale benefits are most apparent
for schemes with hundreds of millions of pounds in assets under management.
43. DWP research485
has shown that larger pension schemes have lower charges, being well
below the current charge cap of 0.75%. For example, Master Trusts had an average charge
of 0.48%; though this fell to 0.40% for larger Master Trusts. There was a similar pattern for
both Contract-based schemes and other (non-Master Trust) trust-based schemes.
44. This is further supported by PPI international research486
on value for money in pension
schemes. Its analysis of the Netherlands found, once a scale of £0.5bn was reached, the
impact of scale on reducing charges is negligible. It also found that in the US significant
reductions in charges level-off for pension schemes of around US$500m (about £400m).
45. Similarly, a study by the Australian Prudential Regulation Authority (APRA)487
looked at
economies of scale in Australian pension funds and found that estimated efficiencies peak
483
https://webarchive.nationalarchives.gov.uk/ukgwa/20200102111009mp_/https:/www.thepensionsregulator.gov.uk/-
/media/thepensionsregulator/files/import/pdf/dc-research-summary-report-2019.ashx
484
https://www.thepensionsregulator.gov.uk/-/media/thepensionsregulator/files/import/pdf/dc-trust-based-pension-schemes-
research-report-2022.ashx
485
https://www.gov.uk/government/publications/pension-charges-survey-2020-charges-in-defined-contribution-pension-
schemes/pension-charges-survey-2020-charges-in-defined-contribution-pension-schemes
486
https://www.pensionspolicyinstitute.org.uk/media/o52aoucb/20211118-value-for-money-final.pdf
487
https://www.apra.gov.au/sites/default/files/2023-
06/Drivers%20of%20performance%20-%20APRA%20paper%20for%20MMF%20conference%20Feb%202023.pdf
279.
279
for funds belowAus$1bn (about £0.5bn). Analysis by CEM Benchmarking488
shows that
pension funds with more than US$10bn (about £8bn) in assets have consistently delivered
returns significantly higher than smaller funds with under US$1bn (about £0.8bn).
Scale benefits at a medium level (£25bn-£50bn)
46. However, there is also evidence that scale benefits for pension schemes exist at a higher
level of assets. For example, the previously mentioned study by APRA489
also finds pension
funds between Aus$32bn and Aus$100bn (about £16bn to £50bn) are still achieving scale
benefits. Similarly, another APRA research report490
found funds with assets of more than
Aus$50bn (about £25bn) can more easily spread their costs over a wider membership base
to keep their fees lower.
47. The PLSA491
reported larger schemes, those with £25-£50 billion of assets, have
considerable governance capability and find it easier to invest directly, or alongside others,
in productive finance. In the recent Pensions Review Call for Evidence492
, the PLSA also
said that: “Based on PLSA member feedback, as AUM reach c.£20 billion schemes can start
to co-invest in private markets; above this, schemes can invest directly and may increasingly
use in-house investment. Above c£100 billion benefits of scale increase more slowly. Data
from CEM highlights that a typical £1 billion fund invests 11% in private markets; a £20
billion fund invests 20%; and a £100 billion fund invests 23%”.
48. Conexus Institute493
explored Australian pension schemes of A$50bn-A$100bn (about
£25bn-£50bn) and beyond. It concludes there are advantages, disadvantages and
significant challenges from such scale, and that ensuring funds are configured to succeed at
scale is the key issue. The key advantages they find include:
• Reduced costs through internal investment management.
• Scale economies in administration.
• Greater scope to offer customised member services.
• Increased ability to invest effectively in private market assets.
Scale benefits at a higher level (£50bn+)
49. There are some scale benefits identified for even larger pension schemes. For example,
the Conexus Institute report494
also finds some important advantages for very large funds of
A$100bn+ (about £50bn+). These include:
• An even higher proportion of assets can be managed internally, further reducing costs.
• Larger mandates with external managers which can attract a lower fee rate.
488
https://hub.cembenchmarking.com/hubfs/PDFs/Research%20Downloads/R-36-
A%20Case%20For%20Scale%20February%202022%20Final.pdf
489
https://www.apra.gov.au/sites/default/files/2023-
06/Drivers%20of%20performance%20-%20APRA%20paper%20for%20MMF%20conference%20Feb%202023.pdf
490
https://www.apra.gov.au/sites/default/files/2022-
03/Technical%20paper%20-%202021%20Heatmaps%20-%20Sustainability%20of%20member%20outcomes.pdf
491
https://www.plsa.co.uk/Portals/0/Documents/Policy-Documents/2023/PLSA-policy-position-on-pensions-and-growth-
October-2023.pdf
492
https://www.plsa.co.uk/Portals/0/Documents/Policy-Documents/2024/Pensions-Review-PLSA-response-to-call-for-
evidence-sept-2024.pdf
493
https://theconexusinstitute.org.au/wp-content/uploads/2023/03/Does-Size-Benefit-Super-Fund-Members-24-March-
2023.pdf
494
https://theconexusinstitute.org.au/wp-content/uploads/2023/03/Does-Size-Benefit-Super-Fund-Members-24-March-
2023.pdf
280.
280
• The opportunityto exploit potentially attractive investments not readily accessible at
smaller size.
• Ability to invest directly (rather than through pooled structures).
• Greater capability (and need) to invest overseas and have an overseas presence.
Though a challenge and entailing expensive upfront costs, this can bring advantages
such as diversification benefits, building local knowledge, boosting organisational skills
and intellectual diversity.
50. New Financial495
has also argued that a more concentrated market of pension super trusts,
with around £50bn of assets each, would be enabled to invest in a broader range of assets
in the long-term interest of their members, by economies of scale, wider investment
horizons, and increased professionalisation.
51. The Ministry for Housing, Communities and Local Government (MHCLG) previously
explored496
asset pooling within the LGPS and concluded the benefits of scale are present in
the £50bn-£75bn range and may improve as far as £100bn. This is due to improved
bargaining power with asset managers, access to a wider set of opportunities such as
private markets and enabling build of internal capacity.
52. Similarly, a report by NMG Consulting497
looked at how LGPS pools could learn from the
experiences of global peers. This found that the benefits of scale are improved long-term
performance after fees, better control over - and better choice of - assets, and reduced
investment costs. This is due to both greater ability to negotiate external fees down and by
bringing more investment in-house. This included the finding that economies of scale began
once a pool hits US$100bn of assets (about £80bn).
53. Analysing Australian Superfunds, J.P. Morgan describe498
how the largest funds are
managing more of their portfolios in-house, and that this drives down investment costs. It
also notes that two very large funds, Hostplus (which has over £50bn in assets) and
Australian Retirement Trust (which has over £100bn in assets) had not yet insourced as they
felt their size allowed them to negotiate lower fees with asset managers.
Scale and economic growth
54. The reports summarised above suggest a clear link between scale among pension
schemes and the ability to diversify investments. This particularly seems to be the case for
investment into private market asset classes. As pension schemes reach £25bn-£50bn
some investment starts to be brought in-house, with the scale also allowing more funds to be
allocated to these asset classes. As pension schemes reach £50bn or more, the scale can
also help with direct investment and negotiating lower investment fees.
55. There are also examples from the UK where very large pension schemes have used their
scale to negotiate lower investment fees, to invest in private markets and to invest directly
(rather than through pooled structures). For example, Nest499
advanced investments in
private markets as they reached £30bn. Nest500
have also made the case for scale leading
495
https://9075c432-8d38-4fcf-8025-d4433c9ea618.usrfiles.com/ugd/9075c4_22f4e62752ea4c3caa411ab4b66285c7.pdf
496
https://www.gov.uk/government/consultations/local-government-pension-scheme-england-and-wales-next-steps-on-
investments/local-government-pension-scheme-england-and-wales-next-steps-on-investments
497
https://www.brunelpensionpartnership.org/wp-content/uploads/2021/09/LGPS-in-the-UK-Learnings-from-International-
Peers.pdf
498
https://www.jpmorgan.com/content/dam/jpm/cib/complex/content/markets/futue-of-
superannuation/How_Australian_Asset_Owners_Became_Asset_Managers.pdf
499
https://www.ipe.com/nest-advances-into-private-markets-as-aum-reach-30bn/10066861.article
500
https://www.ipe.com/analysis/viewpoint-opportunities-for-investing-in-uk-economic-growth-is-aligned-with-trustees-fiduciary-
duty/10075588.article?adredir=1
281.
281
to “stronger negotiatingconditions” when making these investments. Similarly, the larger
LGPS pools have reported501
being able to invest directly in private markets, reducing costs.
In DWP analysis of UK pension fund investment502
, there is evidence that private market
asset classes may have a positive impact on economic growth. Therefore, greater scale
among UK pension schemes could, through greater investment in these asset classes, lead
to higher economic growth. In addition to this, there is evidence that if scale can reduce
costs and improve member outcomes, that this could lead to increases in the amount that
pension scheme members have to spend upon retiring. Some international evidence503
points to this leading to higher economic growth.
Summary of evidence
56. Table 2 summarises the potential benefits from scale, as well as the AUM size the
evidence points towards to achieve this. Although there is not one single estimated optimal
size, the evidence does point towards £25-50bn as a level where many benefits could be
achieved.
501
https://www.gov.uk/government/consultations/local-government-pension-scheme-england-and-wales-next-steps-on-
investments/local-government-pension-scheme-england-and-wales-next-steps-on-investments
502
https://www.gov.uk/government/publications/pension-fund-investment-and-the-uk-economy/pension-fund-investment-and-
the-uk-economy#executive-summary
503
https://www.calpers.ca.gov/about/organization/facts-at-a-glance/economic-impacts-pensions-california-fy-2022-23
282.
282
Table 2: Summarisingthe emerging evidence against asset size required to achieve
different benefits relating to scale
Aspect of Scale AUM size required to
achieve scale benefit
References
Governance £100m’s TPR 2019504
TPR 2023505
Economies of scale £100m’s APRA 2023506
Pension Charges survey 2020507
PPI 2021508
Better Governance £25bn-£50bn Conexus Institute 2023509
PLSA 2023510
Further scale benefits £25bn-£50bn APRA 2022511
APRA 2023506
Conexus Institute 2023509
In-house investment £25bn-£50bn Conexus Institute 2023509
Access to wider range of
assets (enabling
diversification)
£25bn-£50bn Conexus Institute 2023509
PLSA 2023510
Even broader range of
assets, including direct
investment
£50bn+ Conexus Institute 2023509
DLUHC 2023512
New Financial 2023513
NMG Consulting 2021514
Improved bargaining
power
£50bn+ Conexus Institute 2023509
DLUHC 2023512
J.P. Morgan 2022515
NMG Consulting 2021514
Even more in-house
capacity
£50bn+ Conexus Institute 2023509
DLUHC 2023512
J.P. Morgan 2022515
NMG Consulting 2021514
504
https://webarchive.nationalarchives.gov.uk/ukgwa/20200102111009mp_/https:/www.thepensionsregulator.gov.uk/-
/media/thepensionsregulator/files/import/pdf/dc-research-summary-report-2019.ashx
505
https://www.thepensionsregulator.gov.uk/-/media/thepensionsregulator/files/import/pdf/dc-trust-based-pension-schemes-
research-report-2022.ashx
506
https://www.apra.gov.au/sites/default/files/2023-
06/Drivers%20of%20performance%20-%20APRA%20paper%20for%20MMF%20conference%20Feb%202023.pdf
507
https://www.gov.uk/government/publications/pension-charges-survey-2020-charges-in-defined-contribution-pension-
schemes/pension-charges-survey-2020-charges-in-defined-contribution-pension-schemes
508
https://www.pensionspolicyinstitute.org.uk/media/o52aoucb/20211118-value-for-money-final.pdf
509
https://theconexusinstitute.org.au/wp-content/uploads/2023/03/Does-Size-Benefit-Super-Fund-Members-24-March-
2023.pdf
510
https://www.plsa.co.uk/Portals/0/Documents/Policy-Documents/2023/PLSA-policy-position-on-pensions-and-growth-
October-2023.pdf
511
https://www.apra.gov.au/sites/default/files/2022-
03/Technical%20paper%20-%202021%20Heatmaps%20-%20Sustainability%20of%20member%20outcomes.pdf
512
https://www.gov.uk/government/consultations/local-government-pension-scheme-england-and-wales-next-steps-on-
investments/local-government-pension-scheme-england-and-wales-next-steps-on-investments
513
https://9075c432-8d38-4fcf-8025-d4433c9ea618.usrfiles.com/ugd/9075c4_22f4e62752ea4c3caa411ab4b66285c7.pdf
514
https://www.brunelpensionpartnership.org/wp-content/uploads/2021/09/LGPS-in-the-UK-Learnings-from-International-
Peers.pdf
515
https://www.jpmorgan.com/content/dam/jpm/cib/complex/content/markets/futue-of-
superannuation/How_Australian_Asset_Owners_Became_Asset_Managers.pdf
283.
283
Justification for thelevel of analysis used in the IA (proportionality
approach)
57. The scale measures are a significant policy intervention, which may result in tens of billions
of market assets, and millions of savers, being moved between schemes. Therefore, as
has already been discussed, DWP and HMT have engaged closely with industry, launching
a Call for Evidence516
on 4 September 2024, as well as receiving over 100 responses to
the subsequent policy consultation517
which was launched on 14 November 2024.
58. Within the research and analysis into “Pension fund investment and the UK economy”518
,
and subsequently also within this Impact Assessment, a wide range of data sources have
been utilised, providing evidence which has been supplemented by the industry
engagement. These data sources include:
• Industry performance data from important and highly reputable sources such as
Corporate Adviser.
• International evidence and engagement, particularly from Australia and Canada, to
understand the potential impacts of scale following their robust assessment and
analysis.
• Provider survey data on costs/charges faced by members externally commissioned
by DWP. Given the significance of the reforms, DWP have already commissioned a
follow-up to better understand the landscape and impacts, with results informing the
Bill and secondary legislation.
• Consultation responses and industry engagement. In particular, DWP conducted
a data gather from industry via the consultation and call for evidence responses to
understand the scale of the challenge and intervention. There has also been
continuous engagement with industry, with workshops held to better understand
industry views.
• ONS surveys including the Annual Survey of Hours and Earnings (ASHE) and
Wealth and Assets Survey (WAS) to understand the pension landscape.
• Industry data from information published by schemes, such as Chair Statements, to
understand costs/charges, investment performance and asset allocations.
59. Despite the extensive information gathered, there remains significant risks around the
analysis. In particular:
• Commercial sensitivity – A large amount of the information relevant to understand
the potential impacts of the scale measures on the market is commercially sensitive,
especially given that business can be won or lost on a few basis points in the pension
market519
. This impacts the willingness of some schemes to share information, while
also meaning that detailed discussions of individual schemes cannot be covered
within the Impact Assessment. As a result, some evidence of the impacts is presented
at a high-level in recognition that it would not be appropriate to talk about a very small
number of schemes (there are only 60 across the entire multi-employer landscape),
as doing this would potentially risk their identification and consequently have a serious
detrimental market impact. However, as much information as deemed sensible is
presented to outline the evidence and impacts.
• A lack of consistent data – As captured in the summary Impact Assessment and the
VfM Impact Assessment, there is a lack of consistent data across the pension
516
https://www.gov.uk/government/calls-for-evidence/pensions-investment-review-call-for-evidence
517
https://www.gov.uk/government/consultations/pensions-investment-review-unlocking-the-uk-pensions-market-for-
growth/pensions-investment-review-unlocking-the-uk-pensions-market-for-growth
518
https://www.gov.uk/government/publications/pension-fund-investment-and-the-uk-economy/pension-fund-investment-and-
the-uk-economy#executive-summary
519
https://corporate-adviser.com/master-trust-and-gpp-defaults-roundtable-competing-in-a-fast-maturing-dc-pensions-sector/
284.
284
landscape. This isalso impacted as the multi-employer market stretches across 2
regulatory regimes (FCA and TPR); albeit, there are very close similarities on the
whole. This means information can be hard to find on a consistent basis (an aspect
the Bill aims to improve on through the introduction of the VfM framework).
60. Nevertheless, the Impact Assessment uses the best available evidence to outline the most
appropriate assumptions and data, enabling the costs and benefits of the proposals to be
balanced. Consequently, the level of analysis utilised is considered proportionate. It is also
important to note that the policy details will be further finalised and refined at secondary
legislation. Therefore, more information and the impacts will be considered as the policy
detail is finalised and further industry engagement takes place. This will also be informed by
the investment that DWP and TPR have already made in further quantitative surveys across
the industry, enabling understanding of views on consolidation and performance across a
wide range of different sized schemes.
Description of options considered
Policy Option 0: Do nothing
61. Under a ‘do nothing’ scenario, consolidation would continue to occur naturally, with a
forecast provided in Figure 1 earlier. However, as was illustrated in Figure 2, this
consolidation is concentrated within smaller single employer trusts, rather than the multi-
employer trusts at which the scale legislation is aimed.
62. Given the far smaller volume of assets they manage, consolidation of these smaller
schemes into larger schemes is insufficient to drive the level of pension scheme scale at
which evidence supports the existence of benefits. As a result, there would continue to be a
range of multi-employer schemes, from very small to very large, across the pension
landscape.
Policy Option 1: Primary legislation (preferred option)
63. The driving of meaningful consolidation across multi-employer DC workplace pension
schemes requires primary legislation, with existing powers insufficient and statutory
guidance ineffective.
64. The specific measures proposed have been carefully designed, utilising the available
evidence, stakeholder meetings, and industry responses to the joint policy consultation. The
measures seek to drive scale in the DC workplace pensions market, though considering
disruption to industry and its capacity to implement the measures. The measures apply only
to multi-employer DC workplace pension schemes and are as follows:
• Schemes must have (at least) one default arrangement with £25bn AUM by 2030 to
continue operating in the Automatic Enrolment (AE) market (i.e. to be able to continue to
receive AE contributions). Therefore, the proposed measures would not force schemes
below the threshold to consolidate, but it is expected that they will elect to do this given
the removal of their contributions inflow which would impact their business model.
• If a scheme holds at least £10bn AUM in (at least) one default arrangement by 2030, then
the scheme can apply to be on a ‘transition pathway’. This would allow them to continue
operating in the AE market providing they meet certain requirements, including a credible
plan to grow that arrangement to at least £25bn AUM by 2035.
• Alongside the minimum scale requirements, there must also be demonstration of in-
house investment capability in order to continue operating in the AE market. Approval
regarding the satisfaction of this requirement would be subject to the discretion of
regulators, with this required to be met by both the schemes exceeding the £25bn AUM
threshold in 2030 and also the schemes applying to be on the ‘transition pathway’. It is
expected that regulators would develop and provide guidance in advance of the
285.
285
requirements being implemented,ensuring business certainty, with a consistency in
approach implemented across the trust-based and contract-based markets.
• To continue to encourage innovation in the market, new entrants (including multi-
employer Collective Defined Contribution schemes, or CDCs) will be able to enter the
market provided they can also demonstrate a credible plan of how they can grow their
default arrangement to meet the required minimum scale of £25bn, though there would
be no initial requirement for minimum scale as with existing schemes.
• Schemes will be prevented from creating any new default arrangements, except in limited
circumstances, and if they wish to do so will have to seek approval from the relevant
regulator.
• Certain schemes are out of scope for the legislation. Firstly, any schemes that provide
solely for protected characteristics, including religious funds. Secondly, hybrid DB-DC
schemes, which are only open to a closed group of related, but not legally connected,
employers
• There will also be a backstop in place to give regulators limited discretion to take into
account an extraordinary event which may impact scheme AUM levels, such as a market
shock. If such events occurred shortly before the minimum thresholds became active, this
could significantly impact the number of schemes able to meet the thresholds, hence the
need for such discretion.
65. Many different policy options have been considered, including (i) the implementation of
AUM thresholds of different values, (ii) different starting years for the minimum AUM
requirements, and (iii) stricter rules on exemptions. The final policy details build-upon and
listen to industry feedback (for example, £50bn AUM was considered in the consultation but
has been lowered to £25bn, with a ‘transition pathway’ for schemes with AUM exceeding
£10bn).
66. The policy aims to:
a) Build a market of fewer, but larger, pension schemes with around 15-20 multi-
employer schemes estimated to be operating by 2035.
b) Support members by ensuring the vast majority of savers are benefiting from the
advantages of saving into a scheme which is operating at scale.
c) Support the UK economy by creating pension schemes which have a greater level
of assets and investment capability. Evidence shows investments in productive
assets are more likely to have a greater level of home bias than assets such as listed
equities.
d) Still encourage competition and innovation through applying exemptions and
encouraging innovative initiatives (such as CDCs) by enabling new starters to enter
the market.
Policy option 2: Absence of legislation – utilising statutory guidance
67. In the absence of legislation, statutory guidance could be utilised. For example, guidance
could be developed encouraging schemes to consider if they are making best use of
economies of scale, pointing to the evidence presented above regarding scale benefits for
schemes with around £25-50bn AUM, thus encouraging consolidation into larger schemes.
68. However, such guidance would only be advisory and not mandatory. Therefore, any
guidance encouraging consolidation among multi-employer schemes would likely have an
extremely limited impact. It could potentially encourage larger schemes to engage smaller
schemes with a view to consolidating assets into their own scheme. However, this would
require sufficiently attractive offers to encourage the smaller schemes to elect to leave the
market, which would be determined by their own business interests.
286.
286
69. Alternatively, guidancecould encourage schemes to adjust their investment strategies,
increasing their exposure to productive finance assets. Such a reweighting of portfolios
would be more consistent with the investment strategy of larger schemes, as was evidenced
earlier in the Impact Assessment. However, evidence suggests smaller schemes are less
able to invest in such assets efficiently, generally possessing less governance capability and
lacking sufficient scale to invest in assets directly, often requiring use of a pooled fund.
70. There are recent examples demonstrating that non-legislative approaches to transforming
the DC pensions market are ineffective. There has already been encouragement from
government and regulators on scale, for example a previous Call for Evidence520
on scale
and consolidation, and communications from TPR including a blog by the Chief Executive521
.
This however has not led to a noticeable change in behaviour, particularly among the
smaller multi-employer pension schemes.
71. Alongside this, though not specifically relating to pension scheme scale, the statutory
guidance forming the Value for Members Assessment522
became effective in October 2021.
This encouraged trustees of schemes with under £100 million of assets to carry out an
assessment of the value their scheme delivers, including comparing charges and investment
performance against three other schemes. However, there has been no noticeable
behavioural change, with many trustees not engaging with this. This therefore highlights the
need for legislation with a strong compliance regime to drive the change, with guidance
alone being ineffective.
Scope of the scale measures
The size of the multi-employer DC workplace pension market
72. The proposed scale legislation will apply to all multi-employer DC workplace pension
schemes. As shown by Table 1 earlier, there are around 60 such schemes, with around 30
Master Trusts and around 30 GPPs.
73. Across these schemes there are 15m active members, being members who are actively
contributing to their pension pots. Alongside this there are also many deferred members,
being members of schemes who are no longer making additional contributions to their
pension pots, which will be the case if they have moved to a different employer. Data
regarding total membership, so including both active and deferred members, is not readily
available. However, the scale legislation will impact both active and deferred members,
with all members of schemes that leave the market requiring their pots to be transferred to
an alternative scheme. Note that it is possible for people to simultaneously be members of
multiple schemes.
74. There is a very high concentration of the DC workplace market in these multi-employer
schemes. For example, looking at just the trust-based side of the market, the around 30
Master Trusts hold 81% of the assets, and over 90% of total and active members.
Schemes out of scope
75. As has already been discussed, certain schemes are out of scope for the legislation:
• Protected characteristics – Any scheme operating solely for protected characteristics,
including religious funds, will be able to continue to operate. This reflects the
uniqueness of these schemes and ensures there is no discrimination against certain
religions or faiths.
520
https://www.gov.uk/government/consultations/future-of-the-defined-contribution-pension-market-the-case-for-greater-
consolidation/future-of-the-defined-contribution-pension-market-the-case-for-greater-consolidation
521
https://blog.thepensionsregulator.gov.uk/2023/11/24/change-is-coming-we-must-grasp-this-opportunity-in-savers-interests/
522
https://www.gov.uk/government/publications/completing-the-annual-value-for-members-assessment-and-reporting-of-net-
investment-returns/completing-the-annual-value-for-members-assessment-and-reporting-of-net-investment-returns
287.
287
• Hybrid DB-DCschemes – Some schemes, such as USS and Railpen, operate a
Master Trust and Defined Benefit pension. These are out of scope for the scale
measures, which are specific to workplace DC pensions, given that the large DB
scheme should allow scale to be achieved for the benefit of the DC scheme. Also,
these schemes are only available to a closed group of related, but not legally
connected, employers.
• It is estimated there are around 10 of these exempt schemes, meaning the remaining
50 schemes are in scope for the legislation.
Projections of the number of schemes impacted
76. Accounting for the £25bn minimum AUM threshold in 2030, as well as the ‘transition
pathway’ enabling schemes with over £10bn AUM to continue operating in the AE market,
providing they have a credible plan to grow that arrangement to at least £25bn AUM by
2035, it is projected that around 15-20 schemes will have sufficient AUM to meet the
thresholds. Alongside the 10 schemes out of scope, it is therefore projected that 25-30
schemes will remain in the market.
77. Across the 30-35 schemes that are modelled to be both in scope for the legislation and to
have insufficient scale to comply with the minimum AUM thresholds, there is projected to be
around £70bn of AUM in 2030, with this requiring consolidation into larger schemes.
Therefore, the schemes leaving the market are projected to have an average (mean) AUM of
around £2bn. In a ‘do nothing’ scenario, it is possible that some multi-employer DC schemes
may have consolidated by 2030, meaning fewer schemes will be in scope for the legislation.
78. Table 3 categorises schemes given AUM projections at different points in time. Ranges are
provided, rather than exact values, reflecting the existence of both imperfect data and
uncertain projections. By enabling schemes with at least £10bn AUM in an arrangement by
2030 to continue operating in the AE market, providing they have a credible plan to grow that
arrangement to at least £25bn AUM by 2035, it is estimated that around 5 additional
schemes will be able to continue operating in the market (alongside the 10-15 schemes that
are expected to have AUM exceeding £25bn in 2030).
Table 3: Counts of schemes projected to meet different AUM thresholds over time
Estimated Number
of Schemes
Exceeding £25bn AUM at year end 2023 5-10
Exceeding £25bn AUM in 2030 10-15
Exceeding £25bn AUM in 2035 15-20
79. Table 4 summarises the projected impacts of the scale measures on the size of the market.
Table 4: Counts of schemes projected to leave and remain in the market as a result of
the scale measures
Estimated Number
of Schemes
Out of scope (and will remain in the market) 10
In scope, and projected to have sufficient AUM to remain in the market 15-20
Projected to be leaving the market 30-35
288.
288
AUM thresholds atdefault arrangement level
80. The scale measures require multi-employer DC workplace pension schemes to have an
above-threshold level of AUM in at least one default arrangement. As explained earlier, this
is the level at which contributions are collected, with investment expertise utilised to set the
strategy for how these contributions are invested. However, for the reasons explained in
more detail in the later “Projections of necessary consolidation” section, analysis in this
Impact Assessment is conducted at scheme-level.
Interactions with other Pension Schemes Bill measures
81. There may be other pension reforms which interact with the scale measures. These include
the proposed VfM framework, where underperforming schemes would be removed from the
market, further reducing the number of schemes. At this point, the interactions across the
measures cannot be known and are highly dependent on pension scheme behaviour, as well
as the sequencing and timings with which the measures are implemented. Estimates of such
interactions have not been produced and are considered in the overarching Pension
Schemes Bill Impact Assessment.
82. Therefore, this Impact Assessment assumes the scale measures are implemented in
isolation from other measures, with the only exception being the proposed contractual
override measures. These will enable pension providers to override a member’s contract
within a contract-based pension arrangement, either updating the terms or transferring
members to a new arrangement, consequently allowing GPPs to more easily consolidate
their default arrangements. Therefore, it has been assumed these measures will be
implemented alongside the scale measures, with them potentially allowing some schemes to
surpass the minimum AUM thresholds within a single default arrangement by consolidating
multiple arrangements. Given the significant implications of not meeting the scale test, it is a
reasonable assumption any scheme who has the total AUM sufficient to meet the
requirement will merge together arrangements, via this mechanism, in an attempt to meet
the scale level.
83. However, consultation responses also illustrated that, across most schemes, there is a large
concentration of AUM within one or two default arrangements. Alongside this, total scheme
AUM is projected to be far higher than the minimum AUM thresholds for many schemes.
Consequently, it is considered a reasonable assumption that the use of the contractual
override measures will not be necessary for most contract-based schemes to achieve scale.
Therefore, the implementation of these measures is not materially expected to impact the
projections in this Impact Assessment.
Summary of costs and benefits
84. Given commercial sensitivities, with numerous schemes projected to be leaving the market
following introduction of the scale measures, individual scheme anonymity has been ensured
throughout this Impact Assessment. Alongside the naming of individual schemes being
inappropriate for commercial reasons, it would also be inappropriate given the uncertainties
present. For example, some schemes, which are currently projected to have insufficient
scale to remain in the market, may already be implementing detailed business plans to
ensure they do achieve scale, with these plans not publicly available.
85. Consequently, although aggregate AUM figures and scheme counts have at times been
provided, more granular breakdowns have been avoided, meaning that the analysis
presented is likely at a higher level than within a typical Impact Assessment.
86. It should be noted that the choice of appraisal period has an impact on the net present
value for the proposed measures. Once the market has reached its new consolidated state,
with fewer, larger schemes, there should be no further costs. Therefore, unlike other policies,
the scale measures should cause zero ongoing costs, with every year beyond the end of the
289.
289
appraisal period onlyresulting in benefits. Therefore, the longer the appraisal period utilised,
the larger the net present social benefit that the scale measures would be estimated to
provide.
87. Considering only direct costs and direct benefits to business, the scale measures are
estimated to provide an equivalised annual net benefit across the ten-year appraisal period
of £26m. Given there are around 60 multi-employer DC schemes, this results in an average
equivalised annual net benefit per scheme of around £400k-£450k.
88. The key costs and benefits, covered across the Impact Assessment, are summarised in
Table 5.
Table 5: Summary of costs and benefits of the proposed scale measures
Impact Summary Direct or
Indirect
Cost/Benefit?
Net Present Value
(over the 10-year
appraisal
period)523
Costs
Familiarisation Costs
(for Pension Schemes)
The costs required to understand and ensure
compliance with the legislation
Direct £4m
Search Costs (for
Pension Schemes)
For the schemes leaving the market, the costs
of selecting and engaging a scheme to
consolidate their funds into.
Direct £8m
Consolidation Costs
(for Pension Schemes)
The costs required to transfer assets between
schemes, including the selling and buying of
funds plus necessary supporting activity
including legal, consultancy and
communication.
Direct £103m
Costs to Members Consolidation costs could be passed-on to
members in the form of higher charges, though
market competition makes this unlikely.
- Non-monetised
Costs to Employers There are expected to be no additional costs to
employers.
- Non-monetised
Costs to Regulators Processing of exemption requests and
enforcing the legislation, though this is
assumed to form part of existing budgets.
- Non-monetised
Benefits
Lower Investment
Fees (for Pension
Schemes)
Due to additional scale, schemes can access
lower investment fees, increasing their profits.
Direct £339m
Increased Net Returns
via Lower Charges for
existing members in
schemes which gain
greater scale (for
Members)
For the schemes which gain greater scale
following consolidation, the lower investment
fees are assumed to be partially passed-on to
members in the form of lower charges,
increasing their net returns.
Indirect £339m
523
The aggregated monetised impacts are calculated for a ten-year appraisal period and all costs are given in 2024 prices and
use 2025 as the base year for the present value calculation, as given in the RPC/DBT Impact Assessment Calculator.
290.
290
Increased Net Returns
viaLower Charges for
members transferred
into larger schemes
(for Members)
The members who are transferred into a larger
scheme gain access to the lower charges
offered by their new scheme, with this
increasing their net returns.
Direct £402m
Increased Returns
through Diversification
(for Members)
Members can also benefit from larger schemes
being more readily able to access the full range
of available asset classes, including private
markets, which leads to diversification and
return benefits, thus allowing their pots to grow
larger.
Indirect £939m
Increased Charge
Revenue (for Pension
Schemes)
As scale can be expected to increase net
returns for members, and hence enable them
to build larger pension pots, schemes can
benefit from higher charge revenue as a
percentage of these pots.
Indirect £7m
Benefits to Employers Selecting a pension scheme for their
employees will be easier, with fewer schemes
to consider the merits of.
- Non-monetised
Benefits to Regulators Lower costs of monitoring and enforcement,
with fewer schemes to oversee and better
compliance due to improved governance.
- Non-monetised
EANDCB
89. Table 5 identified three direct costs to business and one direct benefit to business,
with these direct costs and benefits all for pension schemes.
90. Table 6 below highlights those specific direct costs and benefits, explaining why each is
‘direct’.
Table 6: Direct costs and benefits to business (all of which are for pension schemes)
Direct Cost /
Direct Benefit
Summary Why is this direct?
Familiarisation
Costs
The costs required to understand
and ensure compliance with the
legislation.
Pension schemes are the first step in the logic chain -
these are immediate and unavoidable costs for all multi-
employer DC schemes.
Search Costs
For the schemes leaving the
market, the costs of selecting and
engaging a scheme to
consolidate their funds into.
For all schemes leaving the market, necessitated by the
scale measures, these are again unavoidable costs.
Consolidation
Costs
The costs required to transfer
assets between schemes,
including the selling and buying of
funds plus necessary supporting
activity including legal,
consultancy and communication.
For the schemes leaving the market, their assets must be
transferred into an alternative scheme to allow their
members to continue to save, with these costs again
unavoidable.
Lower Investment
Fees (Benefit)
Due to additional scale, schemes
can access lower investment
fees, increasing their profits.
This is the first consequence of building scale, with
pension schemes achieving greater economies of scale
and being able to deliver a wider range of investments for
lower costs.
291.
291
91. Table 7below presents the annual calculated value of these direct costs and benefits, with
the calculation methodology explained later in the Impact Assessment. These values are
used to calculate the Equivalent Annual Net Direct Cost to Business (EANDCB). The results
of the calculations are:
• Equivalent Annual Direct Cost to Business = £13m
• Equivalent Annual Direct Benefit to Business = £39m
• Equivalent Annual Net Direct Cost to Business (EANDCB) = -£26m
This shows the measure is estimated to result in an estimated annual direct saving of
£26m per year to businesses.
Table 7: Annual estimated direct costs and direct benefits to business (2024 prices)
Direct Cost / Direct Benefit 2025 2026 2027 2028 2029 2030 2031 2032 2033 2034
Familiarisation Costs £4m
Search Costs £3m £3m £3m
Consolidation Costs £34m £38m £42m
Lower Investment Fees (Benefit) £68m £76m £86m £96m £108m
Projections of necessary consolidation
Why future scheme AUM must be projected
92. Due to AUM growth, utilisation of current AUM values will be inappropriate to determine
likely consolidation activity. By the point which the thresholds become active in 2030, several
schemes will have crossed these. Growth in scheme AUM is determined by the following
factors:
a) Contributions, where employers and employees pay into a pension scheme.
b) Investment returns, which increase the stock of assets.
c) Withdrawals, as people withdraw from their pension or transfer assets to alternative
schemes.
d) Mergers and acquisitions, with the AUM in different schemes combined in a single
larger scheme.
93. For schemes with known AUM at the end of 2023, their future AUM must be projected up
to 2035, at which point all schemes in scope for the legislation must have £25bn AUM to
continue operating in the AE market. From this, it can be projected which schemes will have
sufficient AUM to remain in the market, which schemes will leave the market, and how much
AUM will be required to be consolidated into other schemes.
Assumptions utilised to project scheme AUM
94. A single consistent data source is not available. Consequently, AUM statistics have been
sought from two key sources, being the Go Pensions “DC Master Trust League Tables”524
and CAPA525
, with these providing significant market coverage. This has then been
524
https://go-group.co.uk/dc-master-trust-league-table-2024-h1/
525
https://capa-data.com/younger-saver-30-years-to-retirement-5-year-annualised-line/
292.
292
supplemented with additionalinformation from Chair Statements and individual scheme
documentation.
95. Given the imperfect availability of data, alongside the large uncertainties present, several
assumptions have had to be utilised:
Discounting ‘natural consolidation’ between schemes
96. In a ‘do nothing’ scenario, it is possible that some multi-employer DC schemes may have
consolidated by 2030. Only the consolidation prompted by the implementation of the scale
measures should be monetised, with this ‘natural consolidation’ discounted.
97. However, such consolidation between multi-employer DC schemes has been extremely
rare, with limited examples of schemes either merging or leaving the market. It is therefore
expected there will be minimal amounts of such activity before 2030, and if there was, the
specific schemes and their AUM who exit the market cannot be known.
98. Consequently, given the limited history of consolidation among multi-employer schemes,
as well as the uncertainties present, it is assumed no existing schemes would leave the
market unless necessitated by the scale measures. Therefore, monetisation is carried out for
all the consolidation modelled to occur.
Analysis at scheme level rather than arrangement level
99. The preferred option requires multi-employer DC workplace pension schemes to have at
least one default arrangement with £25bn AUM by 2030. However, analysis has been
carried out at scheme level, despite consultation responses confirming many schemes
contain multiple default arrangements. Therefore, even though it is projected that a
scheme’s AUM may reach £25bn by 2030, additional work may be required to ensure that at
least one of their default arrangements contains sufficient AUM. For example, they may be
required to combine existing arrangements, with this activity having costs. However, for
several reasons, scheme-level analysis is considered appropriate:
a) There is a lack of available data on the breakdown of AUM at arrangement level within
schemes. The consultation did ask providers for information on their existing defaults,
including the number of default arrangements and the number of default funds that
they have, as well as the total AUM across these defaults. However, given that
responses were only provided by a subsection of the market, with the structures of
defaults described being extremely varied, it has been decided that any assumptions
regarding the proportion of funds in default arrangements could be inaccurate.
b) As well as arrangement-level data being less readily available, utilisation of it would
require additional assumptions regarding merging activity, with the pattern that this
would take extremely uncertain,
c) Given the time lag between the proposed legislation being announced and the
minimum AUM thresholds coming into effect, schemes will have time to adjust,
allowing them to direct funds into their largest default(s). Consequently, it is less likely
they will be required to carry-out a significant restructuring close to 2030, whereby they
would have to move funds from smaller arrangements into their largest
arrangement(s). Therefore, it is assumed any costs accrued from the consolidating of
arrangements will be minimal.
d) Given the level that the minimum AUM thresholds have been set at, many schemes
are projected to have far higher AUM levels. Consequently, it is considered extremely
unlikely that at least one of their arrangements would not have AUM higher than the
proposed thresholds. Consultation responses also illustrated that, across most
schemes, there is a large concentration of AUM within one or two default
arrangements.
293.
293
Missing and imperfectAUM data
100. Given the sources available, of the around 60 multi-employer DC workplace pension
schemes, AUM data at year-end 2023 is available for 45 schemes. Of the remaining 15
schemes, there is not consistent and time-series data available. However, these are largely
small MT/GPPs where active membership is low. Consequently, the future AUM values of
these schemes have been unable to be projected, with it unknown how much AUM will
consequently need to be consolidated into other schemes. This is a risk, as the modelled
benefits and costs of the legislation would be higher if these schemes were included, given
that additional scale would be achieved following consolidation with additional costs required
to carry-out the necessary consolidation activity. However, industry engagement and older
data sources confirm that the AUM in these schemes is of very low value relative to the rest
of the market, for which a more accurate AUM picture is known. Consequently, it is projected
that all 15 of these schemes will leave the market following implementation of the minimum
AUM thresholds.
101. For some of the GPPs, the AUM figures utilised include personal pensions. Given that the
policy is restricted to workplace pensions, the AUM in personal pensions would be
discounted when considering if an arrangement has sufficient scale. Therefore, it is possible
that the modelling projects some schemes to meet the thresholds that won’t. However, the
assets in these personal pensions are relatively small, with the schemes in question
generally expected to far exceed the thresholds regardless.
Assumed AUM growth rates
102. For the 45 schemes for which AUM values are known, it is required to assume AUM
growth rates, with this being necessary to project future scheme AUM values.
103. For Master Trusts, historic AUM data is available from the Go Pensions “DC Master Trust
League Tables”526
. From this, annual AUM growth rates over the prior two years have been
calculated for each scheme, though the industry average has been utilised for the individual
schemes whose AUM growth rates were deemed to be a significant outlier. A two-year
period was chosen to not overlap with the Covid-19 pandemic, with this not considered a
representative period suitable to be used for forecasting.
104. However, to project future Master Trust AUM values, these growth rates have been
halved, with a 13% average (mean) growth rate across schemes. This accounts for the fact
that longer-term Master Trust AUM growth rates are highly likely to be lower, with this
supported by a couple of factors. Firstly, given that Master Trusts are a relatively recent
phenomenon, having only been in existence for around a decade527
, a higher proportion of
members will soon be entering retirement. This should lead to a slowing of AUM growth, with
these members ceasing making additional contributions and instead beginning to withdraw
funds. Alongside this, there has been a strong stock market rebound since the Covid-19
pandemic, which may not necessarily hold in the long-term. Adjusting growth rates
downwards is also a conservative assumption, accounting for the nature of compounding,
whereby outcomes can be extremely sensitive to growth rates. Therefore, a small error in
assumed growth rates would have a significant impact, negatively influencing the accuracy
of the projections.
105. For GPPs, annual AUM growth of 10% has been assumed across all schemes. Given
that less time-series data exists than for Master Trusts, this reflects sensible assumptions on
investment returns and contributions. This was also validated by comparing to the growth
amongst GPPs for which data does exist, with data sources including the Chair Statements
published by schemes, with this also showing around 10% annual growth over recent years.
106. The resulting AUM projections calculated are broadly consistent with other sources,
including the PPI’s ‘DC Future Book’528
and DWP’s own stock-flow model of DC assets
526
https://go-group.co.uk/dc-master-trust-league-table-2024-h2/
527
https://www.thepensionsregulator.gov.uk/en/media-hub/speeches-and-speakers/the-evolution-of-master-trust-supervision
528
https://www.pensionspolicyinstitute.org.uk/media/hbrgvfw5/20240926-the-dc-future-book-2024-final.pdf
294.
294
supporting the appropriatenessof the growth rate assumptions utilised. Also, despite
projected AUM values being very sensitive these growth rates, there was found to be a
relatively limited impact on the number of schemes projected to be leaving the market when
varying these, with schemes generally projected to have AUM levels either far higher or far
lower than the thresholds.
Accounting for the lower £10bn threshold in 2030
107. Alongside the main £25bn AUM threshold for 2030, there is also the lower scale test
whereby schemes must hold at least £10bn AUM in one default arrangement by 2030, with
this enabling them to apply to be on the ‘transition pathway’ and continue operating in the
AE market. Access to the ‘transition pathway’ should be granted providing schemes meet
certain requirements, including having a credible plan to grow their arrangement to at least
£25bn AUM by 2035. Consequently, it is assumed that schemes will remain in the market if
they are projected to have both (1) at least £10bn AUM in 2030 and (2) at least £25bn AUM
in 2035.
Results and usage of the projections
108. Having established these conditions, it is projected that around 15-20 schemes will have
sufficient AUM to meet the minimum AUM thresholds, alongside the 10 schemes out of
scope, with 25-30 schemes therefore projected to remain in the market. Therefore, it is
projected that 30-35 schemes will leave the market. These projected impacts on the size of
the market are summarised in Table 8.
Table 8: Counts of schemes projected to leave and remain in the market as a result of
the scale measures
Estimated Number
of Schemes
Out of scope (and will remain in the market) 10
In scope, and projected to have sufficient AUM to remain in the market 15-20
Projected to be leaving the market 30-35
109. Across the remaining 30-35 schemes modelled to be in scope for the legislation but to
have insufficient scale to comply with the minimum AUM thresholds, there is projected to be
around £70bn of AUM in 2030, with this requiring consolidation into larger schemes. It has
been modelled that this AUM is equally likely to be consolidated into each of the 15-20
schemes of scale that remain in the market, with the AUM shared equally across them.
Therefore, of the £70bn AUM to be consolidated, each of the schemes is modelled to
receive around £4bn on average. Given that the exact market reaction to the scale
measures is unknown, this is adopted as a simplifying assumption. In practice, the actual
AUM values consolidated into each scheme will be higher or lower than this.
110. It was considered whether the AUM should be modelled as being consolidated in
proportion to the sizes of the remaining schemes in the market, so that the larger schemes
would receive more AUM, though this is once again uncertain. Compared to the
assumptions which are varied in the later ‘Sensitivity Analysis’ section, including the size of
the reduction in investment fees that can be accessed through additional pension scheme
scale, modelling results were relatively insensitive to this assumption.
111. Also, the proposed measures do not actually force schemes below the thresholds to
consolidate, so it is possible that some of them will not. However, it is expected that they will
elect to do this given the removal of their contributions’ inflow. The potential exception is for
schemes which only have deferred members, which is the case for a small number of GPPs.
295.
295
Given that noneof their members are actively making contributions, the removal of the
contributions’ inflow will not impact them. Despite this, it is expected that the requirements
imposed by other Pension Schemes Bill measures will necessitate their closure, even if the
scale measures in isolation will not. Within this Impact Assessment, given the small amounts
of AUM which are held by these schemes, the potential for these schemes to remain in the
market rather than consolidating is not considered materially impactful.
Costs of the scale measures
112. All monetised costs, specifically familiarisation costs, search costs and consolidation
costs, are for pension schemes. These are also all direct costs.
113. Considering just the costs rather than the benefits provided by the scale measures, the
equivalised annual cost across the ten-year appraisal period is £13m. Given there are
around 60 multi-employer DC schemes, this results in an average equivalised annual cost
per scheme of around £200k-£250k.
Familiarisation costs
114. Familiarisation costs are estimated using an FCA survey of the contract-based market.
The survey related to the impacts of implementing the proposed Value for Money (VfM)
framework, with this seeking to build evidence on the potential costs of the policy. For
several reasons, VfM is considered a similar policy to the scale measures. Firstly, like the
scale measures, it applies to both the trust-based and contract-based markets. Also, similar
extensive engagement is expected to be required by schemes to ensure compliance with the
legislation. Finally, the policies may have similar impacts, with both including mechanisms by
which schemes can be removed from the market.
115. However, there is a risk that familiarisation costs will be different for the VfM measures
and the scale measures. Steps have been taken to limit this risk, including the weighting of
costs by scheme size, accounting for the scale measures being limited to the larger multi-
employer DC schemes.
116. Also, given that the survey was restricted to the contract-based market, there are risks
present in applying results to Master Trusts. However, it is assumed that the contract-based
market is representative of the entire multi-employer DC market, with trust-based schemes
facing similar costs. This does not seem unreasonable given evidence that many providers
operate in both markets, particularly the largest providers with whom most DC assets are
held, meaning business models in the trust-based and contract-based markets are often
comparable.
117. By AUM band, Table 9 shows the average familiarisation cost from the survey, with the
values shown being the estimated costs reported by schemes of different AUM level.
Consistent with the Impact Assessment for the VfM measures, ‘Optimism Bias’ has been
applied in line with Green Book standards, estimated at around 25%. This reflects the
uncertainty on the final policy details, that providers may underestimate some of the costs,
and because survey estimates are based on a non-final policy position.
296.
296
Table 9: Averagefamiliarisation cost with the Value for Money (VfM) framework from
the FCA survey of the contract-based market.
AUM band (£)
Average
familiarisation cost
(per scheme)
Adjusted Average
(with 25%
optimism bias)
0-100m £14,000 £17,000
100 - 1bn £16,000 £20,000
1b - 25bn £30,000 £37,000
25bn+ £258,000 £323,000
118. It has been modelled that familiarisation costs will be incurred in the year that the
legislation is announced, so 2025. Consequently, given projected scheme AUM values in
2025, costs have been estimated using the ‘Adjusted Average’ values in Table 9. Having
modelled these costs to be incurred by all schemes, the total cost is calculated at £4m, being
an average of around £70,000 per scheme. This is shown in Table 10.
Table 10: Projected familiarisation costs due to the scale measures (2024 prices)
2025
Familiarisation costs £4m
Search costs
119. Search costs, like familiarisation costs, have been taken from analysis relating to other
planned private pensions legislation. Specifically, that legislation intends to place duties on
DC occupational pension schemes to provide each member of their scheme support at the
point of decumulation. Through industry engagement, including roundtables and one-to-one
meetings with pension schemes, ‘partnering costs’ were estimated by scheme size, being
the costs that would be incurred by smaller schemes when partnering with Master Trusts to
provide decumulation solutions for their members. Such partnering activity appears
analogous to the search activity that must be carried-out by smaller schemes following
implementation of the scale measures, with them also being required to select and engage
larger schemes. Consequently, it is assumed that the costs will be similar, with Trustees
seeking to find the best alternative arrangement for their members and likely to assess
multiple schemes in detail before making a decision.
120. From the results of industry engagement, partnering costs were estimated, taking an
average of the responses. ‘Central’, ‘high’ and ‘low’ estimates were produced by scheme
size, with larger schemes modelled to have higher costs. For the search costs within this
Impact Assessment, the ‘central’ estimate has been utilised for the largest scheme size. This
accounts for the scale measures being restricted to multi-employer schemes, with the
smaller single employer trusts excluded.
121. Search costs have been applied for all schemes that are projected to be required to leave
the market. It is assumed that all these multi-employer schemes are "large schemes", with
the central estimate of £250,000 therefore applied for each scheme. Across the
approximately 30-35 schemes, the total cost is therefore around £9m, with this split equally
across the three years where consolidation is modelled to occur. Therefore, search costs are
estimated as £3m in each of 2027, 2028 and 2029. These costs are shown in Table 11
below.
297.
297
Table 11: Projectedsearch costs due to the scale measures, being the costs incurred
by schemes leaving the market to select and engage a scheme to consolidate their
funds into (2024 prices)
2027 2028 2029
Search costs £3m £3m £3m
Consolidation costs
122. As outlined in the prior “Projections of necessary consolidation” section, it is estimated
that around 30-35 schemes are both in scope for the legislation and projected to have
insufficient scale to comply with the minimum AUM thresholds. Across these, there is
projected to be around £70bn of AUM in 2030, with this requiring consolidation into larger
schemes.
123. Following introduction of the Pension Schemes Bill in 2025, the market response to the
proposed scale measures is ultimately unknown. It has been assumed that consolidation
activity will be shared equally across the three years preceding the minimum AUM
thresholds becoming active. Therefore, this is modelled to be split between 2027, 2028 and
2029. Despite the minimum AUM thresholds only becoming active in 2030, this modelling
approach reflects that many schemes will know far in advance whether it is achievable to
meet the thresholds or not. Consequently, the schemes leaving the market are unlikely to all
wait until the final year to do this, with them instead producing business plans to meet their
individual needs. Also, these schemes are likely to lose business, with employee benefit
consultants identifying that they are unlikely to meet minimum scale, likely accelerating their
decision to leave the market. Alongside this, mergers and transfers can take time,
particularly when considering the large value of assets being transferred, meaning they may
take place earlier.
124. The consolidation is modelled such that, given the value of AUM that is projected to
require consolidation in 2030, that one third of its projected value is assumed to be
consolidated in each of these years. Given projected AUM growth, the value of the AUM that
must have been consolidated in 2030 is £70bn. The AUM across these same schemes is
projected to be £51bn in 2027, with one third of this (£17bn) therefore modelled to be
consolidated in 2027. Consequently, the amount modelled to be consolidated in 2027 is
lower than the amount consolidated in 2028 (£19bn), and even lower than the amount
consolidated in 2029 (£21bn).
125. Evidence from the Pension Investment Review consultation responses found that the
transferring of assets is not costless. Consequently, a cost has been applied to the
consolidation necessitated by implementation of the scale measures. To assign a value to
this cost, consultation responses have been utilised relating to scheme experiences of
combining default funds and arrangements together within the same organisation. This does
pose a risk, given that the question used related to the internal consolidation of assets by an
individual pension scheme, rather than the consolidation of assets between schemes.
126. Responses gave an indication of the costs of consolidation, with transaction costs being
noted as the main cost. Though a range of estimates were provided for these costs, the
average response was determined to be 0.15% to 0.2% of the value of assets being
transferred. Alongside transaction costs, various other costs were noted including legal,
consultancy and communication costs, though the scale of these costs was less readily
provided. Given these ‘other costs’ are harder to monetise, the overall cost of consolidation
is assumed to be 0.2% of the value of assets transferred, being at the higher end of the
estimated value of transaction costs. Utilising the upper limit of the range is a conservative
approach, taken due to the amount of uncertainty present while also attempting to account
for the ‘other costs’.
298.
298
127. Given theassumed 0.2% consolidation cost, Table 12 shows the estimated yearly
consolidation costs given the value of AUM to be consolidated.
Table 12: Estimated consolidation costs due to the implementation of the scale
measures (2024 prices)
2027 2028 2029
Yearly consolidated amount £17bn £19bn £21bn
Yearly consolidation cost £34m £38m £42m
Other non-monetised costs to schemes
128. The consolidation necessitated by the introduction of the minimum AUM thresholds will
result in the closing down of schemes who may have remained operational in the
counterfactual scenario (where no minimum AUM thresholds are implemented). Based on
this Impact Assessment’s projections, it is estimated around 30-35 schemes may be closed
following this policy. These schemes will incur closing costs and foregone revenues. It will
also mean disruption in the form of job losses, or job moves, for the staff at these firms.
129. However, as outlined in the ‘Benefits of the scale measures’ section, the closing of these
30-35 schemes results in a transfer of assets into the remaining schemes with whom the
closing scheme consolidates. Therefore, assets are transferred rather than ‘removed’ from
the market. Alongside the transfer of assets, additional jobs could become available in the
remaining schemes as teams expand, likely seeking to hire those with existing market
expertise who may have lost their jobs.
130. There is significant uncertainty in projecting the impacts of scheme closures, with this
consequently not monetised. It is unclear exactly how many schemes will leave the market,
the specific schemes these will be, the point in time at which this will occur, the cost, the job
ramifications, and whether these are first-, second-, or even third- order policy impacts.
131. It also seems possible that some closures will have smaller impacts than others. For
example, a provider who offers both a Master Trust and a GPP could decide to consolidate
their assets into a single scheme, enabling them to achieve sufficient scale to remain in the
market. Such an outcome appears very possible, especially given the confirmation in
consultation responses that, for providers who offer both a Master Trust and GPP, that
default arrangements and default funds are generally the same across both offerings. In this
scenario, it seems likely that the impacts would be smaller than if a firm ceased its
involvement in the DC workplace pensions market entirely.
132. Also, the impacts likely vary across firms, with this dependent on how central pension
provision is to their business model. If their workplace pensions service is one of many
functions, this may just mean the closure of that individual function while the firm continues
operations, with jobs potentially able to be absorbed into the other functions.
Cost to members
133. Members may face indirect costs if the costs incurred by pension schemes are passed-
on. Member-borne costs could come in the form of increased charges, although this has low
likelihood given overall charges are capped at 0.75% of AUM. The potential for higher costs
to members has not been monetised, with competition between schemes making the
passing-on of costs unlikely. Also, this would ultimately be a transfer of the cost incidence
monetised above rather than additional overall costs.
134. Given there will be fewer schemes in the market, there is a risk that innovation lessens as
pressure from market competition is eased. This could impact member experience and
worsen service levels. Also, for the members that are transferred into larger schemes, it is
299.
299
possible that theinvestment returns on their contributions may worsen. Such investment
returns are volatile, with Figure 5 illustrating the wide range in investment performance
across schemes, with many smaller schemes having achieved high gross returns over the
last 5 years.
135. The proposed measures have been designed to mitigate against the risk of a loss of
innovation, ensuring that innovative new schemes have opportunity to enter the market via
the ‘new entrant pathway’. This would allow such new entrants to enter the market provided
they can also demonstrate how they can grow their default arrangement to meet the required
minimum scale of £25bn, though there is no initial requirement for minimum scale as with
existing schemes. For example, multi-employer Collective Defined Contribution (CDC)
schemes are a type of new emerging pension scheme which will require a large scale, given
the requirement to pool longevity risks. Therefore, the minimum scale requirement will not be
applicable for these.
136. It is also estimated the proposed Value for Money (VfM) framework should offset potential
member costs from a loss in market competition, should they occur. The publication of
investment returns, enabling easier comparison, should ensure the DC pensions market
continues to innovate, be competitive and perform effectively for its members.
137. Alongside considerations of investment returns and charges, members could be
transferred into schemes which offer fewer services, impacting member experience, as well
as into schemes with higher charges. However, the extent to which their charges could
increase is limited by other policies, including the charge cap at 0.75% of AUM. Also, this is
considered a low risk, given the benefits that scale can provide in terms of a lowering of
costs.
138. Overall, given the uncertainty, including the uncertainty in scheme behaviour, these
potential costs to members have not been monetised at this stage. Further discussion on
competition and innovation is outlined in the ‘Wider impacts’ section.
Cost to employers
139. Employers are not expected to experience significant direct costs from the scale
measures, with a lack of information available regarding any potential indirect costs,
meaning these are unable to be monetised at this stage.
140. In the ‘Benefits for employers’ section, the reduction in search costs is highlighted as a
potential benefit for employers. Given they will have to consider the merits of fewer
schemes, this should simplify the selection of pension scheme for their employees.
However, particularly for the most engaged employers, this may come at the expense of
choice.
141. Also, some employers pay an administration fee to set-up pension schemes, though
many do not. It is possible, due to a reduction in the size of the market, that a removal of
competition allows the remaining schemes to newly implement or raise the size of these
fees. However, the proposed AUM thresholds should allow a significant number of schemes
to remain in the market, ensuring competition on cost is maintained. Schemes are
particularly unlikely to increase employer costs due to the risks of losing custom, with current
evidence529
finding that cost and convenience to the employer dominate decision-making
when selecting pension schemes.
142. Alongside this, some employers currently have specific arrangements with schemes, with
it possible for their employees to be moved to a more general arrangement because of the
measures. This may result in the administration processes for employers becoming more
difficult, particularly if they previously had a favourable bespoke arrangement in place.
529
See table 7.3: https://www.gov.uk/government/publications/department-for-work-and-pensions-employer-survey-
2022/department-for-work-and-pensions-employer-survey-2022-research-report#pensions
300.
300
Alongside this, forall employers whose employees are transferred to a new scheme, there
may be short-term costs to adjust to changes in administrative processes.
143. There is also a possibility, though this is considered unlikely, that some schemes with
insufficient AUM to meet the thresholds could remain in the market. This is a consequence
of the proposed measures not actually forcing schemes below the thresholds to consolidate.
If these schemes were to remain in the market, though being unable to receive AE
contributions, this would require employers to find an alternative scheme (that has met the
scale requirements) in order to meet their own AE duties530
. Therefore, there is a risk that
additional costs would be required to be incurred by some employers. However, this is
considered unlikely, with it expected that these schemes will elect to leave the market given
the removal of their contributions’ inflow, with this being in their business interest.
Consequently, it is expected that they would seek a scheme to transfer their existing
members (and the assets of those members) across into, allowing those members to
continue to make automatic enrolment (AE) pension contributions. This will be monitored as
the policy develops.
Cost to regulators
144. There may be additional costs for regulators, firstly in the processing of exemption
requests, then later due to enforcement of the legislation. However, the scale or size of
these potential costs cannot be robustly monetised at this stage and such activity is
expected to form part of the existing budgets of regulators.
Benefits of the scale measures
145. As a result of the scale measures, there are monetised benefits to members and pension
schemes, with these explored in more detail within this section of the Impact Assessment.
Summarising the sources of monetised benefits:
a) Lower investment fees (for pension schemes): Due to lower fees, attainable as
pension scheme scale increases, schemes earn increased profits. These are direct
benefits of the scale measures, being benefits immediately attainable given increased
scale.
b) Increased net returns via lower charges (for existing members in schemes
which gain more scale following consolidation): For the schemes which gain more
scale following consolidation, the lower investment fees are assumed to be partially
passed-on to members in the form of lower charges, increasing their net returns.
These are indirect benefits for members, given the requirement for the lower fees to
be passed-on to them.
c) Increased net returns via lower charges (for members transferred into larger
schemes): The members who are transferred into a larger scheme gain access to the
lower charges already offered by their new scheme, with this increasing their net
returns. These are direct benefits for members, with the lower charges automatically
accessed given their necessary transfer to a larger scheme.
d) Higher net investment returns through diversification (for members): A further
increase in net investment returns, with scale enabling diversification benefits through
investment in a wider range of assets, including in private market assets. These have
the potential to outperform traditional portfolios on a risk-adjusted basis. Again, these
are indirect benefits of the scale measures, with pension schemes being required to
adjust their investment strategies in order for these benefits to accrue for members.
530
Employees must automatically enrol eligible employees into an automatic enrolment pension scheme, also making
contributions to their employee’s pension. Employer duties are explained in more detail here:
https://www.thepensionsregulator.gov.uk/en/document-library/automatic-enrolment-detailed-guidance/resources-employer-
duties-and-safeguards#c9b8c992b9ae41fe9e9ba6cbf0a8c2ab
301.
301
e) Higher chargerevenue (for pension schemes): Given that net investment returns
increase for members, enabling them to build larger pension pots, this increases the
charge revenue received by pension schemes. These are indirect benefits, requiring
pension schemes to either pass on lower investment fees as lower charges, or
diversify their portfolios to invest in wider asset classes, thus enabling the increases in
net investment returns for members that can enable this higher charge revenue.
146. These scale benefits have been modelled to begin from 2030. This is despite
consolidation being modelled to occur from 2027, at which point scale benefits should
theoretically begin to accrue. However, this assumption has been made to simplify the
modelling, but also as a conservative assumption given that scheme behaviour is unknown
with many other uncertainties also existing. If the consolidation truly all occurs in 2029 in
advance of the minimum AUM thresholds becoming active, then modelling scale benefits
from an earlier point would be overstating the benefits.
Scale allows for lower fees, with these partially passed-on as lower charges to
improve net returns
147. As was discussed in the “Rationale for intervention and intended effects” section of the
Impact Assessment, there is evidence that scale can enable schemes to access lower
investment fees via a number of different mechanisms. It has been modelled that the
benefits accruing from these lower fees are shared between schemes and members, with
schemes retaining a portion of the lower fees as profits, with the remainder passed-on to
members in the form of lower charges to enable higher net investment returns.
148. However, as is explained in more detail below, the size of benefits received, or whether
any benefits are received at all, has been modelled as being dependent on the relative
increase in scale achieved by schemes and members following consolidation activity.
Size of the reduction in fees
149. The Pension Charges Survey 2020531
provides the average ongoing charge for schemes
of different sizes, breaking these down by scheme type. The scheme sizes are separated by
numbers of members, with the largest sizes being “100-999” and “1,000+”. The difference in
charges between these two largest scheme sizes is calculated for both contract-based
schemes (being 0.13%) and Master Trust schemes (0.10%), with the average taken
(0.115%) to reflect there being similar numbers of each scheme type. This value is used to
estimate the reduction in fees.
150. There is a risk that the scheme sizes in the survey differ to the scheme sizes in the
current market, meaning the reduction in charges applied may be inappropriate. However,
schemes have grown since the survey was conducted, with there being large variability in
scheme membership, with some schemes having membership in the low thousands and
some having membership in the millions. Therefore, given this variability in scheme size,
which is significantly larger than that shown by the survey, the charge differential applied is
considered appropriate.
151. An alternative assumption, which was considered but ultimately not utilised, was to use
consultation responses relating to differential pricing. Use of differential pricing was almost
universal among respondents, though only for administration charges, rather than for
investment charges. Various factors were identified to justify the pricing differences,
including some employers requiring higher levels of service and support, hence higher
charges are necessary to cover these costs. However, the importance of employer size on
costs was also noted, impacting economies of scale given that the marginal cost for each
additional employee enrolled is relatively small. Some schemes had wide ranges in charges,
531
https://www.gov.uk/government/publications/pension-charges-survey-2020-charges-in-defined-contribution-pension-
schemes/pension-charges-survey-2020-charges-in-defined-contribution-pension-schemes
302.
302
including from aminimum of around 0.2% to a maximum of around 0.7%. Across responses,
the difference between the 10th
decile charge and the median charge tended to be around
0.15%-0.2%, so larger than the assumed reduction in charges applied within this Impact
Assessment (0.115%). However, the alternative assumption was utilised as it was
determined to be more relevant, with the difference in charges in the Pension Charges
Survey 2020 determined by differences in pension scheme scale, rather than differences in
employer scale as with differential pricing. Nevertheless, this finding highlights the
assumption is a credible estimate.
Summary of the estimated benefits for different groups
152. Before explaining the estimated benefits in more detail, here is a summary of the different
groups that have been modelled to benefit either directly or indirectly from the reduction in
investment fees, as well as the sizes of benefits modelled:
a) Members whose assets are transferred from a smaller scheme (which leaves the
market) into a larger scheme (with sufficient scale to remain in the market): A reduction
in charges and hence increase in net investment returns of 0.115% is modelled,
reflecting that their new scheme should have significantly lower charges than their
current scheme, enabled by their additional scale.
b) Existing schemes with under £50bn in AUM: A reduction in fees of 0.029% is
modelled, which they retain as profit, occurring due to their increase in scale as assets
are transferred into the scheme from those schemes which leave the market. This
reduction is half of the 0.058% reduction in fees they are modelled to receive overall,
with the remainder passed on to members in the form of lower charges.
c) Members of existing schemes with under £50bn in AUM: A reduction in charges and
hence increase in net investment returns of 0.029% is modelled, which is passed on to
them by their scheme.
d) Existing schemes (and members of schemes) with over £50bn in AUM: Benefits are
not monetised, despite these schemes achieving additional scale, with the evidence
suggesting there are likely diminishing marginal returns to additional scale. It is
recognised that these largest schemes may also receive benefits from scale, with this
therefore being a conservative assumption that also simplifies the modelling, rather
than implementing a precise tapering of benefits as scale increases when such a
relationship is ultimately uncertain.
153. It is acknowledged there will likely be a distribution in the size of benefits received by
schemes and members. For example, due to some schemes having a wide range of charges
due to differential pricing, it is possible that some members may receive smaller benefits
than others (if they happen to be transferred into a scheme and receive high charges).
However, those members and schemes receiving smaller benefits are likely to be offset by
those receiving larger benefits, with the averages applied considered appropriate. The
Department will continue to research and monitor the role of differential pricing across the
market as the Pension Schemes Bill measures are implemented.
For the assets to be consolidated into larger schemes
154. For the schemes which are to leave the market, it is assumed that members will
experience a reduction in charges and hence increase in net investment returns equal to the
full 0.115% value calculated from the Pension Charges Survey 2020. This reflects their
assets being moved into a scheme with significantly more AUM than their current scheme.
Regardless of the exact scheme size that the AUM is consolidated into, all the consolidated
AUM is modelled to receive scale benefits, given the significant increases in scale that
occur.
303.
303
155. These benefitsare modelled to be received by members only, given that they all join
much larger schemes, while the providers for these schemes leave the market and do not
receive any benefits.
156. Table 13 shows the AUM that is projected to be consolidated into larger schemes, for
which the projected value grows each year as a result of contributions inflow and investment
returns, with the annual increase in net investment returns for members calculated.
Table 13: The estimated increase in net investment returns for members whose assets
are consolidated into larger schemes, occurring due to them paying lower charges
(2024 prices)
2030 2031 2032 2033 2034
AUM to be consolidated (where scheme exits the market) £71bn £79bn £88bn £99bn £110bn
Increase in net investment returns for members £81m £91m £102m £114m £127m
For the existing assets in larger schemes
157. For the existing assets in larger schemes, which achieve more scale following
consolidation, it has also been modelled that lower investment fees will be accessed, though
only for schemes that have a level of AUM for which the available evidence suggests an
increase in scale can provide benefits. Though this evidence does not suggest one single
optimal size, it does point towards £25-50bn as a level where many benefits could be
achieved. Consequently, it is only the schemes that will remain in the market and are
projected to have under £50bn AUM in 2030 for which scale benefits are estimated. This is
projected to be around half of the schemes which remain in the market, with these being the
smallest of those remaining schemes, with an estimated £236bn of assets across these
schemes in 2030.
158. The scale benefits are modelled to be half of those attained by the assets being
consolidated into the larger schemes, given that the relative increase in scale achieved is
smaller. Therefore, the benefit is modelled as 0.058%. The decision to model the benefits at
half the size is somewhat arbitrary, with the true size of the benefits being received possibly
higher or lower than this, though applying a smaller rate of benefits is appropriate to reflect
the smaller increase in scale. Applying a factor of a half is consistent with other parts of the
Impact Assessment, such as the modelling of the share of benefits between pension
schemes and members (as is explained in the next paragraph) and considered our best
estimate.
159. It is assumed that half of these benefits for the existing assets in larger schemes,
occurring due to lower investment fees, are retained by schemes in the form of higher
profits. The remainder of the benefits have been modelled as being passed on to members
in the form of lower charges, enabling increased net investment returns. The exact share of
these benefits between members and schemes is ultimately unknown, being dependent on
scheme behaviour. For some schemes, who do not operate on a ‘for profit’ basis, the
assumption utilised will overestimate the benefits to pension schemes. However, this may be
counterbalanced by some schemes retaining more of the profits. Consequently, on balance,
this is viewed as a reasonable assumption in the absence of other evidence at this point.
160. The members and schemes that receive these benefits in 2030 are modelled to continue
receiving these until the end of the analysis period (2034), even as scheme AUM grows to
higher levels. Therefore, despite benefits only being monetised for the existing assets in
schemes with AUM under £50bn in 2030, the same members and schemes are modelled to
continue receiving benefits as scheme AUM grows above this £50bn cutoff. ‘Uprating’ of this
cutoff is not carried out, nor are benefits ceased, given the uncertainty existing regarding the
accrual of scale benefits, with the £50bn cutoff applied being supported by evidence but also
not an exact rule.
304.
304
161. As outlinedearlier, across the evidence there are various AUM levels suggested as
providing benefits, with some sources suggesting benefits continue to occur at very high
levels of scale. There is not one single estimated optimal size, though the evidence does
point towards £25-50bn as a level where many benefits can be achieved. The evidence
utilised to produce this range was based on several different years using sources from
multiple different countries, so there was not a fixed time window analysed, with no clear
indication that the ‘optimal range’ would move over time, or the rate at which it would move.
Consequently, any uprating would be arbitrary, so has been avoided.
162. Table 14 shows the estimated benefits from lower fees for the schemes that remain in the
market, as well as the members in these schemes, given the aggregate projected annual
AUM across these schemes. This AUM is aggregated across schemes with under £50bn in
projected 2030 AUM, which are the only schemes for which these benefits are modelled.
Table 14: The estimated scale benefits for pension schemes and members, occurring
either directly or indirectly because of lower investment fees, across schemes that are
projected to remain in the market and have assets consolidated into them (2024
prices)
2030 2031 2032 2033 2034
Existing AUM in schemes, where 2030 AUM < £50bn £236bn £265bn £298bn £335bn £377bn
Reduction in fees for schemes £68m £76m £86m £96m £108m
Increase in net investment returns for members £68m £76m £86m £96m £108m
163. As has already been explored, numerous reports support a reduction in investment fees
being achievable with additional scale, with the size of the estimated benefits being broadly
consistent with those calculated in this Impact Assessment. For example, Toby Nangle's
report532
for The People's Pension found: “The cost of externally managing a 10% allocation
of total Master Trust assets to private markets would be high. Applying external
management costs to the 2030 asset base yields annual fees ranging from £560 million to
£1.5 billion depending on the precise form of outsourcing. Developing high-functioning direct
internal private market management capabilities could reduce this cost significantly.
Reasonable estimates put projected savings to members in the hundreds of millions
of pounds each year.”
Scale can further improve net returns through the diversification benefits of investing
in a wider range of assets, with the potential for these to outperform traditional
portfolios
164. An increase in scale across the multi-employer DC market should enable more schemes
to access the full range of available asset classes. This can be expected to deliver further
net return benefits for members, in addition to the cost savings outlined above. For example,
by accessing a wider range of asset classes, asset allocations at arrangement level are
more diversified, so are better shielded from adverse outcomes.
• This can be seen in the analytical publication released as part of phase one of the
Pensions Investment Review533
. Stochastic actuarial analysis, commissioned from
GAD (Government Actuary's Department) by DWP to support the review, showed a
532
https://peoplespartnership.co.uk/wp-content/uploads/2025/01/Achieving-critical-mass-investing-in-private-markets-
report.pdf
533
See table 5 in: https://assets.publishing.service.gov.uk/media/673f3ca459aab43310b95a8d/pension-fund-investment-uk-
economy.pdf
305.
305
balanced portfolio withprivate market exposure to outperform a ‘baseline’ portfolio that
was mostly invested in overseas equities. A range of other studies have pointed
towards potentially even greater returns534
.
• This can also be seen in international pensions markets, with Australian DC and
Canadian open DB schemes investing at scale in private markets and often achieving
good average returns from these investments (detailed below).
• In addition to the diversification benefit, which improves risk-adjusted returns, a
selection of publicly available institutional capital market assumptions expect private
market investments to outperform public markets. This outperformance and ‘illiquidity
premium’535
does vary and research can be mixed. However, on balance, it appears
reasonable to expect a returns uplift from the addition of private markets at scale into
the portfolios of DC pension savers.
165. The increase in investment returns through diversification has been modelled as a benefit
purely for members. This is an indirect benefit, as it is dependent on schemes choosing to
diversify their investment portfolios and may be dependent on the type and range of assets
invested in.
166. In the later “Increased charge revenue for pension schemes” section, a benefit for
schemes has been modelled, with this being a further indirect benefit occurring as a result of
the overall increase in net investment returns for members as a result of the scale measures.
Size of the increase in investment returns
167. This Impact Assessment assumes a 0.1% investment return uplift from delivering scale
and the corresponding increased allocations to wider ranges of assets, with this informed by:
• GAD’s stochastic, actuarial analysis referenced above found that a portfolio with
10% private markets allocation outperformed a ‘baseline’ (public markets) portfolio by
2% on a net, risk-adjusted basis over 30 years. The analysis assumed an annual
salary of £30,000 that rises in line with prices and a starting DC pot of £10,000
contributing 8% pension contributions for 30 years. The 2% outperformance is net of
fees, accounting for private market assets being more expensive, with fees assumed
to be 0.25% for all asset classes except for private markets for which a 1% fee is
assumed. The analysis utilised capital market assumptions supplied by Moody’s, with
these assumptions projecting the level of future returns for different asset classes.
• When subsequently calculating the annual benefit, if taking a simple division (i.e.
dividing 2% equally across 30 years) or accounting for compound growth (i.e.
calculating the annual growth rate which, when compounded, results in a 2% benefit
over 30 years), the result (when rounded) is a 0.07% annual improvement in net
investment returns from private markets.
• Other countries report high net returns on private market investments, hence
their continued exposures to wider asset classes. For example, the Association of
Superannuation Funds of Australia have said that “Every single Australian with a
superannuation account has benefitted from the sophisticated approach that super
has taken to exposure in private markets …The exposure to private markets has been
a great driver of returns for Australians536
”. Similarly, Hymans Robertson find that,
when comparing the returns of Canadian funds versus the LGPS (Local Government
534
For example: https://www.british-business-bank.co.uk/sites/g/files/sovrnj166/files/2024-02/oliver-wyman-british-business-
bank-the-future-of-defined-contribution-pensions.pdf
535
Illiquidity premium defined as the additional returns an investor receives for holding illiquid (private) assets over and above
that received by holding an ‘equivalent’ public asset.
536
https://www.superannuation.asn.au/media-release/statement-responding-to-asics-discussion-paper-on-the-dynamics-
between-public-and-private-
markets/#:~:text=The%20exposure%20to%20private%20markets,accounts%20for%20real%20people%20retiring.
306.
306
Pension Scheme), “therelatively larger private markets allocation of the Canadian
funds versus the LGPS funds is likely a key contributor to the slightly lower
comparative returns [of LGPS funds]”537
. Australia and Canada have been pensions
markets that successive governments have closely followed to inform UK pensions
policy developments538
.
• Other institutional capital market assumptions assume a greater level of return
from private market assets that scale should allow access to. For example, each of JP
Morgan, Amundi and Blackrock project private markets (including private debt and
infrastructure) to outperform public markets in their publicly available assumptions539
.
This outperformance is often by a larger margin than the 0.07% established above
given that GAD use a different set of capital market assumptions (supplied by
Moody’s). Though any estimate in capital market assumptions are volatile and will be
dependent on fees.
168. Therefore, a range of estimates are available regarding the potential uplift that
diversification can provide. It is also important to recognise that future returns are uncertain,
dependent on scheme behaviour and evidence on private market outperformance can be
impacted by survivorship bias540
.
169. Given the available evidence, it is assumed that higher private market allocations
delivered through scale provide a 0.1% improvement to investment returns. This is
informed by the 0.07% result calculated from the GAD analysis, as well as other institutional
capital market assumptions which often suggest a larger outperformance by private markets.
This rate of return could conceivably improve further over time (i.e. beyond the end of the
appraisal period) as J-curves541
are managed and there is a greater supply of and demand
for domestic private market opportunities.
170. As with the benefits accruing directly or indirectly as a result of lower fees, the size of
benefits received through diversification has been modelled as being dependent on the
relative increase in scale achieved following consolidation activity. The methodology adopted
is also consistent, with this explained in the following sections.
For the assets to be consolidated into larger schemes
171. For the smallest schemes which are to leave the market, it is assumed that members will
experience increases in investment returns through diversification of the full 0.1%.
172. Table 15 shows the AUM that is projected to be consolidated into larger schemes, for
which the projected value grows each year as a result of contributions inflow and investment
returns, with the annual increase in net investment returns for members calculated.
Table 15: The estimated increase in net investment returns for members whose assets
are consolidated into larger schemes, occurring due to investment diversification as
pension scheme scale increases (2024 prices)
2030 2031 2032 2033 2034
AUM to be consolidated (where scheme exits the market) £71bn £79bn £88bn £99bn £110bn
537
https://www.hymans.co.uk/media/uploads/Policy_briefing_note_-_the_Canadian_model.pdf
538
For example, the Chancellor’s 2024 Mansion House speech “… sets out our plans to create Canadian and Australian style-
“megafunds” to power growth in our economy”
539
https://www.blackrock.com/institutions/en-us/insights/charts/capital-market-assumptions ;
https://am.jpmorgan.com/content/dam/jpm-am-aem/global/en/insights/portfolio-insights/ltcma/noindex/ltcma-full-report.pdf ;
https://research-center.amundi.com/article/capital-market-assumptions-2024
540
“Survivorship bias” is where the assessment of an asset is determined only by the performance of existing assets in the
market, discounting those that have previously left the market.
541
“J-curves” are the pattern that private investments often follow, whereby they initially experience lower returns before
outperforming in the long-run, thus a curve plotting their returns may appear similar to the letter “J”.
307.
307
Increase in netinvestment returns for members £71m £79m £88m £99m £110m
For the existing assets in larger schemes
173. For the existing assets in larger schemes, which achieve more scale following
consolidation, diversification benefits have also been modelled, though again only for the
members in schemes that are sufficiently small that the available evidence suggests an
increase in scale can provide benefits. Consistent with the approach applied with lower
investment fees, it is only the schemes that will remain in the market and are projected to
have under £50bn AUM in 2030 for which scale benefits are estimated.
174. The increase in investment returns is modelled to be half of those attained by the assets
being consolidated into the larger schemes (so 0.05%), given that the relative increase in
scale is smaller. This is consistent with the benefits modelled to accrue from the reduction in
investment fees, where the existing assets in larger schemes were also modelled to receive
half the level of benefits.
175. Table 16 shows the estimated benefits from diversification for the members of schemes
that remain in the market, given the aggregate projected annual AUM across these
schemes.
Table 16: The estimated scale benefits for members, occurring due to investment
diversification, across schemes that are projected to remain in the market and have
assets consolidated into them (2024 prices)
2030 2031 2032 2033 2034
Existing AUM in schemes, where 2030 AUM < £50bn £236bn £265bn £298bn £335bn £377bn
Increase in net investment returns for members £118m £133m £149m £167m £188m
Increased charge revenue for pension schemes
176. As a result of pension scheme scale, members are modelled to receive higher net
investment returns. As explained previously, this occurs due to a combination of lower
charges, passed-on by schemes as a result of lower investment fees being paid, and also
through higher investment returns resulting from diversification. This means that savers can
be expected to benefit from larger pension pots.
177. An indirect benefit of these larger pension pots is an increase in charge revenue for
pension schemes, given that charges are set as a percentage of pot value. To calculate the
scale of these charge revenues, the Pension Charges Survey 2020542
has been utilised, with
this showing average ongoing charges for the largest GPPs and Master Trusts to be around
0.4% of funds under management.
178. Table 17 shows the estimated aggregate annual increase in net returns for members as a
result of the scale measures, aggregating the results from Tables 13-16. Below that, Table
18 shows the estimated additional charge revenue for pension schemes, having applied the
0.4% charge value to the outputs from Table 17, with the charges applied on an annual
basis.
542
https://www.gov.uk/government/publications/pension-charges-survey-2020-charges-in-defined-contribution-pension-
schemes/pension-charges-survey-2020-charges-in-defined-contribution-pension-schemes
308.
308
Table 17: Asummary of the estimated aggregate annual increase in net returns for
members as a result of the scale measures (2024 prices)
Source of increase in net investment returns 2030 2031 2032 2033 2034
Lower charges, for members joining larger schemes £81m £91m £102m £114m £127m
Lower charges, for existing members in larger scheme £68m £76m £86m £96m £108m
Diversification benefits, for members joining larger schemes £71m £79m £88m £99m £110m
Diversification benefits, for existing members in large
schemes
£118m £133m £149m £167m £188m
Total £339m £379m £425m £476m £534m
Table 18: The estimated increase in annual charge revenue for pension schemes
(2024 prices)
2030 2031 2032 2033 2034
Increases in net investment returns for members £339m £379m £425m £476m £534m
Additional charge revenue for pension schemes £1m £2m £2m £2m £2m
Overall benefits for members and pension schemes
179. Table 19 below shows the total scale benefits estimated for members and pension
schemes, being the sum of the benefits identified in Tables 13-16 and Table 18.
Table 19: The total estimated scale benefits for members and pension schemes (2024
prices)
2030 2031 2032 2033 2034
Total scale benefits for pension schemes £69m £78m £87m £98m £110m
Total scale benefits for members £339m £379m £425m £476m £534m
Total £408m £457m £512m £574m £644m
Benefits to employers
180. Given there will be fewer, larger schemes in the market, selecting a pension scheme for
their employees will be easier, with less schemes to consider the merits of. However, these
benefits of lower search costs are likely small, with current evidence finding that cost and
convenience to the employer dominate decision-making when selecting pension schemes.
Also, employers actively switching to better performing schemes is rare, with only 5% of
employers offering a DC pension having done so543
. Therefore, these benefits have not been
monetised.
Benefits to regulators
181. Once the market reaches its new consolidated state, costs of regulation will likely fall, with
fewer schemes needing to be monitored. Also, given the improved governance that evidence
suggests larger schemes can access, there may be a reduction in enforcement activity due
543
See table 7.3 and 7.4: https://www.gov.uk/government/publications/department-for-work-and-pensions-employer-survey-
2022/department-for-work-and-pensions-employer-survey-2022-research-report#pensions
309.
309
to non-compliance withpensions legislation. Consistent with the prior exploration of the
“Cost to regulators”, these benefits have not been monetised.
Sensitivity Analysis
182. Given the risks that exist regarding many of the assumptions utilised, sensitivity analysis
has been conducted, varying the assumptions to observe the impacts on the estimated costs
and benefits.
183. As was seen in the summary of costs and benefits in Table 5, the most significant
monetised items were (i) ‘consolidation costs’, (ii) the benefits accruing to providers and
members as a result of lower fees (enabling lower charges and higher net investment
returns), and (iii) the increases in net investment returns as a result of diversification.
Consequently, assumptions relating to these items have been varied.
184. When conducting the sensitivity analysis, 50% adjustments have been utilised, with these
adjustments purposely made to be larger than many of the ranges initially suggested by the
available data sources, reflecting the uncertainty present. For example, for consolidation
costs, the average consultation response was determined to be 0.15% to 0.2% of the value
of assets being transferred. However, a wider range of 0.1% to 0.3% has been utilised when
varying this assumption. This reflects that some responses did fall outside of the central
0.15% to 0.2% range, with responses also not providing complete market coverage,
meaning they could be unrepresentative of the entire market. The 50% adjustment has been
utilised across all the assumptions that have been varied, with this providing consistency
across the sensitivity analysis. The wide range also reflects the challenges of needing to
utilise commercially sensitive information throughout the Impact Assessment, with this data
often being less readily available and with smaller sample sizes than would be preferred.
• Consolidation costs: These were assumed to be 0.2% of the value of AUM
consolidated. This assumption has been increased/decreased by 50% in the low/high
scenarios, with 0.1% and 0.3% the values utilised. This reflects the various ranges
suggested from providers in the consultation.
• Lower fees (enabling lower charges): For the AUM consolidated into larger schemes,
the increase in net investment returns was assumed to be 0.115% of the AUM
consolidated, with all benefits being for members. For the AUM in existing schemes
with AUM under £50bn, which achieve additional scale following consolidation, a
benefit of 0.058% was assumed, with these benefits modelled to be shared by pension
schemes and members. These assumptions have also been adjusted by 50%, being
decreased in the low scenario and increased in the high scenario.
• Higher returns through diversification: For the AUM consolidated into larger
schemes, the increase in investment returns was assumed to be 0.1% of the AUM
consolidated. For the AUM in existing schemes with AUM under £50bn, a benefit of
0.05% was assumed. These assumptions have again been adjusted by 50%, being
decreased in the low scenario and increased in the high scenario.
185. Table 20 shows the itemised costings in the low, central and high scenarios. Note that,
although the assumption was not adjusted regarding the additional charge revenue that
pension schemes receive, being 0.4% of the increase in net investment returns for
members, this charge revenue does vary across scenarios due to the net investment returns
of members varying.
186. The overall net present values range from +£847m to +£2,976m, with the wide range
indicating the sensitivity of the estimations to the assumptions utilised. However, in all
scenarios the policy is modelled to have a net benefit.
310.
310
Table 20: Resultsof sensitivity analysis. Costings show net present value over the 10-
year appraisal period. The “Low Estimate” combines the higher estimate of costs and
lower estimate of benefits, while the “High Estimate” combines the lower estimate of
costs and higher estimate of benefits.
Impact Low Estimate Central Estimate High Estimate
Familiarisation Costs
(for Pension Schemes)
£4m £4m £4m
Search Costs (for
Pension Schemes)
£8m £8m £8m
Consolidation Costs
(for Pension Schemes)
£154m £103m £51m
Lower Investment Fees
(for Pension Schemes)
£170m £339m £509m
Increased Net
Investment Returns via
Lower Charges (for
Members)
£371m £741m £1,112m
Increased Returns
through Diversification
(for Members)
£470m £939m £1,409m
Increased Charge
Revenue (for Pension
Schemes)
£3m £7m £10m
Net Benefit £847m £1,911m £2,976m
Risks and assumptions
187. Key risks and assumptions have been covered throughout the IA. The main areas of risk
are listed and RAG-rated below (Red = significant analytical/policy risk or significant driver of
IA modelling; Green = low impact risk or assumption and/or unlikely to significantly impact IA
modelling):
Analytical risks/assumptions:
188. AUM growth rates (Red): To project future scheme AUM values, AUM growth rates must
be assumed:
• For Master Trusts, historic AUM data is available from the Go Pensions “DC Master
Trust League Tables”544
. From this, annual AUM growth rates over the prior two years
have been calculated for each scheme, though the industry average has been utilised
for the individual schemes whose AUM growth rates were deemed to be a significant
outlier. A two-year period was chosen so as to not overlap with the Covid-19
pandemic, with this not considered a representative period suitable to be used for
forecasting.
• However, to project future Master Trust AUM values, these growth rates have been
halved, with a 13% average (mean) growth rate across schemes. This accounts for the
fact that longer-term Master Trust AUM growth rates are highly likely to be lower, with
this supported by a couple of factors. Firstly, given that Master Trusts are a relatively
544
https://go-group.co.uk/dc-master-trust-league-table-2024-h2/
311.
311
recent phenomenon, havingonly been in existence for around a decade545
, a higher
proportion of members will soon be entering retirement. This should lead to a slowing
of AUM growth, with these members ceasing making additional contributions and
instead beginning to withdraw funds. Alongside this, there has been a strong stock
market rebound since the Covid-19 pandemic, which may not necessarily hold in the
long-term. Adjusting growth rates downwards is also a conservative assumption,
accounting for the nature of compounding, whereby outcomes are extremely sensitive
to growth rates. Therefore, a small error in assumed growth rates would have a
significant impact, negatively influencing the accuracy of the projections.
• For GPPs, annual AUM growth of 10% has been assumed across all schemes. Given
that less time-series data exists than for Master Trusts, this reflects sensible
assumptions on investment returns and contributions. This was also validated by
comparing to the growth amongst GPPs for which data does exist, with data sources
including the Chair Statements published by schemes, with this also showing around
10% annual growth over recent years.
189. Given the length of the time period analysed, these growth rates are sensitive
assumptions, with small changes having a large impact on results in the later years. There is
an additional risk that, particularly for GPPs, that there is limited evidence to inform these
growth rates. However, the approach adopted is considered robust given the available
information.
190. As means of validation, the resulting AUM projections calculated were found to be
broadly consistent with other sources, including the PPI’s ‘DC Future Book’546
, supporting
the appropriateness of the growth rate assumptions utilised. Also, despite projected AUM
values being very sensitive these growth rates, there was found to be a relatively limited
impact on the number of schemes projected to be leaving the market when varying these,
with schemes generally projected to have AUM levels either far higher or far lower than the
thresholds.
191. Consolidation costs (Red): To assign a value to the cost of consolidating assets,
consultation responses have been utilised relating to provider experiences of combining
default funds and arrangements together within the same organisation. This does pose a
risk, given that the question used related to the internal consolidation of assets by an
individual pension scheme, rather than the consolidation of assets between schemes.
192. Responses gave an indication of the costs of consolidation, with transaction costs being
noted as the main cost. Though a range of estimates were provided for these costs, the
average response was determined to be 0.15% to 0.2% of the value of assets being
transferred. Alongside transaction costs, various other costs were noted including legal,
consultancy and communication costs, though the scale of these costs was less readily
provided. Given these ‘other costs’ are harder to monetise, the overall cost of consolidation
is assumed to be 0.2% of the value of assets transferred, being at the higher end of the
estimated value of transaction costs. Utilising the upper limit of the range is a conservative
approach, taken due to the amount of uncertainty present while also attempting to account
for the other costs.
193. Size of the reduction in investment fees (Red): The Pension Charges Survey 2020547
provides the average ongoing charge for schemes of different sizes, breaking these down by
scheme type. The scheme sizes are separated by numbers of members, with the largest
sizes being “100-999” and “1,000+”. The difference in charges between these two largest
scheme sizes is calculated for both contract-based schemes (being 0.13%) and Master Trust
schemes (0.10%), with the average taken and used to estimate scale benefits.
545
https://www.thepensionsregulator.gov.uk/en/media-hub/speeches-and-speakers/the-evolution-of-master-trust-supervision
546
https://www.pensionspolicyinstitute.org.uk/media/hbrgvfw5/20240926-the-dc-future-book-2024-final.pdf
547
https://www.gov.uk/government/publications/pension-charges-survey-2020-charges-in-defined-contribution-pension-
schemes/pension-charges-survey-2020-charges-in-defined-contribution-pension-schemes
312.
312
194. There isa risk that the scheme sizes in the survey differ to the scheme sizes in the
current market, meaning the reduction in charges applied may be inappropriate. However,
schemes have grown since the survey was conducted, with there being large variability in
scheme membership, with some schemes having membership in the low thousands and
some having membership in the millions. Therefore, given this variability in scheme size,
which is significantly larger than that shown by the survey, the charge differential applied is
considered appropriate.
195. For the smallest schemes which are to leave the market, it is assumed that members will
experience a reduction in charges equal to this value (0.115%).
196. For the existing assets in larger schemes, which achieve more scale following
consolidation, it has also been modelled that lower investment fees will be accessed, though
only for schemes that are sufficiently small that the available evidence suggests an increase
in scale can provide benefits. Though this evidence does not suggest one single estimated
optimal size, it does point towards £25-50bn as a level where many benefits could be
achieved. Consequently, it is only the schemes that will remain in the market and are
projected to have under £50bn AUM in 2030 for which scale benefits are estimated. These
scale benefits are modelled to be half of those attained by the assets being consolidated into
the larger schemes (so 0.058%), given that the relative increase in scale is smaller.
197. These are sensitive assumptions, with small changes having a large impact upon
monetisation. It is assumed that half of these benefits are retained by schemes, due to the
lower investment fees, with the remainder of the benefits passed-on to members in the form
of lower charges, enabling increased net investment returns. The exact share of these
benefits between members and schemes is ultimately unknown, being dependent on
scheme behaviour. For some schemes, who do not operate on a ‘for profit’ basis, the
assumption utilised will overestimate the benefits to pension schemes. However, this may be
counterbalanced by some schemes retaining more of the profits. Consequently, on balance,
this is viewed as a reasonable assumption.
198. Size of the diversification benefits (Red): A range of estimates are available regarding
the potential uplift that diversification can provide. Alongside there being a range of
estimates, it is also important to recognise that future returns are uncertain, being dependent
on scheme behaviour, with evidence on private market outperformance impacted by
survivorship bias548
. The key insights utilised to inform the size of the estimated benefits are:
• Stochastic, actuarial analysis, commissioned from GAD (Government Actuary's
Department) by DWP to support phase one of the Pensions Investment Review549
.
This found a portfolio with 10% private markets allocation to outperform a ‘baseline’
(public markets) portfolio by 2% on a net, risk-adjusted basis over 30 years. When
subsequently calculating the annual benefit, if taking a simple division (i.e. dividing 2%
equally across 30 years) or accounting for compound growth (i.e. calculating the
annual growth rate which, when compounded, results in a 2% benefit over 30 years),
the result (when rounded) is a 0.07% annual improvement in net investment returns
from private markets.
• Many institutional capital market assumptions expect a long-term premium for holding
the wider alternative asset types that scale should allow access to. For example, each
of JP Morgan, Amundi and Blackrock project private markets (including private debt
and infrastructure) to outperform public markets in their publicly available assumptions.
This outperformance is often by a larger margin than the 0.07% established by GAD,
given that GAD use a different set of capital market assumptions (supplied by
Moody’s).
548
“Survivorship bias” is where the assessment of an asset is determined only by the performance of existing assets in the
market, discounting those that have previously left the market.
549
See table 5 in: https://assets.publishing.service.gov.uk/media/673f3ca459aab43310b95a8d/pension-fund-investment-uk-
economy.pdf
313.
313
199. Given theavailable evidence, and taking into account the uncertainty present, a
conservative assumption is adopted that higher private market allocations delivered through
scale provide a 0.1% improvement to investment returns. This rate of return could
conceivably improve further over time (i.e. beyond the end of the appraisal period) as J-
curves550
are managed and there is a greater supply of and demand for domestic private
market opportunities.
200. As with the benefits accruing directly or indirectly as a result of lower fees, the size of
benefits received through diversification has been modelled as being dependent on the
relative increase in scale achieved following consolidation activity. For the AUM consolidated
into larger schemes, the increase in investment returns is assumed to be 0.1% of the AUM
consolidated. For the AUM in existing schemes with AUM under £50bn, a benefit of 0.05% is
assumed, being half the benefit assumed for the assets consolidated into larger schemes.
This is consistent with the assumption utilised for the increase in net investment returns
achieved through a lowering of charges.
201. AUM data (Amber): For schemes with known AUM at the end of 2023, their future AUM
is projected up to 2035. From this, it is projected which schemes will have sufficient scale to
remain in the market, which schemes will leave the market, and how much AUM will be
required to be consolidated into other schemes. For smaller MT/GPPs, generally those
where members are not actively contributing into their pension pots, their current AUM
values are less certain, though information suggests this is low and therefore does not
materially impact the projections.
202. This is a risk, as the modelled benefits and costs of the legislation would be higher if
these schemes were included, given that additional scale would be achieved following
consolidation with additional costs required to carry-out the necessary consolidation activity.
However, it is estimated that the AUM in these schemes is of very low value relative to the
rest of the market, for which a more accurate AUM picture is known.
203. Consolidation at arrangement level (Amber): The preferred option requires multi-
employer DC workplace pension schemes to have (at least) one default arrangement with at
least £25bn AUM by 2030. However, analysis has been carried-out at the scheme level,
despite consultation responses confirming that many schemes contain multiple default
arrangements. Therefore, even though it is projected that a scheme’s AUM may reach
£25bn by 2030, additional work may be required to ensure that at least one of their default
arrangements contains sufficient AUM. For example, they may be required to combine
existing arrangements, with this activity having costs. However, scheme-level analysis is
considered appropriate for several reasons:
a) There is a lack of available data on the breakdown of AUM at arrangement level within
schemes. The consultation did ask providers for information on their existing defaults,
including the number of default arrangements and default funds that they have, as well
as the total AUM across their defaults. However, given that responses were only
provided by a subsection of the market, with the structures of defaults described being
extremely varied, it has been decided that any assumptions regarding the proportion of
funds in default arrangements could be extremely inaccurate.
b) As well as arrangement-level data being less readily available, utilisation of it would
require additional assumptions regarding merging activity, with the pattern that this
would take extremely uncertain.
c) Given the time lag between the proposed legislation being announced and the
minimum AUM thresholds coming into effect, schemes will have time to adjust,
allowing them to direct funds into their largest default(s). Consequently, it is less likely
that they will be required to carry-out a significant restructuring close to 2030, moving
funds from smaller arrangements into their largest arrangement(s). Therefore, it is
550
“J-curves” are the pattern that private investments often follow, whereby they initially experience lower returns before
outperforming in the long-run, thus a curve plotting their returns may appear similar to the letter “J”.
314.
314
assumed that anycosts accrued from the consolidating of arrangements will be
minimal.
d) Given the level at which the minimum AUM thresholds have been set, many schemes
are projected to have far higher AUM levels. Consequently, it is considered extremely
unlikely that at least one of their arrangements would not have AUM higher than the
proposed thresholds. Consultation responses also illustrated that, across most
schemes, there is a large concentration of AUM within one or two default
arrangements.
204. Determining the schemes that funds are consolidated into (Amber): For the schemes
that have been modelled to leave the market, it is assumed that their AUM is equally likely to
be consolidated into each of the 15-20 schemes of scale that remain in the market, with the
AUM shared equally across them. Therefore, of the £70bn AUM to be consolidated, each of
the 15-20 schemes is modelled to receive around £4bn.
205. It is expected that the actual market reaction will differ to this, with each scheme leaving
the market being consolidated into a single other scheme, meaning the AUM consolidated
into some schemes will be higher than the £4bn average (for example, where a scheme
leaving the market is projected to have £10bn of AUM). However, given the uncertainties
already explained regarding the AUM projections, as well as the uncertainties regarding the
exact consolidation patterns that will occur, equal consolidation across schemes is adopted
as a simplifying assumption. It was considered whether the AUM should be consolidated in
proportion to the sizes of the remaining schemes in the market, so with the larger schemes
receiving more AUM, though this is once again uncertain.
206. Years of costs and benefits (Amber): It is uncertain which years the monetised costs
and benefits will truly occur in, with this determined by the behaviour of pension schemes. It
has been assumed that:
• Familiarisation costs will occur in the first year following introduction of the legislation
(2025).
• Consolidation costs will be shared equally across the three years preceding the
minimum AUM thresholds becoming active. Therefore, these are split between 2027,
2028 and 2029. The consolidation is modelled such that, given the value of AUM that
is projected to require consolidation in 2030, that one third of its projected value is
assumed to be consolidated in each of these years. Given projected AUM growth, the
value of the AUM that must have been consolidated in 2030 is £70bn. The AUM
across these same schemes is projected to be £51bn in 2027, with one third of this
(£17bn) therefore modelled to be consolidated in 2027. Consequently, the amount
modelled to be consolidated in 2027 is lower than the amount consolidated in 2028
(£19bn), and even lower than the amount consolidated in 2029 (£21bn).
• Search costs will occur in the same years as the consolidation costs. However, these
costs are assumed to be equal across 2027, 2028 and 2029 (i.e. they do not vary to
account for AUM growth as the consolidation costs do).
• Scale benefits have been modelled to begin from 2030. This is despite consolidation
being modelled to occur from 2027, at which point scale benefits should theoretically
begin to accrue. However, this assumption has been made simplify the modelling, but
also as a conservative assumption given that scheme behaviour is unknown with many
other uncertainties also existing. If all the consolidation truly occurs in 2029 in advance
of the minimum AUM thresholds becoming active, then modelling scale benefits from
an earlier point would be overstating the benefits.
207. Pension scheme charges data (Amber): The benefits of consolidation, occurring in the
form of lower investment fees, are estimated using the Pension Charges Survey 2020551
.
551
https://www.gov.uk/government/publications/pension-charges-survey-2020-charges-in-defined-contribution-pension-
schemes/pension-charges-survey-2020-charges-in-defined-contribution-pension-schemes
315.
315
The age ofthe data results in some risk. However, given this is the highest quality data
source available and robustness of the methodology implemented and the sample size
achieved, it has been preferred to alternative data sources.
208. Duration of scale benefits (Amber): The members and schemes that receive scale
benefits in 2030 are modelled to continue receiving these until the end of the analysis period
(2034), even as scheme AUM grows to higher levels. Therefore, despite benefits only being
monetised for the existing assets in schemes with AUM under £50bn in 2030, the same
members and schemes are modelled to continue receiving benefits as scheme AUM grows
above this £50bn cutoff. ‘Uprating’ of this cutoff is not carried out, nor are benefits ceased,
given the uncertainty existing regarding the accrual of scale benefits.
209. As explained earlier, across the evidence there are various AUM levels suggested as
providing benefits, with some sources suggesting benefits continue to occur at very high
levels of scale. There is not one single estimated optimal size, though the evidence does
point towards £25-50bn as a level where many benefits can be achieved. The evidence
utilised to produce this range was based on several different years using sources from
multiple different countries, so there was not a fixed time window analysed, with no clear
indication that the ‘optimal range’ would move over time, or the rate at which it would move.
Consequently, any uprating would be arbitrary, so has been avoided.
210. Accounting for consolidation that would have occurred anyway (Green): In a ‘do
nothing’ scenario, it is possible that some multi-employer DC schemes may have
consolidated by 2030. Only the consolidation that is prompted by the implementation of the
scale legislation should be monetised, with this ‘natural consolidation’ discounted. However,
given such consolidation is rare, it is assumed that no existing schemes would have left the
market unless necessitated by the scale measures. Consequently, all consolidation that is
modelled to occur is monetised.
211. Familiarisation costs data (Green): Familiarisation costs are estimated using an FCA
survey of the contract-based market. The survey related to the impacts of implementing the
proposed Value for Money (VfM) framework. It is assumed that the contract-based market is
representative of the entire multi-employer DC market, with trust-based schemes facing
similar costs. This does not seem unreasonable given evidence that many providers operate
in both markets, particularly the largest providers with whom most DC assets are held,
meaning business models in the trust-based and contract-based markets are often
comparable. There is a risk that familiarisation costs will be different for the VfM legislation
and the scale legislation. However, steps have been taken to limit this risk, including the
weighting of costs by scheme size, accounting for the scale measures being limited to the
larger multi-employer DC schemes. Overall, the familiarisation costs are estimated to be of
far smaller value than other costs and benefits, resulting in this assumption having a
relatively low impact.
212. Search costs data (Green): Search costs, like familiarisation costs, have been
appropriated from analysis relating to alternative proposed private pensions measures.
Specifically, those measures intend to place duties on DC occupational pension schemes to
provide each member of their scheme support at the point of decumulation. Through industry
engagement, including roundtables and one-to-one meetings with pension schemes,
‘partnering costs’ were estimated by scheme size, being the costs that would be incurred by
smaller schemes when partnering with Master Trusts to provide decumulation solutions for
their members.
213. Such partnering activity appears analogous to the search activity that must be carried-out
by smaller schemes following implementation of the scale legislation, with them also being
required to select and engage larger schemes. Consequently, it is assumed that the costs
will be similar. Overall, like the familiarisation costs, the search costs are estimated at far
lower value than other costs and benefits, likewise resulting in this assumption having a
relatively low impact.
316.
316
Policy risks/assumptions:
214. Reductionin market competition (Amber): There is a risk that excessive consolidation
reduces competition in the market, removing the pressure on schemes to innovate to lower
charges and improve investment performance or product offerings.
215. This risk could be amplified by the schemes with AUM currently under the proposed
thresholds becoming less attractive to employers, reducing their inflows of additional
members and making it less likely that they can grow their AUM to meet the thresholds.
Consequently, they may be more likely to be required to leave the market, with the result
again being a loss of market competition.
216. However, the AUM thresholds are set at a level that, at least initially, is projected to
enable a significant number of schemes to remain in the market. If considering longer time
horizons, the risk does increase, though there will be opportunities to review the policy over
such time horizons. Consequently, this is not considered a material risk, with this detailed
further in the “Wider impacts” section.
SaMBA (small and micro business assessment)
Exemptions
217. The scale measures are focused on pension schemes, rather than on businesses in the
wider economy. Pension schemes are different to many other businesses as they may hold
significant assets but do not necessarily employ large number of employees.
218. To be consistent with the Pensions Dashboard Impact Assessment552
, as well as with
other Pension Schemes Bill measures, small and micro businesses are defined as DC
schemes having fewer than 1,000 members. This is an imperfect definition of a small/micro
business, given that scheme size and employer size do not perfectly correlate, though best
attempts to estimate the impact on smaller schemes.
219. Given the scale measures are limited to multi-employer DC schemes, there are
estimated to be zero pension schemes that meet the definition of being a small or
micro business that are also impacted by the measures. Data on scheme membership is
not readily available for GPPs, though it is more widely available for Master Trusts, with all
such schemes for which membership is known being larger than the 1,000-member cutoff.
Given Master Trusts are a more recent phenomenon, having only been in existence for
around a decade553
, it seems likely that all GPPs will also be of such a scheme size, having
had longer to accrue members and assets.
220. Therefore, even though small and micro businesses are not exempt, the scale measures
will not impact them given the policy is restricted to multi-employer schemes. This differs to
some of the other measures within the Pension Schemes Bill, which unlike the scale
measures do impact the smaller single employer trusts.
Proportionality
221. Given no small or micro pension schemes are impacted by the scale measures, there is
also no disproportionate impact upon them.
222. Considering businesses in the wider economy, smaller employers do more commonly
enrol their employees into multi-employer pension schemes, particularly Master Trusts. It is
larger employers who are more likely to operate a single employer trust, with these out of
scope for the legislation.
223. Therefore, given the large monetised benefits of the scale measures for members of
multi-employer pension schemes, employees of smaller employers could be expected to
552
Pensions Dashboards Impact Assessment https://www.legislation.gov.uk/ukia/2022/81/pdfs/ukia_20220081_en.pdf
553
https://www.thepensionsregulator.gov.uk/en/media-hub/speeches-and-speakers/the-evolution-of-master-trust-supervision
317.
317
disproportionately experience thesebenefits. Consequently, given that they are modelled to
receive higher net investment returns, they should be able to accumulate larger pension
pots, enabling improvements in retirement income adequacy.
224. The scale measures also have potential benefits and costs for businesses in the wider
economy, impacting businesses other than pension schemes. For the reasons explained
earlier in the Impact Assessment, including the uncertainty present, these have not been
monetised. Again, it could be expected that smaller employers would disproportionately be
impacted (in terms of both benefits and costs) as a result.
Mitigations
225. There are no existing small or micro pension schemes that are impacted, with mitigations
therefore not being required for them.
226. However, it is possible for new schemes to enter the market, with these meeting the
definition of a small or micro scheme given they will have zero members at inception. As has
already been explained, the scale measures account for the need for new entrants to be
able to enter the market. They can enter the market provided they demonstrate that they
have a credible plan to grow their default arrangement to meet the minimum scale of £25bn.
Unlike for existing schemes, who must have at least £10bn of AUM to be able to apply to be
on this ‘transition pathway’, there is no initial requirement for minimum scale for new
entrants.
Potential wider benefits for small and micro businesses
227. For small and micro businesses in the wider economy, the scale measures provide
several potential benefits. As was explained earlier in the Impact Assessment, these have
not been monetised.
228. Firstly, for the businesses themselves, selecting a pension scheme for their employees
will be easier, given there will be fewer, larger schemes in the market. Alongside this, given
evidence that larger pension funds are more readily able to access private market asset
classes, including venture capital, the legislation could promote additional investment in
smaller businesses.
229. Alongside these potential benefits to smaller business, as has already been discussed,
there are also the more tangential benefits to the employees of these businesses.
Potential wider costs for small and micro businesses
230. The scale measures also provide several potential costs for small and micro businesses
in the wider economy, though like the potential wider benefits, these have also not been
monetised.
231. Firstly, though a market with fewer, larger schemes should simplify the selection of
pension scheme for employers, this may come at the expense of choice. Also, though this is
considered extremely unlikely, it is possible that a reduction in the size of the market allows
the remaining schemes to newly implement or raise administration fees paid by employers to
set-up schemes (with many schemes not currently charging such fees).
232. Alongside this, administration processes for employers could become more difficult,
particularly if they previously had a favourable bespoke arrangement with a scheme, with
their employees instead moved to a more general arrangement because of the measures. In
addition, for all employers whose employees are transferred to a new scheme, there may be
short-term costs to adjust to changes in administrative processes.
233. Also, given that the proposed measures do not actually force schemes below the
thresholds to consolidate, some schemes may remain in the market despite being unable to
receive AE contributions. Though this is considered unlikely, this may require additional
318.
318
costs to beincurred by some employers, with them needing to find an alternative scheme for
their employees in order to meet their own AE duties554
.
Wider impacts
234. The policy is expected to have a material impact on the DC workplace pension market,
while also supporting the Government’s aims of accelerating economic growth and
increasing investment in the UK. These impacts are discussed in more detail below.
Competition and innovation
235. While there is no empirical estimate for the ‘optimal’ number of pension schemes within a
market, a large amount of consolidation could decrease competition by limiting the number
of participants in the market to significantly fewer numbers. There is a risk that such a
market could limit innovation more so than if the current range of market participants and
barriers to entry were maintained. This might impact member outcomes, for example, if
innovative solutions to improve service quality or new investment strategies are not pursued.
This may be the case if schemes who are already at scale are confident of their continued
place in the market, so feel no pressure to innovate. The few remaining schemes may
therefore be less incentivised to improve and be less exposed to competitive pressure from
below from new, innovative or creative ‘disruptor’ smaller schemes.
236. However, the AUM thresholds to be met are set at a level that, at least initially, is
projected to allow a significant number of schemes to remain in the market. Therefore, it is
not expected to be monopolistic or oligopolistic under any standard definition of the terms. If
competition and innovation risk does materialise, there will be periodic opportunities to
review the policy.
237. Moreover, the current DC market is already concentrated - with fierce competition already
between the largest 5-10 schemes (with 58% of DC trust assets in the largest 5 Master
Trusts and 75% in the top 10, with membership even more concentrated555
). The
incorporation of the ‘new entrant pathway’ into the scale measures should also help to
maintain competitive pressures on incumbents, fostering innovation. Alongside this, the
Value for Money (VfM) framework is another Bill measure attempting to ensure competition
is maintained between schemes even in a ‘megafunds’ market.
Diverse investments able to support UK economic growth and capital markets
238. By achieving scale in the DC market, pension funds should be able to access a wider
range of productive asset classes, including infrastructure and other private market assets.
These assets require more direct, expert investment and have closer links to improved
economic growth outcomes.
239. Analysis supporting Phase One of the Pension Investment Review found these wider
asset classes to have a ‘home bias’ when compared to more traditional assets, such as
listed equities. Consequently, a market that is better able to access these assets will,
provided there is an investible supply of opportunities, also invest more in the UK economy.
240. Alongside these benefits, additional inflows into such asset classes and capital markets
could create a virtuous cycle, whereby these markets become deeper, more liquid, and more
efficient. This could in turn improve the attractiveness of UK markets, increasing both the
supply of and demand for investible opportunities across UK markets.
554
Employees must automatically enrol eligible employees into an automatic enrolment pension scheme, also making
contributions to their employee’s pension. Employer duties are explained in more detail here:
https://www.thepensionsregulator.gov.uk/en/document-library/automatic-enrolment-detailed-guidance/resources-employer-
duties-and-safeguards#c9b8c992b9ae41fe9e9ba6cbf0a8c2ab
555
https://www.gov.uk/government/publications/trends-in-the-defined-contribution-trust-based-pensions-market/trends-in-the-
defined-contribution-trust-based-pensions-market#analysing-the-pensions-landscape-and-consolidation-in-the-dc-trust-based-
pensions-market
319.
319
A DC Marketwith greater scale can increase ‘block ownership’ of UK economic assets
241. A market of ‘megafunds’ could be expected to increase ‘block ownership’ of UK economic
assets, making asset ownership less dispersed and more focussed on long-term
performance. Block ownership is where a firm has a shareholder that is able to influence firm
decisions through their voting rights.
242. Ownership of UK firms has become increasingly remote and dispersed over time –
pension funds owned 32% of UK-listed firms in 1992 but this had fallen to under 2% by 2022
as ownership increasingly became overseas556
. This means UK-listed firms often lack a
‘blockholder owner’ that used to be fulfilled by the pension fund. By contrast, Germany has
also seen its listed firms become more overseas-owned, though family owners continue to
be prevalent, meaning its firms still have significant domestic block ownership557
.
243. Achieving scale in the UK DC market means pension funds will have the capacity and
expertise to once again take significant equity stakes and become block owners in
businesses and large-scale projects, such as infrastructure.
244. By having material stakes in domestic firms and projects, pension fund investment can
improve corporate governance, as institutional investors with long-term horizons can engage
more actively with management, promoting sustainable business strategies and improved
performance over short-term shareholder returns558
. Owning such large stakes can also give
enhanced, or more direct, voting rights to the pension fund, further allowing long-term
performance to be prioritised. Given their long-term investment horizon, pension schemes
having larger stakes in critical projects such as renewable energy and digital infrastructure
may also facilitate strategic investment that aligns with national priorities. Therefore, where
this aligns with the interests of members, this would also enable benefits to the wider
economy.
Financial stability and systemic risk
245. The corollary risk to increased block ownership, increased direct investment and a
‘megafunds market’ is systemic, financial risk. For instance, a market of much fewer, but
larger, schemes means each pension scheme becomes a significant market participant as
an institutional investor, both individually and as a collective. The concentration of assets in
fewer schemes therefore adds financial stability risk to the system – there may be less
diversification between schemes, with outcomes more concentrated and correlated.
246. Moreover, if each of these remaining schemes invest in similar assets – a) the scale of
these investments may be so large so as to be ‘market-moving’, distorting prices; b) this may
simply bid-up prices for existing assets over fair value if new investible opportunities do not
match this demand and c) if these investments were to decline quickly in value (for example,
US technology stocks), large parts of the DC pension system could see their portfolios hit
badly, potentially risking a fire-sale of assets, and a vicious cycle that challenges market
liquidity.
247. Regulatory, review and monitoring processes seek to minimise this risk at the financial
services level. Policy design across this, and other Bill measures (such as VfM) are also
seeking to continue to promote diversification and innovative investment strategies. Wider
government policy such as the National Wealth Fund, reforms to the planning system, and
Great British Energy, are also helping to support the supply-side of new investments to
prevent this systemic risk and ensure a diverse pool of opportunity remains.
556
https://www.ons.gov.uk/economy/investmentspensionsandtrusts/bulletins/ownershipofukquotedshares/2022
557
For example, see https://onlinelibrary.wiley.com/doi/10.1111/jacf.12143
558
For example, https://onlinelibrary.wiley.com/doi/abs/10.1002/smj.2629 and
https://www.sciencedirect.com/science/article/abs/pii/S0304405X15001476 show how long-term management orientation can
boost investment and that share buybacks are associated with lower investment levels as managers try to game earnings-per-
share numbers for short-term gains.
320.
320
A market withscale and long-term investment horizons could be well positioned to support
the transition to a low-carbon economy
248. With increased scale, pension funds will be better positioned to drive the green transition
by investing in large-scale renewable energy projects, sustainable infrastructure and green
bonds. Analysis supporting Phase One of the Pension Investment Review found that many
of large schemes’ current private market productive investments were concentrated in this
climate space showing that pension funds are becoming increasingly active in financing the
green transition559
.
249. Pension funds have also been found to be countercyclical investors with long-term
investment horizons560
. This supports the capital-intensive requirements of the transition to a
low carbon economy where a DC market with scale and expertise can allow pension capital
to be deployed effectively to support this.
Wider impacts - equality impacts with respect to the protected characteristics
250. The characteristics that are protected by the Equality Act 2010 are age, disability, gender
and gender reassignment, ethnicity, marriage or civil partnership, pregnancy and maternity,
religion or belief, sexual orientation. A more complete equality impact assessment is
contained within the overarching Impact Assessment, but impacts of the scale measures are
briefly summarised here.
251. Overall, the department does not consider that the proposals materially impact any of the
groups with protected characteristics under the Equality Act 2010 (in Northern Ireland, the
Equality Act is not enacted but other antidiscrimination legislation applies). However, this will
continue to be considered as final policy details emerge.
252. However, it should be noted that religious schemes are excluded from the legislation,
ensuring employees with this protected characteristic have suitable schemes for AE
contributions. Religious funds that are within scheme arrangements would still be expected
to benefit from the scale measures, provided any consolidation activity protects the
continued use of a religious fund (such as Sharia561
). The scheme versus fund equality
distinction is summarised below.
• Religious purpose schemes: Schemes set up wholly on religious (or protected
characteristic) grounds such as the Baptist Pension Scheme, an authorised DC
Master Trust tailored to the Baptist family, are exempt from the legislation. These
schemes may miss out on the benefits of scale available to other schemes due to
their smaller size. However, members likely value their membership in these religious
schemes over any potential scale benefits.
• Religious funds within larger arrangements: Some larger pension providers, such
as Nest and Aviva, have specific Sharia funds within their arrangements. These
providers could use their overall arrangement-level scale (the level at which the
policy operates) to benefit these smaller Sharia funds, allowing them to access the
scale benefits outlined in this Impact Assessment.
559
For example, see paragraph 44 and 47 of
https://assets.publishing.service.gov.uk/media/673f3ca459aab43310b95a8d/pension-fund-investment-uk-economy.pdf
560
https://zaguan.unizar.es/record/63409/files/texto_completo.pdf?version=1
561
Sharia-compliant funds are governed by the requirements of Sharia law and the principles of Islam. For example, a Shariah
compliant fund will not invest in any company that does not follow Shariah principles, such as companies in the gambling,
weapons and defence, and tobacco industries.
321.
321
Monitoring and Evaluation
253.The legislation is likely to cause significant changes and impacts to the multi-employer
Defined Contribution market, impacting some schemes and savers who would likely not
have been impacted if the legislation were not passed. For example, schemes and savers
may be impacted by mergers, acquisitions, market exits, changes to costs and changes to
asset allocations.
254. Given these likely impacts, the importance of a robust monitoring and evaluation plan of
the scale measures is fully recognised and DWP are committed to evaluating the impacts of
the AUM thresholds and consolidation measures.
• These impacts will be monitored over the lifecycle of the policy. Quantitative impacts
will be monitored through interaction with the VfM framework, where time-series data
will be available on scheme performance, and that of their default arrangements, over
time. This data will be able to show how investment returns, charges, services and
asset allocations change over time. Annual data from TPR on the DC landscape will
also provide an opportunity to monitor the extent and pace of consolidation and scale
being achieved in the multi-employer DC market.
• TPR conduct annual quantitative surveys with trustees which can, and already
are, being used to understand the potential impacts, barriers and benefits of
consolidation.
• DWP’s Provider Survey can be used to understand the differences across the
pension landscape on costs/charges and investment performance. The Pension
Charges Survey was conducted in 2020, but DWP have expanded this to include a
wider range of variables in 2025 (to support the Bill passage) and a further survey may
be conducted during implementation to understand progress being made.
• Qualitative research with schemes and members will be considered to understand
how multi-employer schemes are adapting, whether members are aware of changes
being made (and whether they have seen any benefits), and to learn from schemes
about likelihood of meeting the requirements.
• Continued industry engagement, stakeholder roundtables and qualitative research
will be carried-out with providers and employers to understand business impacts,
market dynamics and whether the policy objectives are being achieved effectively.
255. Alongside the above, a complete evaluation of the policy impacts can be completed at the
Post Implementation Review stage, once the AUM threshold deadlines have passed and
consolidation activity has been completed.
256. TPR will continue to monitor the performance and regulatory compliance of trust-based
DC pension schemes, with the FCA doing the same for contract-based DC pensions
schemes. Given the policy’s intention to achieve scale in the DC market through schemes
that are larger and better governed, this should facilitate a more cost-effective regulatory
regime to monitor the remaining schemes.
257. Once the regulatory regime has been implemented, any work conducted will form part of
the regulators’ ‘business as usual’. It is expected that the regulators will seek to take a risk-
based and sectoral approach, in addition to scheme level oversight, setting appropriate
internal thresholds to target non-compliance of schemes under the framework. This will
ensure that TPR and FCA are able to maintain an appropriate level of regulation across its
ongoing duties.
322.
Error! Unknown documentproperty name.
Title: Defined Benefit Superfunds
IA No:
RPC Reference No: RPC-DWP-25032-IA(1)
Lead department or agency: Department for Work and
Pensions
Other departments or agencies:
Impact Assessment (IA)
Date: May 2025
Stage: Final
Source of intervention: Domestic
Type of measure: Primary legislation
Contact for enquiries: Georgia Cryan
Summary: Intervention and Options RPC Opinion: Green (fit for purpose)
Cost of Preferred (or more likely) Option (in 2024 prices)
Total Net Present
Social Value
Business Net Present
Value
Net cost to business per year
Business Impact Target Status
Qualifying provision
£935m £230m £0.1m
What is the problem under consideration? Why is government intervention necessary?
Defined Benefit schemes play a significant role in the UK, supporting almost 9 million members across 5,000 schemes.
Most of these are closed schemes, with fewer than a quarter open to new accruals. Prior to the introduction of
Superfunds, schemes faced two options: either to run-on, with sponsoring employers remaining liable for ensuring their
schemes have sufficient funding (or assets) to meet their liabilities; or to buy-out by securing member benefits through
the insurance market. The latter presents a range of positive spillover effects, such as freeing up sponsoring employers
to focus on their business and increasing the security of member benefits being paid in full. However, many schemes
(around 1 in 2) are currently under-funded on a buy-out basis and some of these would not have an exit route in the
absence of a Superfunds market. Superfunds provide an alternative route for securing member benefits for under-
funded schemes. They are a commercial consolidation vehicle that can take on the liabilities of pension schemes, in
exchange for a significant injection of capital from the ceding employer. Given the potential size of Superfunds (several
billions), it is important an appropriate regulatory framework is created to ensure they are effectively managed to ensure
financial stability and manage risks so that appropriate safeguards are put in place to protect members where there is no
regulation currently in place.
What are the policy objectives and the intended effects?
The policy seeks to protect members; giving them a greater chance of receiving their benefits in full by creating clear
legislative obligations for those setting up and running Superfunds. It will help employers, by providing an alternative way
of discharging their pension liabilities and allowing them to focus on their core business. It will help create regulatory
certainty for new Superfunds to operate. Specifics include:
• To help improve the probability of member benefits being paid in full.
• To ensure schemes are only transferred to a Superfund where there is an improvement to members
• To ensure schemes that can proceed to insurance buy-out fully consider the best outcome for members.
• To provide a new route for sponsoring employers who are unable to buy-out in the insurance market.
• To proactively regulate the risks specific to Superfunds including the replacement of the employer covenant by external
capital and potential commercial interests within the Superfund
What policy options have been considered, including any alternatives to regulation? Please justify preferred
option (further details in Evidence Base)
1. Do nothing (allow Superfunds to establish themselves under existing legislation with TPR overseeing)
2. Subject Superfunds to the same regulatory framework as an insurer
3. Introduce a new Superfund legislative and regulatory framework (Preferred Option)
The government’s preferred option is option 3. Added safeguards are needed to ensure Superfunds are well
managed, financially sustainable, with both members’ pension benefits and the PPF (Pension Protection Fund)
adequately protected. The intention is to introduce parameters within which Superfunds must operate in as well as a new
Superfund authorisation and regulatory supervision regime. Superfunds that have established themselves before this
legislation is in force will be required to seek authorisation from TPR in order to continue to operate.
Will the policy be reviewed? It will be reviewed. If applicable, set review date: May 2030
Does implementation go beyond minimum EU requirements? N/A
Are any of these organisations in scope?
Micro
Yes
Small
Yes
Medium
Yes
Large
Yes
What is the CO2 equivalent change in greenhouse gas emissions? Traded:N/A Non-traded: N/A
I have read the Impact Assessment and I am satisfied that, given the available evidence, it represents a reasonable view of the likely costs,
benefits, and impact of the leading options.
Signed by the responsible Minister: Date:
323.
Error! Unknown documentproperty name.
323
Summary: Analysis & Evidence Policy Option 3
Description: Create a legislative framework and an authorisation regime within which Superfunds could operate. FULL
ECONOMIC ASSESSMENT
Price Base
Year 2024
PV Base Year
2025
Time Period Years 10 Net Benefit (Present Value (PV)) (£m)
Low: -1,669.7 High: 3,559.2 Best Estimate: 935.2
COSTS (£m) Total Transition
(Constant Price) Years
Average Annual
(excl. Transition) (Constant Price)
Total Cost
(Present Value)
Low 1.6 27.4 236.8
High 3.0 243.7 2,096.2
Best Estimate 2.3 134.2 1,154.7
Description and scale of key monetised costs by ‘main affected groups’
Sponsoring businesses: The proposed legislation does not mandate schemes to transfer into a Superfund. All trustees of all
schemes will undertake a degree of familiarisation of the legislative change (around 2 hours of work to familiarise, totalling £1.2m).
All (5,000) DB schemes will review the legislation. However, only around 500 schemes will be in scope (i.e., have a funding level
and covenant group necessary). These will undertake further familiarisation of the new framework, taking around 15 hours of work
(£0.9m). Based on a take-up rate of 25%, it is estimated around 130 schemes would choose to consolidate. These sponsors will
incur implementation costs of approximately £1.2bn.
Superfunds: Costs for financial intermediaries to create a Superfund, such as familiarisation costs (around £800 per Superfund
based on wage assumptions), authorisation fee and scheme running costs. Superfunds will also pay TPR an authorisation fee to
cover associated regulatory costs (estimated at £205,000). Superfunds will be required to pay running costs of the scheme they
take on (around £79 per member); over a 10-year period this is estimated at £45.5m.
Other key non-monetised costs by ‘main affected groups’
Superfunds: There will be additional costs to create a Superfund such as the TPR and PPF levies. However, as these costs are yet
to be determined, these have not been quantified. Setting up a Superfund is ultimately a choice individuals can make – the
legislation does not mandate the creation of any Superfunds.
Insurance industry: If a scheme can afford insurance buy-out, TPR will not permit it to enter a Superfund. It will not, however, be
forced to buy-out - DB schemes are not currently obliged to buy-out and can choose to run-on should they wish. Both approaches
are valid options. As a result, it is not expected to have a material impact on bulk annuity market.
BENEFITS (£m) Total Transition
(Constant Price) Years
Average Annual
(excl. Transition) (Constant Price)
Total Benefit
(Present Value)
Low 68.6 44.5 426.5
High 610.3 395.8 3,795.9
Best Estimate 336.0 217.9 2,089.9
Description and scale of key monetised benefits by ‘main affected groups’
For Sponsoring businesses: Once a sponsoring business has transferred their DB scheme to a Superfund, they will no longer be
required to pay on-going expenses of running a pension scheme (estimated at around £270m).
For Superfunds: Superfunds create a business opportunity for financial intermediaries that deem it to be profitable to enter the
market. It is estimated potential profits to Superfunds of £1.1bn over the ten-year period.
For Members: Entry into a superfund should increase the likelihood of members receiving their pension benefits in full, relative to a
counterfactual where these schemes would face limited prospects for consolidation. This represents a net benefit, in terms of
protected scheme liabilities, to be approximately £705m over the ten-year period.
Other key non-monetised benefits by ‘main affected
Sponsoring businesses: By discharging ongoing DB pension liabilities from their company accounts, sponsoring businesses may
focus strategic resources towards growth opportunities and greater investment into their business.
Insurance industry: Potential business opportunities for the insurance industry to help stimulate both the buy-in and buy-out market,
relative to the counterfactual. These business opportunities would be in the form of insurance companies potentially undertaking
buy-out of Superfunds themselves, either as a whole or subsets/subgroups within the Superfund.
Key assumptions/sensitivities/risks Discount
rate (%)
3.5%
The nature of the current market situation means establishing the counterfactual is not straightforward. TPR has put in place an
interim regime that has led to one Superfund being assessed. But only a legislated framework could set the basis for further
development of a strong Superfund market and providing greater number of Trustees with confidence in Superfunds as a viable exit
approach. In addition, the take-up and pricing level of entering a superfund are very sensitive.
BUSINESS ASSESSMENT (Option 3)
Direct impact on business (Equivalent Annual) £m: Score for Business Impact Target (qualifying provisions only)
£m:
Costs: £0.1m Benefits: £0.0m Net: £0.1m
324.
Error! Unknown documentproperty name.
324
Evidence Base1
Problem under consideration.
Defined Benefit schemes
1. Workplace pensions are split into three markets:
a. Defined Benefit (DB) – This is a type of pension which pays a retirement income based on
earnings, accrual rate, and length of service rather than the amount of money an individual has
contributed to the pension. Of which, the market is further split into:
o public sector DB, where the main funded scheme is the Local Government Pension
Scheme in England and Wales (LGPS) which is made up of 86 Administering Authorities
which operate 87 individual funds in 2023/242
o private sector DB where there were around 5,000 pension schemes in 20243
and one
DB Superfund which exists to support closed DB schemes.
b. Defined Contribution (DC) – This is a type of pension where contributions, made by employees
and sponsoring employers, are invested to create a pension pot at retirement. The DC market is
further split into the:
• trust-based market - A pension scheme governed by a board of trustees who have a
fiduciary duty towards beneficiaries. The board of trustees manage investments on the
members’ behalf. This is regulated by the Pensions Regulator (TPR). In 2025, there were 920
trust-based pension schemes with 12 or more members4
• contract-based market - A pension scheme governed by a provider and an independent
governance committee (IGC) where a contract exists between the individual scheme member
and the provider. This is regulated by the Financial Conduct Authority (FCA). In 2024, there
were estimated to be around 30 firms with an authorised DC workplace pension business5
.
c. Collective Defined Contribution (CDC) – these schemes are an emerging type of pension
scheme based on risk sharing between pension savers. CDCs aim to move the risk away from
the individual (as is the case under Defined Contribution schemes) and away from the employer
(as is the case under Defined Benefit schemes). The only CDC arrangement in the UK so far is a
scheme by the Royal Mail.
2. Collectively, these types of workplace pensions account for over £2 trillion in assets and support tens of
millions of people6
. This makes the UK one of the largest pension markets in the world7
.
3. After the Impact Assessments were completed, more recent information on the DB and DC landscape
became available. The contextual and background information within the IA has been updated to reflect
the latest information. However, it is important to note the calculations are using the previous years’
worth of data. The changes in the landscape are in line with expectations and therefore it would not
materially change the cost or benefits of the policies.
4. DB pensions are backed by a sponsoring employer (“the sponsor”), who is required to fund the scheme
to a level which is expected to allow for the promised benefits to be paid when they fall due, and to put in
place plans should the scheme fall into deficit.
1
All calculations from this point onwards are in 2024 prices.
2
https://www.gov.uk/government/statistics/local-government-pension-scheme-funds-for-england-and-wales-2023-to-2024/local-government-
pension-scheme-funds-for-england-and-wales-2023-to-2024
3
https://www.ppf.co.uk/purple-book
4
https://www.thepensionsregulator.gov.uk/en/document-library/research-and-analysis/occupational-defined-contribution-landscape-2024
5
Corporate Adviser 2024 MT GPP Default Report https://corporate-adviser.com/research/
6
https://www.ons.gov.uk/economy/investmentspensionsandtrusts/bulletins/fundedoccupationalpensionschemesintheuk/october2023tomarch2024
7
https://www.oecd.org/en/data/indicators/pension-funds-assets.html?oecdcontrol-69798b0352-var8=PC_GDP
325.
Error! Unknown documentproperty name.
325
5. The vast majority of private sector occupational DB (workplace) pension schemes are set up as a trust,
run by a group of trustees (the “trustee board”) who manage the assets of the scheme and who have a
duty to act in members’ collective best interests in line with the scheme’s trust deeds and rules.
6. DB Pensions are regulated by the Pensions Regulator (TPR) with the Pension Protection Fund (PPF)
acting as a compensation scheme of last resort by providing compensation to members whose
sponsoring employers become insolvent and where benefits, at least equal to the level of compensation
provided by the PPF, cannot be secured.
The Defined Benefit Landscape8
7. Although fewer than 700,000 people are actively saving into a private sector DB scheme, the sector
remains a significant market within the UK economic landscape. Across around 5,000 schemes, around
9 million members are being supported with assets of around £1.2 trillion.
8. A DB scheme’s funding position is the difference between the assets the scheme holds (based on
contributions and investment return) and the net present value of its liabilities (how much it is expected to
have to pay out to its members). A scheme is in surplus where it holds a greater amount of assets than
liabilities. A deficit is having a lower amount of assets than liabilities. This means improvements in the
funding position can arise through:
o Greater pension contributions for open schemes made by the employee or sponsoring
employer (increasing assets).
o Investment performance from the stock of existing assets (increasing assets).
o Deficit Reduction Contributions (DRCs) made by sponsoring employers to help improve the
funding position of the scheme (increasing assets).
o Higher interest rates which lower the expected value of the liabilities due to be paid out by the
scheme (as liabilities are discounted by a rate of return).
o Lower life expectancies as schemes will have to pay out a pension over a shorter period of time
(lowering liabilities)
9. DB liabilities, however, inherently carry an element of uncertainty as it is impossible to estimate future
longevity or investment returns with certainty. There are a range of DB scheme liability measures, each
designed and used for a specific purpose. They differ in the way the assumptions needed to assess
scheme liabilities (like future investment returns) are made. There are a range of common measures of
liabilities and funding levels used including:
▪ Technical Provisions basis represent the amount a scheme needs to hold in order to meet its
future liabilities. As of 30th
September 2024, almost 4,000 schemes (around 4-in-5 schemes)
were in surplus on a Technical Provisions basis, with these schemes holding over £200bn in
surplus9
.
▪ s.179 Basis which broadly represent what schemes would need to pay an insurer to secure PPF
levels of compensation for their members (which is usually lower than full scheme benefits). The
Purple Book reports, as of 31st
March 2024, around 3,600 schemes were in surplus on a s.179
basis with around £240bn in surplus.
▪ Buy-Out Basis represents what schemes would need to pay an insurer to secure full
compensation (i.e. 100% of scheme benefits) for their members. As of 30th
September 2024,
around 2,400 schemes (around 1-in-2 schemes) were in surplus on a Buy-Out basis, with these
schemes holding almost £100bn in surplus.
▪ Low Dependency Basis set out how much schemes will need to hold in order to minimise
ongoing reliance on financial support from the sponsoring employer by the time they are
significantly mature. This is generally lower than the level required to buy-out. As of 30th
September 2024, around 3,600 schemes were in surplus on a Low-Dependency basis, with these
schemes holding around £160bn in Surplus.
8
Pension Protection Fund. Purple Book 2024. Available at: https://www.ppf.co.uk/purple-book
9
https://www.thepensionsregulator.gov.uk/en/document-library/research-and-analysis/estimated-db-scheme-universe-funding-splits-and-
assets-under-management
326.
Error! Unknown documentproperty name.
326
Table 1: Funding levels across DB landscape (2024)10
S179 (Mar-24) Technical
Provisions
(Sep-24)
Low
Dependency
(Sep-24)
Buy-Out
(Sep-24)
Assets £1,167bn £1,240bn £1,240bn £1,240
Liabilities £948bn £1,033bn £1,103bn £1,233
Funding Ratio 123% 120% 112% 101%
Schemes in Surplus 3,670 3,970 3,620 2,380
Surplus of schemes in surplus £240bn £222bn £163bn £97bn
10. The DB landscape funding position has significantly improved over the last few years. This has been due
to factors such as changing macroeconomic conditions as well as sponsoring employers making Deficit
Reduction Contributions (DRC). Most notably funding levels have improved because of rising interest
rates – the Bank of England rate was 0.25% at the start of 2022 and as of February 2025 is 4.50%11
.
This, along with other economic factors, has contributed towards long-term gilt yields rising (which
lowers estimated DB liabilities through increasing the discount rate being applied) and, as a result, the
aggregate DB scheme funding position has improved significantly. This is demonstrated by the buy-out
funding ratio improving from 62.3% in 2014, to 79.2% in 2022, and is currently estimated by the TPR at
101% as of September 2024.
11. DB schemes may have different strategies and objectives regarding how they are run in the longer-term
(a long-term objective). Currently, DB schemes have the following choices:
a) To run on which means that the sponsoring employer continues to be liable for any changes in
the funding position which may arise. Schemes may opt for a low-risk strategy and seek to reach
low dependency on the sponsoring employer by the time they are significantly mature; or invest
scheme assets with a view to generating a surplus.
b) Buy-out with an insurer - this is a process where a pension scheme transfers its liabilities to an
insurance company. The pension scheme pays a premium to the insurer for the insurer to take on
the responsibility of paying the pensions to the scheme members.
c) To enter a commercial consolidator vehicle such as a Superfund
12. The Department undertook a comprehensive review of the DB system and published a White Paper
‘Protecting Defined Benefit pensions’ in March 201812
. The paper concluded that although DB in general
is not in crisis, the system is highly fragmented with many schemes and their sponsors under significant
financial pressure due to several reasons, including increasing longevity and persistently low investment
returns.
13. TPR’s occupational DB Landscape publication indicates around 92% of schemes are closed to new
members or closed to future accruals13
. But as schemes’ liabilities remain a risk for employers until the
last member is paid - that can be many decades away. This means employers remain liable and
vulnerable to changing funding levels.
14. Many schemes are still not fully funded to be able to afford “buy-out” (where a scheme is passed onto an
insurer) and therefore must continue to manage the risk and uncertainty of managing their pension
10
https://www.thepensionsregulator.gov.uk/en/document-library/research-and-analysis/estimated-db-scheme-universe-funding-splits-and-
assets-under-management
11
https://www.bankofengland.co.uk/monetary-policy/the-interest-rate-bank-rate
12
Protecting Defined Benefit Pension Schemes (White Paper). February 2018, Available at:
https://assets.publishing.service.gov.uk/government/uploads/system/uploads/attachment_data/file/693655/protecting-defined-benefit-pension-
schemes.pdf
13
https://webarchive.nationalarchives.gov.uk/ukgwa/20250115145416/https://www.thepensionsregulator.gov.uk/en/document-library/research-
and-analysis/occupational-defined-benefit-landscape-in-the-uk-2024
327.
Error! Unknown documentproperty name.
327
scheme. As shown in the table below14
, of the c.5,000 schemes in the DB universe, only c.2,000 are
funded above 100% and can afford to buy-out. There are still c.3000 schemes that are underfunded, with
around 4 million members. More recent estimates from the TPR (as of September 2024) suggest that 1
in 2 schemes are funded on a buy-out basis, which means that around 2,400 schemes (with around
4.6m members) still cannot afford to buy-out15
.
Table 2: Membership, schemes and funding level (June 2023)
Size of scheme (members) - All schemes as of 30
June 2023
Buyout
Funding
Level
2--99
100-
999
1000-
4999
5000+
Total
Schemes
Members
Above 100% 860 870 270 130 2,130 5,039,000
95-100% 150 210 70 30 460 684,000
90-95% 150 240 80 40 520 1,041,000
85-90% 160 230 70 40 490 824,000
80-85% 140 180 70 40 430 727,000
75-80% 110 130 40 20 300 344,000
70-75% 100 130 40 10 280 305,000
Below 70% 170 230 50 10 460 364,000
Total 1,840 2220 680 320 5,070 9,328,000
What is consolidation
15. Consolidation, where pension schemes are brought into larger entities so they can benefit from
economies of scale and improved governance, already happens across the DB market. Options to
consolidate can include sharing back-office functions (e.g., actuarial, administrative, investment and
legal), sole trusteeship (where a trustee board is replaced by a single entity, which can be a person or
company although this option is not solely used for consolidation)), as well as pooling pension scheme
assets.
16. There is evidence larger schemes operate more efficiently on average, by: (a) having a lower
administrative / scheme running costs per member, (b) having lower investment costs, and (c) having
better governance16
. It has been identified, through analysis and consultation with the pensions industry,
and set out in the White Paper17
, scheme consolidation could potentially increase efficiency and
governance leading to reduced costs / burden on scheme sponsoring businesses and improved security
to scheme members. In addition, larger schemes with more assets under management may be able to
access a wider range of investment opportunities (such as infrastructure, private equity).
17. DWP explored mandating consolidation under


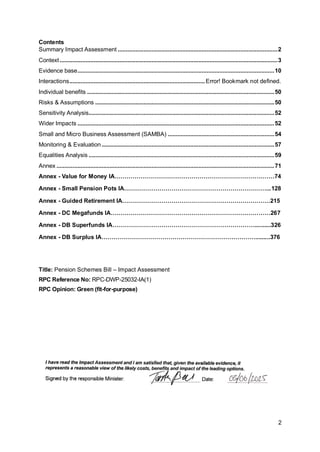

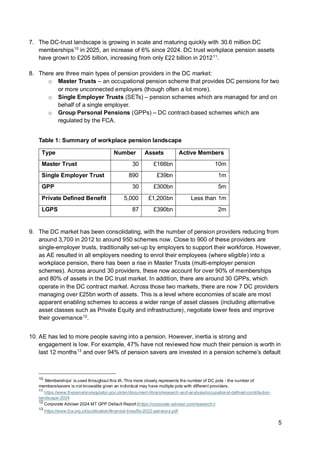
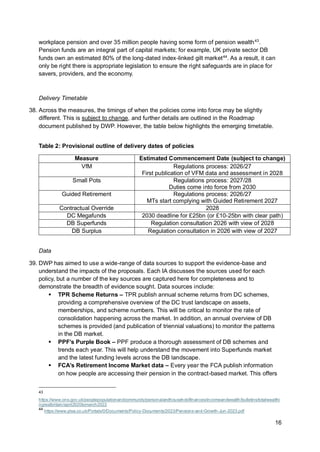

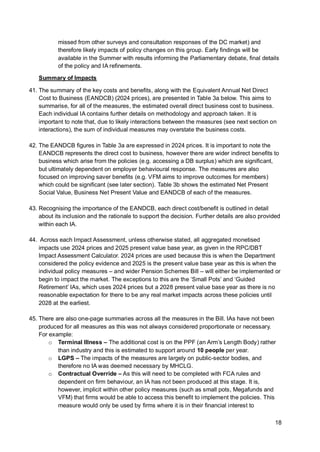

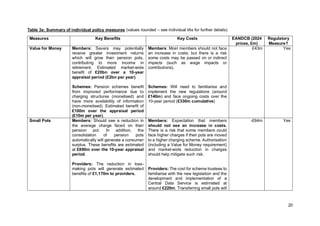

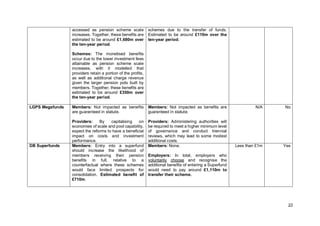
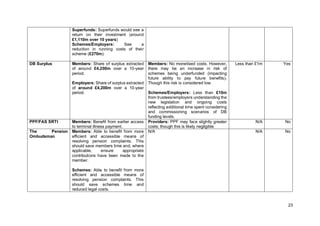
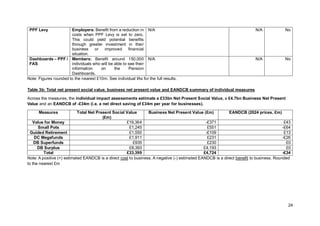


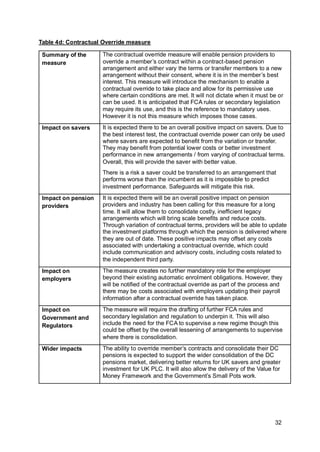


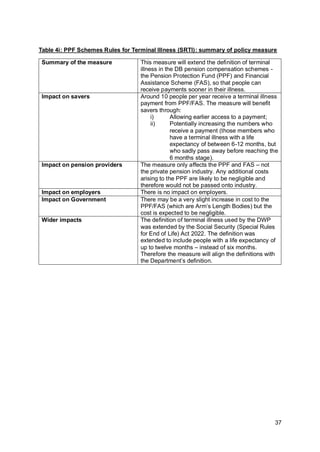

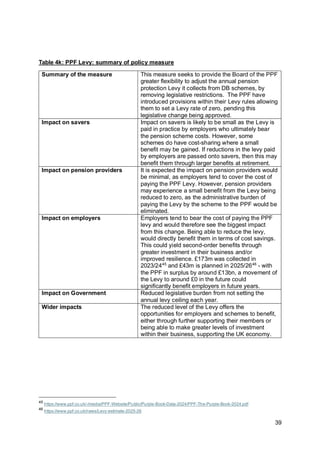

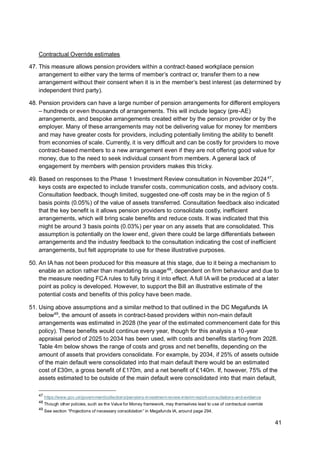
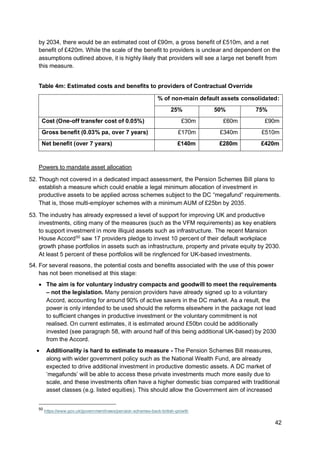


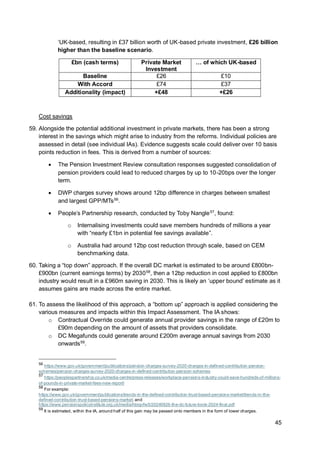


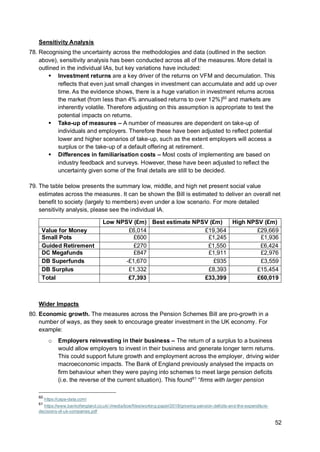
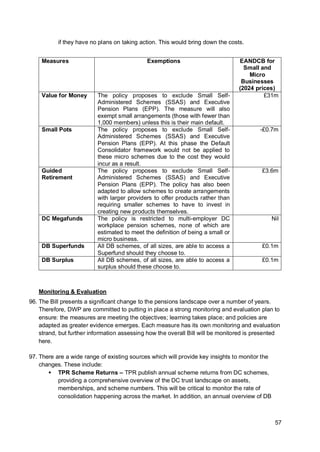

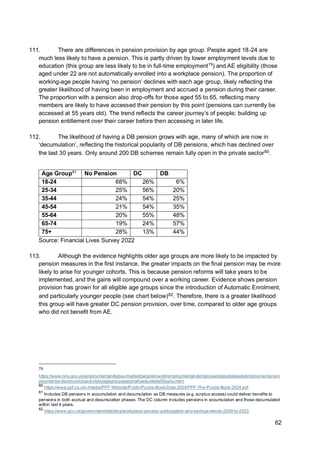
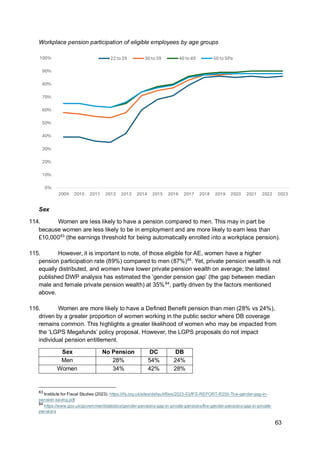

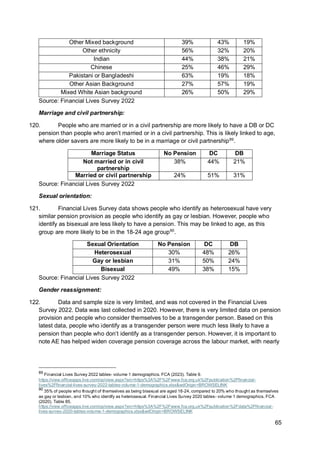


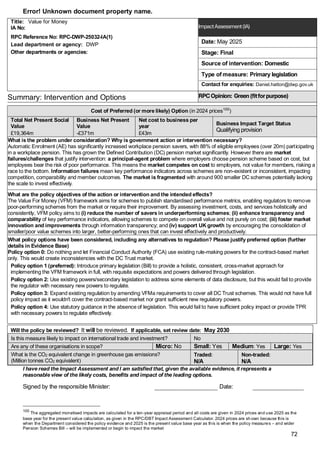
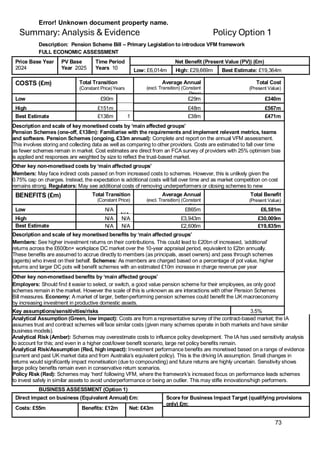

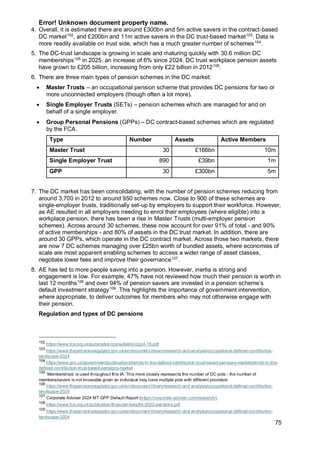
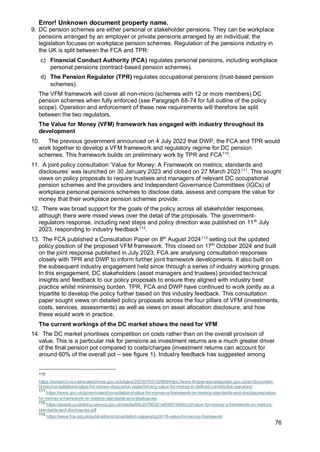
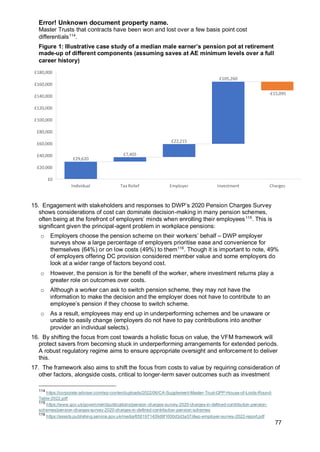
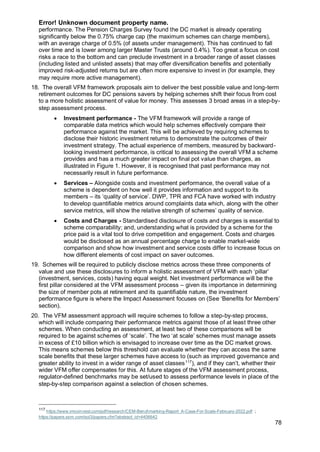

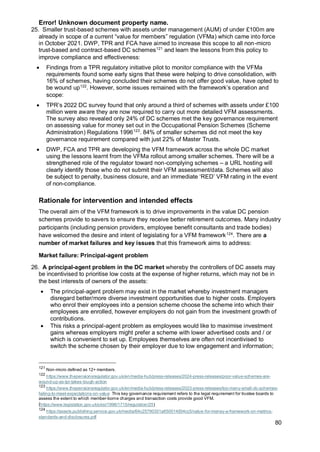
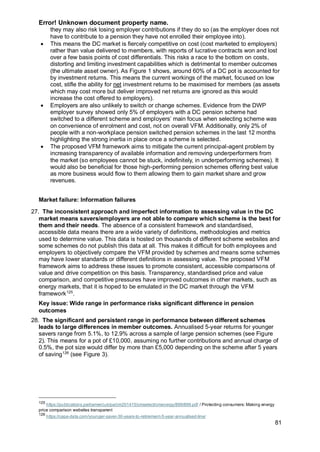
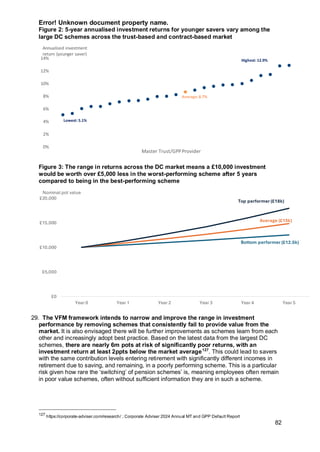
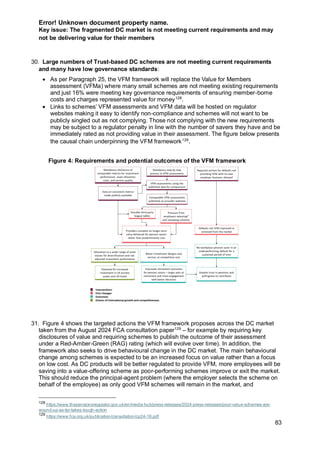
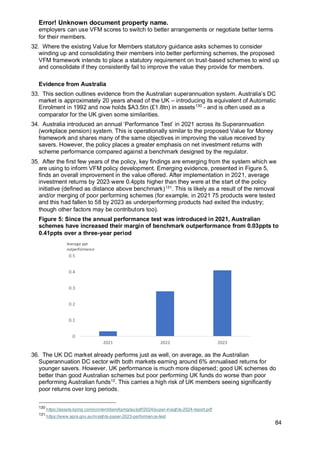
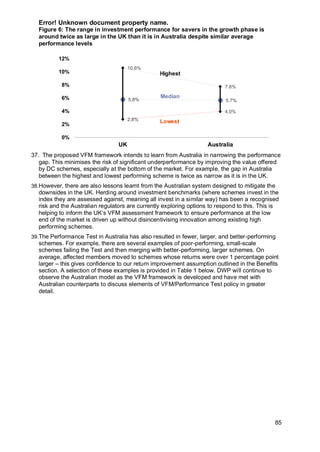
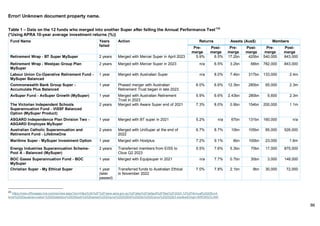
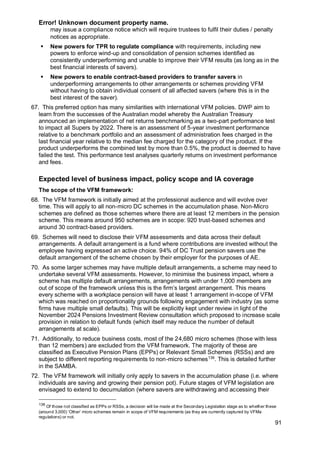


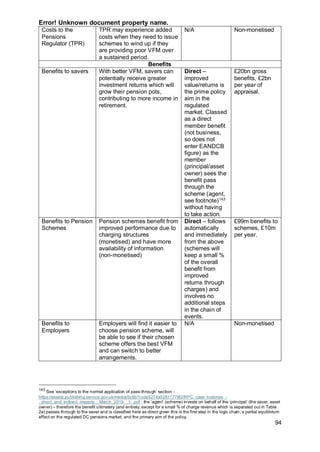
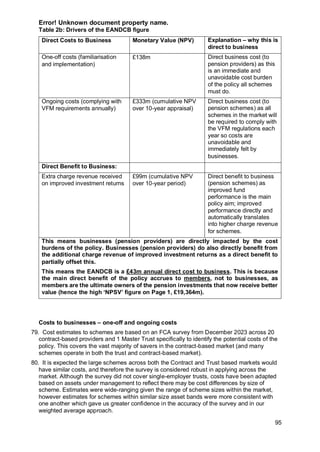
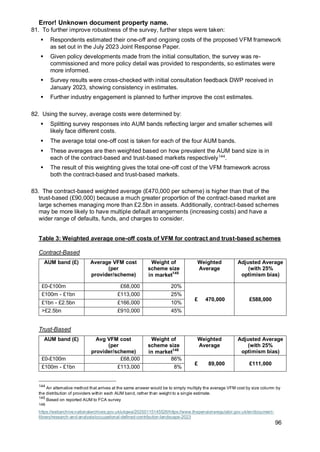
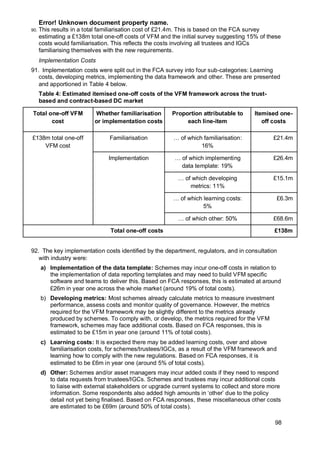
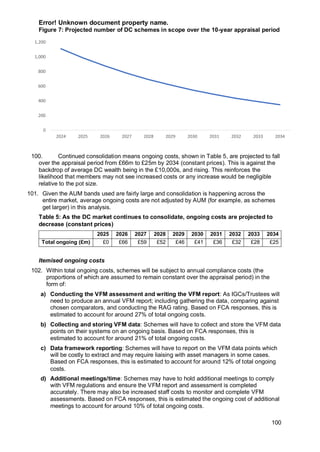
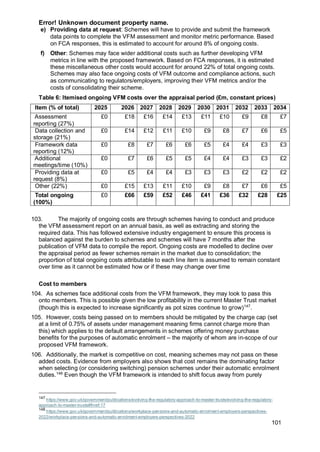
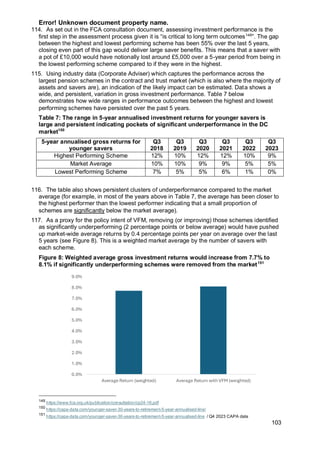

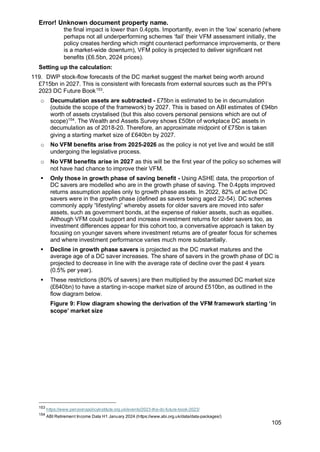


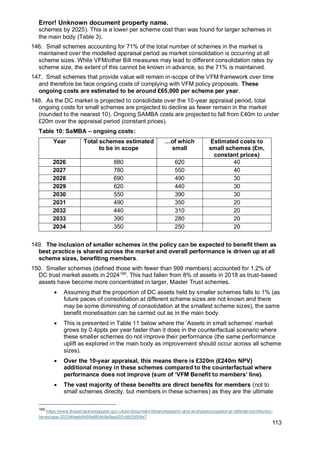
![Error! Unknown document property name.
114
asset owner. However, smaller schemes will also see increased charge revenue
on these improved returns, estimated at around £1m over the appraisal period
(sum of VFM benefit to small schemes’ line).
• This SAMBA has used the RPC/DBT Impact Assessment calculators to assess a
SAMBA-specific EANDCB in Table 12. This shows a £31m equivalent annual net
direct cost to [small] businesses. Importantly, as with the wider impact assessment,
it is the members within these small schemes who benefit most from the VFM
framework, justifying the inclusion of small schemes within the framework.
Table 11: SAMBA - Benefits of improved returns to smaller schemes sees assets grow
faster with VFM compared to the counterfactual where returns do not improve from
current levels
(£mn, constant
prices)
2028 2029 2030 2031 2032 2033 2034 Total
Benefit
VFM: Assets in
small schemes
£6,500 £6,800 £7,200 £7,500 £7,800 £8,200 £8,500
Counterfactual:
Assets in small
schemes
£6,500 £6,800 £7,100 £7,400 £7,800 £8,100 £8,400
VFM Direct
benefit to
members in
small schemes
(£mn)
£- £- £- £- £100 £100 £100 £320m
benefit
to
members
in small
schemes
VFM Direct
Benefit to
small schemes
(£mn)
£- £- £- £- £- £- £1 £1m
benefit
to small
schemes
Table 12: SAMBA EANDCB – direct costs and benefits to small businesses
Impact Overview Cost/Benefit to small
businesses (2024 prices
summed over appraisal
period)
One-off costs Small schemes familiarise
with legislation and
implement systems
£70m
Ongoing costs Small schemes comply with
the annual VFM
requirements
£240m
Total direct costs to small business are £310m (£31m per year)
Higher charge revenue Small schemes see higher
charge revenue from
improved returns on
member pots.
£1m
Total direct benefits to small businesses are £1m (£0.1m per year)
EANDCB to small schemes = £30m cost per year (2024 prices)
151. The measures can also be expected to support small and micro businesses indirectly
through the availability of information, helping reduce search costs. For example, the](https://image.slidesharecdn.com/impactassessment1-250608191506-683de423/85/impact_assessment-1-DWP-document-300-pagespdf-114-320.jpg)


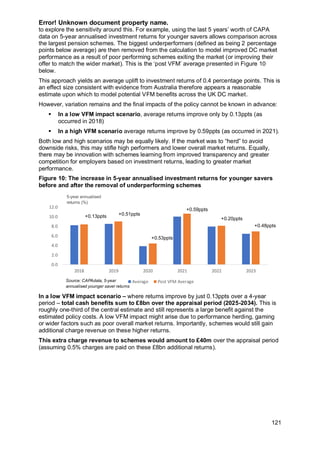
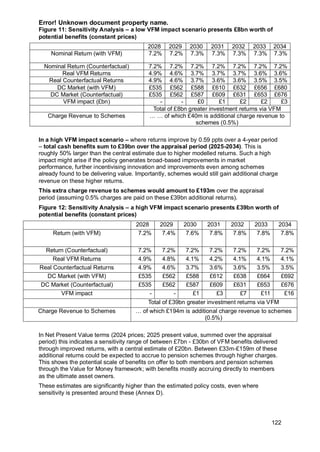
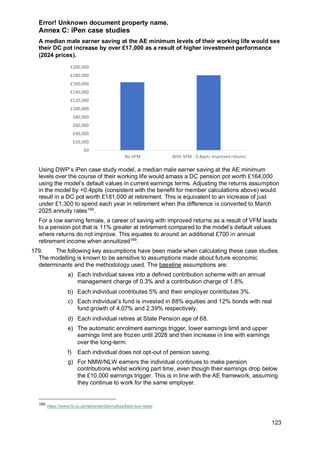
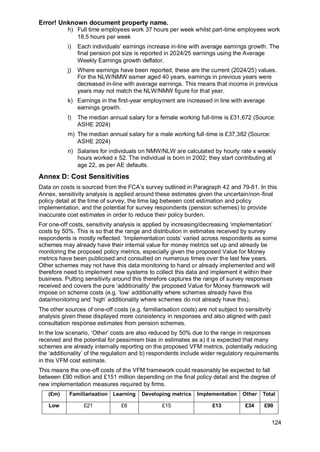
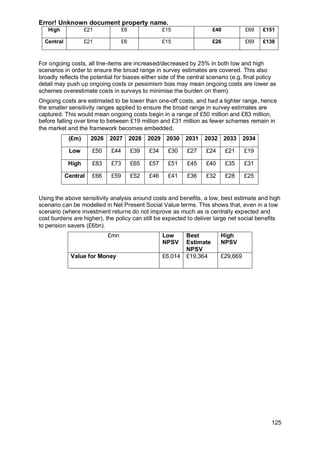


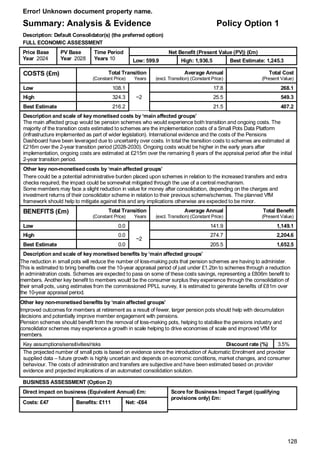
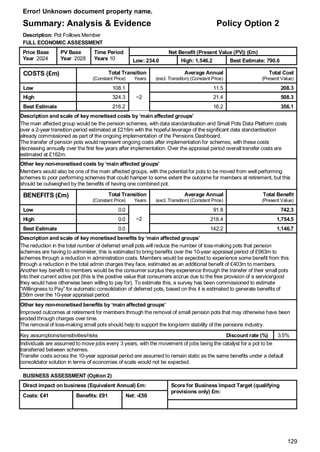

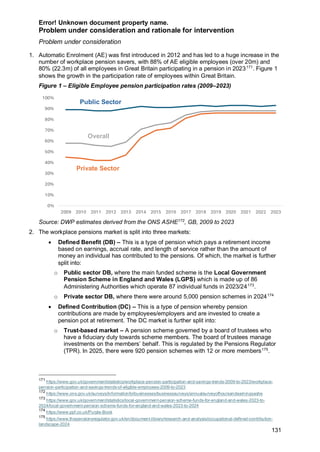
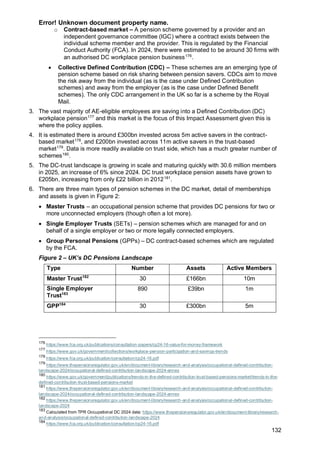
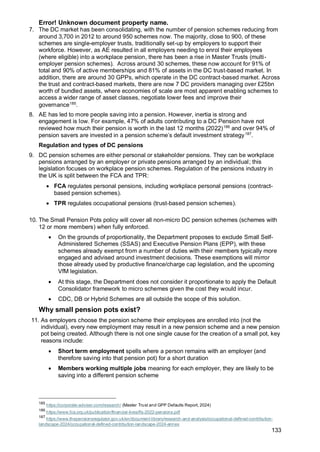

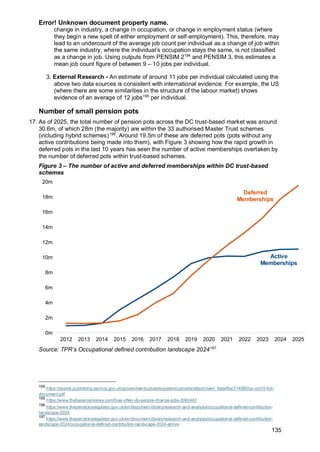
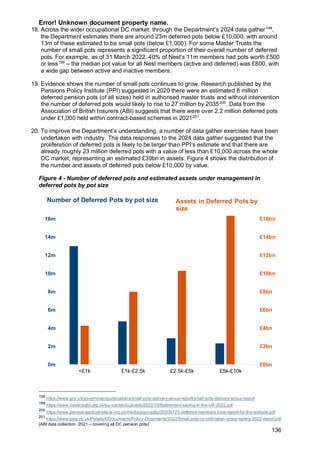
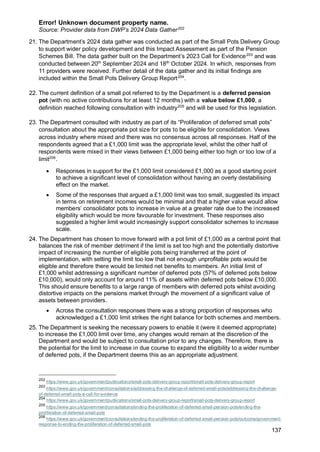
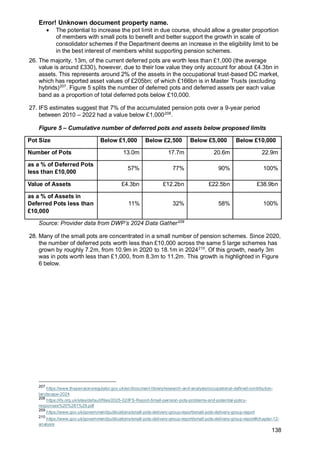
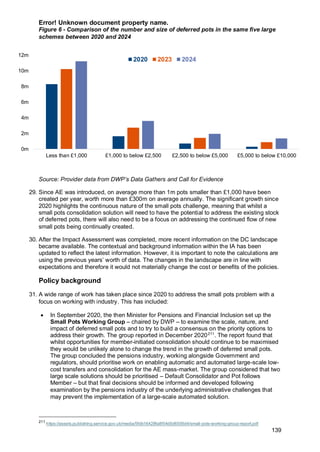


![Error! Unknown document property name.
143
Financial Lives Survey 2022228
found only 10% of eligible UK adults had consolidated their
pension pots in the last 3 years (most likely from engaged and financially literate savers);
and without compulsion it is unlikely schemes themselves would be able to find a market-
wide solution.
42. Additionally, research exploring member engagement with workplace pensions showed that
whilst some members understood the benefits of consolidation there were barriers
preventing them from taking action, including concerns around scams, a perception of
difficulty and lack of understanding about whether they could consolidate their pension
pots229
. This research found support for both a pot follows member and a default
consolidation solution, with the perception of simplicity for members with the transfer and
consolidation process being managed on their behalf.
• Lack of engagement and disinterest in pensions from savers is thought to be a large
part of the lack of member-led consolidation, with the upcoming implementation of the
Pensions Dashboard which aims to increase member engagement with pensions
there is potential for an increase in member-led consolidation as a result. However, as
discussed further [line 121] any impact whilst currently unknown is not considered
material, considering the role of the Pensions Dashboards and the current
engagement of members with small pots.
43. Engagement with pensions remains low across the majority of members, with inertia
a significant barrier to member benefits. The inertia around pensions means many
members either make uniformed choices or instead take no action in regards to their
pension savings which results in the member suffering detriment in the future. The
proliferation of small pots is a clear example of the inertia in regards to pensions. The
automatic nature of automatic enrolment means that many members are unaware they are
contributing into a pension and therefore as they more jobs after short-term saving they are
unaware that they may have created a pension pot of small value. Many members with small
pots are often unaware that they have a small deferred pension230
. If members were more
engaged with their pension savings, the rate of member-led consolidation would be expected
to increase as the consolidation of small pots is in the interest of the individual members.
Instead, the existence of small pots hampers retirement outcomes for members and blocks
members from experiencing the true extent of the benefits of long-term pension saving. The
consolidation of small pots may even work towards improving member engagement and
reducing the inertia around pensions savings whilst helping to drive improved outcomes at
retirement for members.
• The widespread nature of the inertia in pension savings is a significant market failure
that hampers the achievable benefits of pension savings for members whilst also
negatively impacting pension schemes. The resultant creation of small pots due to the
inertia around pensions means members are often unaware of the extent to which
they can benefit from long-term pensions saving.
44. As discussed previously [line 14] and within further detail [Annex A], the average individual
has numerous jobs over their lifetime meaning there is the potential for an individual to
create numerous small pots over their working life. This risks members losing track of
multiple pots over time or becoming disincentivised or disengaged by multiple small pots.
These barriers and the time involved in navigating them may serve to erode trust and
confidence in pensions saving.
228
https://view.officeapps.live.com/op/view.aspx?src=https%3A%2F%2Fwww.fca.org.uk%2Fpublication%2Ffinancial-
lives%2Ffinancial-lives-survey-2022-tables-volume-12-pension-accumulation.xlsx&wdOrigin=BROWSELINK (Table 116)
229
https://www.gov.uk/government/publications/understanding-member-engagement-with-workplace-pensions/understanding-
member-engagement-with-workplace-pensions#consolidating-deferred-pension-pots
230
https://www.gov.uk/government/publications/understanding-member-engagement-with-workplace-pensions/understanding-
member-engagement-with-workplace-pensions](https://image.slidesharecdn.com/impactassessment1-250608191506-683de423/85/impact_assessment-1-DWP-document-300-pagespdf-143-320.jpg)
![Error! Unknown document property name.
144
45. Having pension savings split across numerous pots such as small pots is thought to make
decision making during accumulation difficult according to the IFS231
(Institute for Fiscal
Studies).
46. PPI has recently published research on the total value of lost pension pots, those pension
pots where schemes are unable to contact the member to which the pension pot belongs
to232
. This illustrated the value of lost pension pots has grown from £19.4 billion in 2018 to
£31.1 billion in 2024. The research suggested there could be a link between the increasing
number of small pots and the growth in lost pots between 2018 and 2024. Though it should
be noted that the average size of a lost pot from the research is £9,470; well above the
Department’s current definition of a small pot.
47. Addressing the small pots challenge may allow pension charges to operate in a more
efficient and beneficial way for members:
• Flat fees - Some pension schemes charge members a flat fee on each of their
pension pots. As a result, having multiple small pension pots risks individuals facing
significantly greater costs and eroding the value of pension savings over time.
• Cross subsidisation – As schemes may expect to have some loss-making pots, this
can drive up the average charge level across the industry with more profitable pots
subsidising loss-making pots. Although charges are low (average of 0.48% AMC233
);
the removal of small pots may further reduce fees and thus improve pension
outcomes for members.
o The cross subsidisation of charges across all members is a negative
externality that stems from the proliferation of deferred small pots. Not only do
small pots hamper the retirement outcomes of the members with small pots,
those members without small pots also face detriment as the increase in
charges across the pensions industry through cross-subsidisation reduces
members’ retirement incomes234
.
Why Government is best placed to address the market failures
48. Government regulation and legislation is considered to be best placed to address the wide-
scale nature of the small pots problem.
49. The Department has undertaken significant engagement with industry with the aim of the
pensions industry addressing the issue of small pots itself. However, as seen through the
member exchange pilot which is discussed further [line 97], industry has been unable to
move forward with a solution without the need for supporting government legislation.
50. There is a divide across the pensions industry on the best solution to address small pots,
with a roughly equal division between schemes that favour a pot follows member approach
and schemes that prefer a multiple default consolidator model. Both policy options would
require government legislation to be implemented and therefore whilst there remains no
consensus across the pensions industry on the best solution to implement, there is a clear
consensus that government legislation is required to implement a market-wide small pots
solution.
231
https://ifs.org.uk/sites/default/files/2025-02/IFS-Report-Small-pension-pots-problems-and-potential-policy-
responses%20%281%29.pdf
232
https://www.pensionspolicyinstitute.org.uk/media/vh4aaq2j/20241024-ppi-bn138-lost-pensions-2024-final.pdf
233
https://www.gov.uk/government/publications/pension-charges-survey-2020-charges-in-defined-contribution-pension-
schemes/pension-charges-survey-2020-charges-in-defined-contribution-pension-schemes
234
https://www.pensionspolicyinstitute.org.uk/media/pqynaq5p/20200723-deferred-members-final-report-for-the-website.pdf](https://image.slidesharecdn.com/impactassessment1-250608191506-683de423/85/impact_assessment-1-DWP-document-300-pagespdf-144-320.jpg)


![Error! Unknown document property name.
148
Figure 7 – The process of member allocation to a consolidator scheme
61. To achieve this, the Government will require primary legislation and underpinning secondary
legislation to set out the specifics of the consolidation framework. As part of this, powers will
be taken to ensure that the regulator(s) can monitor and enforce compliance where required.
As a result, there are significant delivery steps still needed to be decided and iterated which
means any specific policy details are subject to change. However, the best estimates of the
policy, costs, and benefits are presented within this Impact Assessment to support
transparency.
62. Scope: Engagement with industry has set the focus of consolidation solutions as deferred
small pots that are within the AE workplace pensions market within charge-capped default
funds (including sharia compliant funds). However, it will exclude those pots with
guarantees. It is expected that the vast majority of small pension pots are in scope, across
trust and contract-based schemes.
63. Threshold: The eligibility criteria as referred to above [line 58] and discussed further
previously [line 22] was chosen to ensure the right balance was struck between achieving
significant levels of consolidation, but also limiting the impact on schemes. The eligibility
criteria will remain under review. It is estimated there are roughly 13m deferred small pots
eligible for consolidation – worth approximately £4.3bn.
64. Default Consolidators: Schemes are expected to apply for authorisation to become a
consolidator scheme, with the Department intending to define the requirements
consolidators must meet. It is expected to be only a relatively small number of schemes that
would apply for authorisation, with the likelihood that only schemes with existing levels of
scale that is sufficient enough to counter an initial influx of potentially loss-making pots would
apply for authorisation. The Department proposes the following to be encompassed within
the authorisation criteria:
• Already an AE qualifying scheme
• Specific value of Assets Under Management (AUM)
• Provide the highest level of VfM outlined within the VfM policy
• Protection from flat fees above the current level of the de minimis241
(a threshold that
restricts the charging of flat fees on pots below the level set by the de minimis)
• Same scheme consolidation and financial sustainability
• Ability to accept incoming Protected Pension Ages
65. Schemes would be able to seek authorisation to become a consolidator scheme at any point
but it is anticipated that the majority of the authorisation will occur at the beginning of the
policy.
241
https://www.thepensionsregulator.gov.uk/en/document-library/scheme-management-detailed-guidance/funding-and-
investment-detailed-guidance/cost-and-charge-
restrictions#:~:text=On%206%20April%202022%2C%20a,scope%20of%20the%20charge%20cap.](https://image.slidesharecdn.com/impactassessment1-250608191506-683de423/85/impact_assessment-1-DWP-document-300-pagespdf-148-320.jpg)
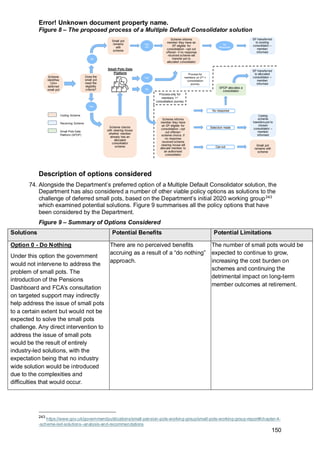
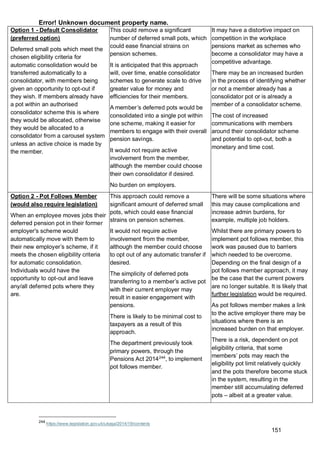
![Error! Unknown document property name.
152
A member’s pot could be moved
from a high performing scheme to a
low performing scheme which could
impact member outcomes.
Option 3 - Member Exchange
(alternative to legislation)
Under this option, pension schemes
would use a trusted third-party data
service to conduct a regular
exercise and identify ‘matches’,
where they hold a deferred small pot
for a member who is making active
contributions into a pension with
another of the participating
schemes.
As an industry led solution there
would be no burden on employers.
The small pots where matches
between schemes are established
would be consolidated into a
member’s active pot.
Would likely require government
legislation in order to be an
implemented solution, therefore not a
viable non-legislative alternative.
The small pots in scope would be
limited to just those held by the
schemes involved.
The number of small pots that
members have could continue to
increase if these small pots are
created outside of the included
schemes.
Could become a significant burden
on schemes to identify matches with
other schemes.
75. Based on extensive engagement with industry, listening to member research, consideration
on deliverability, and assessing the implications on competition, the Department has
considered a default consolidator solution as the best way forward to address the issue of
small pots.
Option 0 - Do Nothing
76. The implementation of a solution to address the proliferation of deferred small pots would not
be expected under a do-nothing approach. There is no market-wide consensus amongst
schemes on the best solution to move forward and the issues highlighted below [line 97]
around the member exchange pilot also highlight the difficulty in moving forward solutions to
address the small pots problem without supporting government legislation.
77. Without intervention, individuals would still be able to request their small deferred pots be
transferred and consolidated. However, the onus is placed upon the member to pursue this
and schemes maintain discretion over whether to accept the transfer of any pots. Evidence
suggests member-led consolidation remains low. In 2021, a data gather of providers by
DWP found less than 2% of members with multiple pots were requesting that they be
consolidated.
78. Similarly low levels of consolidation were reported by FCA’s Financial Lives Survey245
which
reported 5% of DC pension holders consolidated their pension pot in the 12 months to May
2022, equating to around 1.1 million members. This was a slight increase in the 3% reported
in 2020, however, at 5%, overall consolidation levels remain low and the figure for small pots
specifically could be even lower due to the low pension engagement of many members with
existing small pots.
79. Findings from Wave 2 of the PPLL survey246
also suggest a relatively low rate of member-led
consolidation. 25% of respondents aged 40-75 with a private pension indicated that they had
consolidated some/all of their pension pots. The focus on adults aged 40-75 could potentially
explain the comparably high % of respondents that indicated they had in some way
245
https://www.fca.org.uk/publication/financial-lives/fls-2022-pensions.pdf
246
‘Planning and Preparing for Later Life 2024, DWP, publication forthcoming’](https://image.slidesharecdn.com/impactassessment1-250608191506-683de423/85/impact_assessment-1-DWP-document-300-pagespdf-152-320.jpg)
![Error! Unknown document property name.
153
consolidated a pension pot. As those closer to retirement age may be more likely to
consolidate pots as they begin to consider their decumulation options. Further details of the
PPLL survey are discussed in the sections below [line 147].
80. The introduction of the Pensions Dashboard247
, with schemes expected to be connected by
October 2026, may help. This will provide a central location for members to access all their
pension information. However, this will still be reliant upon individuals taking action on a
complex financial decision.
81. FCA is consulting248
on how its proposals under the Advice Guidance Boundary Review249
could be applied to the Pensions landscape and the potential use of targeted support. Whilst
this would not be expected to resolve the small pots issue, it would however be expected to
complement a small pots solution for engaged or engageable savers.
82. Member research suggests members do want their deferred pots to be consolidated but face
numerous barriers in doing so, including being unaware if they could consolidate, the
process is perceived to be difficult and/or would involve high levels of effort and being
unaware on how to consolidate their pension pots. Research suggests broad support for a
solution that supports members with the consolidation of their deferred pots250
. Attempts
have been made to push industry to take on the consolidation of deferred pots but schemes
found this to be challenging and signalled for Government legislation to push this forward. As
a result, this is not a viable option and the number of small pension pots would continue to
rise.
Option 1 – Default Consolidator
83. A multiple default consolidator solution, explained previously [line 58], is the Department’s
preferred option but two other design scenarios for a default consolidator solution were
considered by the Department. These two design options were:
• Single consolidator model (existing scheme) – Under this design, there would be only
one authorised consolidator in which all eligible small pots would be consolidated
into. The consolidator would be an existing scheme, either the chosen consolidator
from those schemes who applied or a “consolidator of last resort” which would be
chosen by the Department’s Secretary of State.
• Single consolidator model (new scheme) – Under this design, there would also be
only one authorised consolidator in which all eligible small pots would be
consolidated into, however, the consolidator scheme would be a new scheme set up
for the sole purpose of being a default consolidator. This scheme would therefore
have no active members and would only be authorised to administer members’
consolidator pots.
84. Having considered the potential for a single consolidator solution, neither design options are
considered as viable solutions by the Department. With the Department, concluding that a
single consolidator solution has the potential to impose significant implications on the
pensions industry.
85. The transfer of the entire stock of small pots at the point of implementation as well as the
entirety of the yearly flow of small pots created each year thereafter would represent a
significant number of small pots to be consolidated within one scheme. The current stock of
small pots is estimated at 13m with an estimated AUM of around £4.3bn. Meaning a single
consolidator at implementation would gain an assets value greater than that of many of the
smaller Master Trust schemes. Potentially undermining the level of competition within the
DC pensions industry, with a specific impact on the trust-based market (where the majority
247
https://www.legislation.gov.uk/ukia/2022/81/pdfs/ukia_20220081_en.pdf
248
https://www.fca.org.uk/publication/consultation/cp24-27.pdf
249
https://www.fca.org.uk/publication/discussion/dp23-5.pdf
250
https://www.gov.uk/government/publications/understanding-member-engagement-with-workplace-pensions/understanding-
member-engagement-with-workplace-pensions#consolidating-deferred-pension-pots](https://image.slidesharecdn.com/impactassessment1-250608191506-683de423/85/impact_assessment-1-DWP-document-300-pagespdf-153-320.jpg)
![Error! Unknown document property name.
154
of the small pots are). The higher level of transfers that would also be required could
unnecessarily complicate the process and introduce higher ongoing costs.
86. The financial stability of the consolidator scheme could also be impacted due to the loss-
making nature of small pots, with pots below £1,000 largely seen as been uneconomical for
schemes. Absorbing a large number of loss-making pots, such as 13m small pots could be
financially detrimental to any scheme with the need for a large number of profit-making pots
to balance out the large number of loss-making pots, profit making pots that a new single
consolidator scheme would not have.
87. The potential for financial instability and wider impacts on the pension industry as the result
of a single consolidator solution could also impact members, with potential impacts on
member outcomes at retirement if a single consolidator was forced to increase charges to
address the unbalance between loss-making and profit-making pots. A single consolidator
solution would also remove the choice for members to choose their consolidator schemes,
with members instead having to consolidate into the only consolidator scheme unless they
actively pursued consolidation themselves, which is unlikely due to the high level of inertia
around pensions.
88. Therefore, going forward a multiple default consolidator solution is the only option design
that is under consideration by the Department. The distribution of small pots amongst
several consolidators should mitigate the distortive impacts of a single consolidator solution
and drive competition within a pensions consolidator market and help keep schemes
focused on improving outcomes for members.
89. Through the Small Pots Delivery Group, industry was consulted on the potential for a two-tier
approach, which would have seen some schemes apply to be a consolidator only for
members in which they already have a pre-existing relationship with. However, the
Department has decided not to proceed with this approach, with larger schemes indicating
during Delivery Group meetings that a two-tier approach would make authorisation as a
consolidator scheme considerably less viable and increased the risk of schemes not seeking
authorisation to act as a consolidator for the whole of the market. Instead, the focus is on a
single-tier authorisation approach which the Department believes will result in a more
competitive consolidator market that helps to support improved member outcomes.
Option 2 - Pot Follows Member
90. An alternative proposal was for Government to legislate to support a “Pot Follows Member”
(PfM) model which has been explored in depth. Under a PfM model, the Government could
expand on current primary powers (if required) to allow members’ small pots to be
automatically transferred into their active workplace pension scheme as members move
between employments. Under PfM when an individual is automatically enrolled into a new
DC workplace pension scheme, their new scheme would check whether they have an
existing deferred pension pot with another scheme. If they do, any existing pots would be
automatically transferred into the member’s new scheme (providing it meets the chosen
eligibility criteria for automatic consolidation).
91. If an individual left a pension scheme but didn’t commence pension contributions into a new
scheme (for example, due to a period of unemployment or opting out of their new employer’s
scheme), the pension pot would remain deferred until the individual were to recommence
employment and/or pension contributions. Individuals would have the right to opt-out of any
transfer under PfM.
92. The Department also envisages that a Small Pots Data Platform as mentioned above [line
70] would be required for PfM with the need for data standardisation and a central system to
facilitate the transfer of pots between schemes.
• As mentioned previously there is uncertainty around the infrastructure required and
the exact role that a Small Pots Data Platform would facilitate under a multiple default
consolidator solution, the same is the case for the involvement of a Small Pots Data
Platform under a PfM model. Therefore, for the purposes of this IA the same
assumptions around a Small Pots Data Platform have been made across both a
multiple default consolidator and PfM solution, however, in reality there would likely](https://image.slidesharecdn.com/impactassessment1-250608191506-683de423/85/impact_assessment-1-DWP-document-300-pagespdf-154-320.jpg)
![Error! Unknown document property name.
155
be some deviation between the two solutions, but any differences are unknown with
the role and infrastructure of a Small Pots Data Platform under a consolidator
solution continuing to be explored through the feasibility review [line 70].
93. There are a number of challenges, however, including:
• Moving to a poor performing scheme – As members would be moving between
schemes, depending on who their employer enrols them with, there is a risk that
members’ pots could be moved from a high-performing scheme into a poor-
performing scheme. This should be mitigated, somewhat, over time with the
proposed introduction of the Value for Money framework251
which will ensure all
members are receiving value for money.
o In a consolidated DC market with the implementation of the VFM framework, the
risk of pots being moved from high to low-performing schemes would be expected
to reduce and therefore the extent of the risk altered. The extent to which,
however, would depend on the future changes within the DC market and the VFM
offered by schemes.
• Pot Eligibility – Depending on the pot value threshold set for PfM eligibility, there is
the risk with the continued consolidation of small pots into members’ current active
pots that overtime if these active pots were to become deferred they could have a
value greater than the set threshold and therefore the pots would not be eligible for
consolidation under a PfM model and would remain deferred.
o In some instances, the same could occur under a default consolidator solution but
the risk is thought to be reduced in comparison as multiple deferred pots would
not being combined into an active pot that could subsequently become deferred.
• Liquidity – There could be the requirement for schemes to regularly transfer pots to
other schemes with the potential fast-paced nature of the labour market and the
potential for significant job churn especially for younger and lower-paid individuals
(which are considered more likely to create a small pot). Therefore, schemes may be
required to hold a higher proportion of liquid assets than they otherwise would in
order to facilitate the transfer of a large number of pots up to £1,000 on a regular
basis. This has a number of impacts:
o Schemes may need to hold greater liquidity to manage uncertain cash flows
leaving the scheme, which could potentially impact on investment returns (due to
the ‘illiquidity premium’ – an incremental return that compensates an investor for
owning an asset that is not highly liquid252
). Therefore, as a result, members within
these schemes could experience lower investment returns – this can be shown
through investment returns for younger savers being much greater than those
nearing retirement reflecting a mix of safer and liquid assets. CAPA data
estimated the average 5-year annualised return for a young saver was 8.5%
compared to 5.5% for someone 5 years from retirement253
.
o The impact would depend on the number and speed of transfers required, an
initial limit similar to the £1,000 limit proposed for a default consolidator solution
would help to mitigate the extent to which schemes experience impacts under a
liquidity risk due to the low value of pots being transferred. If the pot limit was to
be uplifted in due course, the impacts of a liquidity risk could become more
pronounced as the value of the pots being transferred increases.
251
https://www.gov.uk/government/consultations/value-for-money-a-framework-on-metrics-standards-and-disclosures/value-
for-money-a-framework-on-metrics-standards-and-disclosures
252
For example see empirical estimation of the ‘illiquidity premium’ by Amihud et al. (2015):
https://www.sciencedirect.com/science/article/abs/pii/S0304405X15000483
253
https://capa-data.com/ca-master-trust-gpp-defaults-report-key-findings/ (CAPA Master Trust and GPP Defaults Report
2024)](https://image.slidesharecdn.com/impactassessment1-250608191506-683de423/85/impact_assessment-1-DWP-document-300-pagespdf-155-320.jpg)
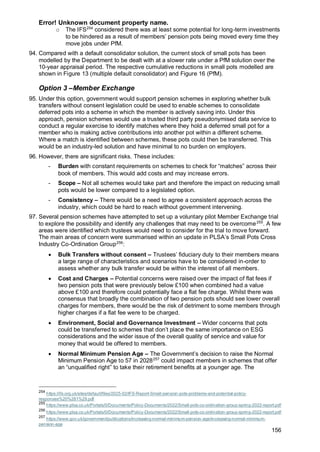

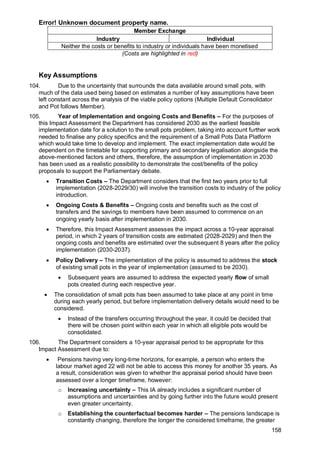
![Error! Unknown document property name.
160
already been necessary for the Pensions Dashboard, it is expected that £324m would
represent the top-end of an estimate for the transitional costs to industry of an
automated transfer system as some data standardisation costs will have already been
incurred. If data standardisation is assumed to account for up to 2/3s of the costs, as in
Australia, that would represent significant savings. There will also likely be some
overlap between the ongoing costs for Dashboard and an automated transfer solution,
such as the costs associated with updating and maintaining data and ensuring
regulatory compliance. The ongoing costs to schemes that are unique to an automated
solution are not fully known at this point, though most are assumed to be captured
within the estimated costs of transfers.
• A transition and build cost of £324m is considered to be a high estimate of the cost of
a Small Pots Data Platform, with the Department’s current best estimate being £216m
with 2/3s of the cost being for data standardisation & processes (£144m) and 1/3 for
the build of a Small Pots Data Platform (£72m). Engagement with industry has
suggested that, due the Pensions Dashboard programme, much of the data
processing that would be required has already been done - therefore lowering the
required costs of a Small Pots Data Platform. This is estimated to account for a saving
in the region of one-third of the total cost of implementing a Small Pots Data Platform,
therefore representing a reduction from £324m to our best estimate of £216m. This
central estimate is highly uncertain and will be dependent on the specification of a
Small Pots Data Platform. Nevertheless, at this point in time, based on the very limited
evidence, this is the best available information to inform the cost until further policy
details emerge.
o Data Standardisation – For the purposes of this IA any additional costs around a
Small Pots Data Platform have not been monetised or estimated largely due to the
uncertainty around any additional costs. It is possible that schemes do face
additional costs as a result such as increased communication costs to explain the
process to members and broader costs outside of data standardisation.
o With the assumption that significant costs savings could be leveraged through the
data standardisation that has already occurred for the Pensions Dashboard, the
central estimate of £144m data standardisation cost is thought to also cover any
additional costs that schemes would face as a result of the implementation of a
Small Pots Data Platform, however, this cost does remain inherently uncertain.
• For the IA it is assumed that the central estimate of £216m is split evenly across the 2
years of transitional costs (2028-2030) and is a cost to schemes. The data
standardisation costs would be the costs to schemes in-order to meet the
requirements to facilitate the transfer of pots alongside the Small Pots Data Platform.
More detail on this is discussed below [line 127].
109. Opt-Out – Members can choose to opt-out of the policy, but it is expected that any
opt-out would remain low and an opt-out rate of 3.5% has been assumed. Given the
relatively low value of the pension pots being moved, and that individuals have already not
opted-out of AE in order to create the small pot, it is expected that the opt-out rate would be
lower than that for automatic enrolment which varies around 8-10%263
. This assumption is
supported by a range of other evidence including:
• International Evidence – Australia’s stapled pot model, which sees members keeping
the same pension pot across their working lives, found just 3.5% of assets in the
Australian pension market switch schemes each year264
(i.e. a member has decided to
change which pension scheme their contributions are paid into).
263
https://www.gov.uk/government/statistics/ten-years-of-automatic-enrolment-in-workplace-pensions/ten-years-of-automatic-
enrolment-in-workplace-pensions-statistics-and-analysis
264
https://corporate-adviser.com/australia-pensions-special-pot-for-life-a-model-for-the-uk/](https://image.slidesharecdn.com/impactassessment1-250608191506-683de423/85/impact_assessment-1-DWP-document-300-pagespdf-160-320.jpg)
![Error! Unknown document property name.
161
• Default Arrangement – TPR data265
shows that just less than 97% of total
memberships (where a default arrangement is both available and known) are within
default funds, leaving just less than 3.5% of memberships outside of schemes’ default
funds. As the consolidation of small pots would not involve any active changes in
contributions but rather see the movement of members’ pots between schemes, the
level of members opting out of default funds is considered a useful proxy.
• Current Consolidation Levels – Members who currently consolidate their pension
pots themselves may opt-out of an automatic solution in-order to remain in-control of
the consolidation of their pension savings. As referenced previously [line 78], member-
led consolidation remains low between 3-5% in recent years266
.
110. Matching Rate – Low engagement with pensions can result in poor data quality, with
members’ data quickly becoming outdated as they move between employments, etc.
Therefore, it is assumed that in some instances not all of the small pots eligible for
consolidation would be able to be matched to an individual and instead would result in a
mismatch, where the data available does not sufficiently match that held on record by
schemes and therefore the transfer cannot occur securely. As part of the Small Pots Delivery
Group a stringent matching criteria was recommended to ensure the accuracy of the
transfers of pension pots, and it is this criteria that has been used as the basis for a
matching rate assumption.
• Primary data set: First name, Surname, Date of Birth and NINo
• Supplementary data set: Mobile Number, Email Address and Previous Addresses
and Post Codes.
• Evidence and research around a matching rate between pensions pots and members
is limited but the Department has called upon a number of research reports to build
up a matching rate assumption.
• PLSA’s Small Pots cross-industry co-ordination group267
included analysis
conducted by ITM on the probability that a pension pot would be matched to a
member correctly based on a selection of data items. The research distinguished
between whether a correct match would be made and then whether a correct match
was likely to actually occur. Based on the criteria: NINo, Surname, DoB and First
Name, the research concluded a 91.6% chance of a correct match, with a 90.5%
chance it would occur. The report concluded that “forming conclusions… for the
likelihood of mismatches… is statistically challenging, anything like a 9% chance of a
mismatch may be too high to provide assurance”268
.
• Initial findings from PPI’s Data Project269
show that over the last 5 years, the data
supplied was consistent and to a high degree of accuracy and quality. The findings
also suggest that combining data across schemes should result in many exact
matches being made. 85% of good matches were classified as an exact match.
There was also a large number of partial matches (47% of potential matches in 2022)
that would require further verification for a match to be made.
• If a correct match was not achieved, the Small Pots Data Platform would work with
schemes to undertake further tracing to update member records, with a requirement
on schemes throughout to ensure that member data is kept up to date. The
265
https://webarchive.nationalarchives.gov.uk/ukgwa/20240605050724/https://www.thepensionsregulator.gov.uk/en/document-
library/research-and-analysis/occupational-defined-contribution-landscape-2023/occupational-defined-contribution-landscape-
2023-annex
266
https://www.fca.org.uk/publication/financial-lives/fls-2022-pensions.pdf
267
https://www.plsa.co.uk/Portals/0/Documents/Policy-Documents/2021/Small-pots-cross-industry-co-ordination-group-update-
report.pdf
268
https://www.plsa.co.uk/Portals/0/Documents/Policy-Documents/2021/Small-pots-cross-industry-co-ordination-group-update-
report.pdf
269
https://static1.squarespace.com/static/5d88d0560f00b11d45ecc14e/t/67ab67b59770e3017c018071/1739286456765/202502+P
DP+Lessons+Learned+matching+provider+data.pdf](https://image.slidesharecdn.com/impactassessment1-250608191506-683de423/85/impact_assessment-1-DWP-document-300-pagespdf-161-320.jpg)
![Error! Unknown document property name.
162
Department continues to work with HMRC to assess the possibility of accessing
HMRC data for the purposes of improving data matches. The matching programme
under a small pots consolidator would likely build upon that of the Pensions
Dashboard and therefore a similar mismatch rate may be expected. A report by
Pension Fusion270
continued to attempt matches with those pension records that
were not matched in the original matching exercise. Over 10 tests with differing data
criteria, an overall mismatch rate of below 1% was reached.
o The Pensions Data Project271
reported 10.1m bad matches, an average of 0.44
bad matches per member, but the anonymous nature of the member records
involved meant that no further verification using additional data was possible.
• Based on these sources and the assumption that matching rates should improve
over time a central assumption of a 5% mismatch rate has been used. Accounting
for previous research such as that conducted by ITM and the research that suggests
that correct matches can be made after further matching attempts. Therefore, a mid-
point of 5% between 1% and 9% has been taken as a central estimate.
• As with any automated solution that would involve the transfer of members’ pension
pots there is a potential risk of members’ pots becoming lost or an incorrect match
being made, resulting in a pension pot being matched and transferred to the wrong
member. The Department has worked with industry (as part of the Small Pots
Delivery Group) and continues to do so to formulate the best procedures to address
these potential issues.
o The Department plans to ensure that the appropriate compensation is available
to members – discussions are ongoing around how this should be funded and
how it would be administered and managed
o The rate of incorrect matches occurring is expected to be low, with a very high
standard of matching expected by schemes with initial findings from PPI’s Data
Project finding a low risk of wrong matches being made based on a strict
matching criteria and overall good quality data records across the schemes
involved272
.
o The mismatch rate represents an assumption of the number of pots that would either
be transferred to the wrong member (which is expected to be minimal) and those
pots that cannot be transferred either due to insufficient member data available or the
available data being of insufficient and poor quality.
111. Both the opt-out and mismatch rate assumptions have been modelled on a per pot
basis rather than being applied on a per member basis by using the average number of pots
per member (referenced below, [line 114]). This is due to a number of reasons including:
• There is inherent uncertainty about the behaviour of individuals when it comes to the
decisions around opting-out, it could be that an individual would continue to opt-out in
the future for each small pot they accrue. Alternatively, this may not be the case and
an individual may only opt-out of the consolidation of one of their multiple small pots
over their working lives. Be this due to particular reasons to keep a certain small pot
within its existing scheme, forgetting to or not engaging to opt-out.
• Any mismatches of pots would not be individually linked and would likely be a result of
the quality of data held previously by employers or by pension schemes. Therefore,
the likelihood of a pot being mismatched should not increase for members who have
270
https://www.pensionfusion.com/sites/default/files/2022-
09/Pension%20Fusion%20-%20Pensions%20Dashboards%20-%20Getting%20to%20the%20heart%20of%20matching%20-%
20Single%20page%20view.pdf
271
https://static1.squarespace.com/static/5d88d0560f00b11d45ecc14e/t/67ab67b59770e3017c018071/1739286456765/202502+P
DP+Lessons+Learned+matching+provider+data.pdf
272
https://static1.squarespace.com/static/5d88d0560f00b11d45ecc14e/t/67ab67b59770e3017c018071/1739286456765/202502+P
DP+Lessons+Learned+matching+provider+data.pdf](https://image.slidesharecdn.com/impactassessment1-250608191506-683de423/85/impact_assessment-1-DWP-document-300-pagespdf-162-320.jpg)
![Error! Unknown document property name.
163
already experienced the mismatch of a different small pot within a different scheme if
they provided the required data to employers or schemes.
o There is the possibility that some members be it due to characteristics or
engagement with their pensions may be more prone to a mismatch of their small
pots, however, the impacts or existence of such a link is unknown and therefore
cannot be considered within this assumption by the Department.
• Therefore, the opt-out and mismatch rates are applied on a per pot basis to account
for potential changes in member opt-out behaviour and the uncertainty about any
resulting mismatches.
112. Administration Costs – It is assumed that the marginal costs of administrating a
small, deferred pension pot (and in turn the saving from no longer having to) is £20 per
annum. This figure is based on provider data from the Department’s recent 2024 data
gather. These findings gave a range that was largely between £10-£30, therefore a midpoint
of £20 has been taken as an estimation. This aligns with the Department’s previous 2023
Call for Evidence273
where provider data ranged between £5-£75 per annum, with a potential
breakeven point around a pot value of £4,000. With an average AMC close to 0.5% across
DC schemes, 0.5% of £4,000 would give a breakeven point around £20. As a result, a lower
estimate of £10 and a higher estimate of £30 have been presented in sensitivity analysis of
the costs and benefits of a multiple default consolidator solution [Annex B].
113. The midpoint of estimates from industry data have remained similar over time and
therefore administration costs are not assumed to change over the 10-year appraisal period,
with the fixed costs of administering a small pot not expected to change significantly or be
impacted as a result of a consolidator solution.
• As consolidator schemes grow in scale in terms of memberships, the average fixed
administration costs per pot could fall. However, it is not possible to know how the
scale of the consolidator schemes may grow (with uncertainty over the number of
consolidator schemes among other factors) and therefore any potential impact of this
cannot be accounted for.
114. Multiple Pots – Assumptions on the proportion of members that are expected to
have multiple (more than one) deferred small pots are based on DWP’s analysis of findings
from ONS’ Wealth and Assets Survey274
. The Wealth and Assets Survey (WAS) is based
upon self-reported findings from individuals and therefore, especially due to the inertia
around pensions there is the potential for individuals to undercount the number of deferred
pension pots they may have. The Department considers this to be the best estimate
available around the number of deferred pension pots per individual. Early findings from
PPI’s Data Project275
suggest an average of 1.3 memberships per individual across the five
schemes involved, matching the 1.3 (rounded to the nearest Tenth) pots per individual
estimated from findings from WAS Round 8 (2020-2022).
• The number of members that were identified within the Pensions Data Project276
across multiple schemes increased from 14% in 2019 to 18% in 2022.
115. Communication Costs – The increased transfers of pension pots could increase the
costs to schemes in relation to communications. The transfer process could include a
number of communications to be sent such as informing members of the transfer and
273
https://www.gov.uk/government/consultations/ending-the-proliferation-of-deferred-small-pension-pots/ending-the-
proliferation-of-deferred-small-pots#:~:text=Summary%20of%20responses,-
8.&text=The%20majority%20of%20respondents%20agreed,growth%20of%20deferred%20small%20pots.
274
https://www.ons.gov.uk/peoplepopulationandcommunity/personalandhouseholdfinances/debt/methodologies/wealthandassetss
urveyqmi
275
https://static1.squarespace.com/static/5d88d0560f00b11d45ecc14e/t/67ab67b59770e3017c018071/1739286456765/202502+P
DP+Lessons+Learned+matching+provider+data.pdf
276
https://static1.squarespace.com/static/5d88d0560f00b11d45ecc14e/t/67ab67b59770e3017c018071/1739286456765/202502+P
DP+Lessons+Learned+matching+provider+data.pdf](https://image.slidesharecdn.com/impactassessment1-250608191506-683de423/85/impact_assessment-1-DWP-document-300-pagespdf-163-320.jpg)
![Error! Unknown document property name.
164
requesting if the member would like to opt-out or choose a consolidator scheme (under a
consolidator solution). This could therefore increase the overall communication costs
involved for schemes. It is expected that these increased costs would be offset by a
reduction in communication costs elsewhere through the reduction in small pots over time.
Any improvements in engagement as a result of consolidation could improve digital
engagement and therefore further reduce the need for paper communications which
represent a significant cost over digital communications.
• Any communication costs experienced within the transition period and particularly
those around the set up of the Small Pots Data Platform are assumed to be covered
by the estimated £144m data standardisation costs, this is explained further
previously [line 108].
Option 0: Do Nothing Costs & Benefits
Costs and Benefits to Industry
116. Without intervention to address the issue of small pots there would be no additional
costs or benefits to schemes or members. Evidence shows that over 10 years from 2028-
2037 the number of small pots will likely rise from around 18m to close to 30m without
intervention based on the current central estimates for the rate of yearly growth [line 128].
117. Based on the average small pots value of £330 being charged the average AMC
across Qualifying bundle schemes of 0.48%277
- this would mean schemes would be
generating £1.58 per pot each year, against an estimated administration cost of around £20
[line 112]. Meaning potential losses of over £18 per small pot each year.
118. The Department estimates that across existing pots below £1,000, industry costs are
already close to £240m a year, with the Small Pots Cross Industry Co-Ordination Group
estimating that “the proliferation of small, deferred pensions by 2030 will likely result in
wasted administration costs of around a third of a billion pounds per annum”278
. By 2038,
without intervention this could mean losses above half a billion pounds per annum, a
significant cost burden on schemes.
119. Combining the already high levels of industry losses as a result of small pots
alongside the high level of individual inertia around pensions (preventing individuals from
requesting their pots be consolidated) and the potential expansion of automatic enrolment to
18-21 years olds279
industry losses could continue to rise even further with the potential for
the pensions landscape to be further inundated with the creation of small pots.
Costs and Benefits to Individuals
120. The AMC levied upon the majority of small pots is not enough to cover the
administration costs borne by schemes and this would be expected to continue with no
intervention. To address this, many members with larger pension pots are effectively
charged higher fees to cross-subside the loss-making nature of small pots. Higher charges
reduce the value of members’ pension pots and results in poorer retirement outcomes. It
could be expected that as the number of small pots continued to grow this problem becomes
increasingly exacerbated.
121. The introduction of the Pensions Dashboard280
will provide an online platform for
members to centrally access their pensions information, in the hope to address low
engagement. The expected level of engagement with Dashboards remains uncertain and as
277
https://www.gov.uk/government/publications/pension-charges-survey-2020-charges-in-defined-contribution-pension-
schemes/pension-charges-survey-2020-charges-in-defined-contribution-pension-schemes#member-borne-charges-within-the-
cap
278
https://www.plsa.co.uk/Policy-and-Research/Document-library/Small-pots-cross-industry-co-ordination-group-Spring-2022-
report
279
https://commonslibrary.parliament.uk/research-
briefings/sn06417/#:~:text=A%20review%20of%20the%20policy,changes%20in%20the%20mid%2D2020s.
280
https://www.pensionsdashboardsprogramme.org.uk/](https://image.slidesharecdn.com/impactassessment1-250608191506-683de423/85/impact_assessment-1-DWP-document-300-pagespdf-164-320.jpg)
![Error! Unknown document property name.
165
Dashboard would not be a tool to enforce consolidation, the impact of its implementation
upon consolidation is therefore unknown.
122. The Pensions Dashboard should help to re-unite members with their lost pots, as
whilst members can currently use the Pensions Tracing Service to trace any lost pots, the
Pensions Dashboard should display all pots belonging to a member including any lost pots
within a central online infrastructure. Therefore, this has the potential to reduce the number
of lost pots that need to be found at the point of decumulation and could potentially have
some impact on member-led consolidation figures. All this could make it easier for engaged
members with lost pots to make pension decisions and improve the experience for members
at the point of decumulation.
• Prior to the implementation of the Pensions Dashboard, the suggestion is that use of
the Pensions Tracing Service is low. Findings from Wave 2 of the PPLL survey281
,
discussed below [line 147], suggest only 3% of all respondents aged 40-75 had used
the Pensions Tracing Service in the past 12 months or had checked for lost pension
pots. A potential indicator that wider pensions engagement remains low.
Option 1: Multiple Default Consolidator (preferred option) Costs &
Benefits
123. It has been assumed that all deferred small DC pots created since and as a result of
AE are in scope, and that all DC workplace pension pots below the pot size limit of £1,000
are automatically transferred (minus 3.5% opt-out and mis-match rate of 5%).
124. Figure 11 summarises the costs and benefits estimated under a Multiple Default
Consolidator Solution.
Figure 11 – The estimated monetised costs and benefits to industry and individuals
of a Multiple Default Consolidator Solution
Multiple Default Consolidator
Industry Individual
Familiarisation Costs: £0.2m Consumer Surplus (benefit): £81.0m
Small Pots Data Platform (cost): £216.0m Lower Charges (benefit): £805.8m
Transfer Costs: £215.0m
Pot Administration Savings: £1,168.3m
Net Benefit: £737.2m Net Benefit: £886.9m
Costs to Industry
125. The Department expects there would be a number of costs to industry as the result of
the implementation of a Multiple Default Consolidator solution.
126. Familiarisation costs – These are the costs incurred by schemes to understand and
comply with the new regulations and would form part of the transition costs to industry prior
to implementation. The Department’s estimate of the familiarisation costs covers the time
and cost of staff for schemes to familiarise with the multiple default consolidator legislation,
including reading through the legislation documents and undertaking a gap analysis (to
recognise the requirements to comply with the new legislation).
• The assumptions of the costs to schemes of familiarising with the new legislation are
based on the FCA’s cost-benefit analysis on Investment Pathways with some
adjustments to account for the trust-based market282
. This was based on a survey of
around 70 pension schemes and supplemented with FCA’s wider evidence on costs
281
‘Planning and Preparing for Later Life 2024, DWP, publication forthcoming’
282
https://www.fca.org.uk/publication/consultation/cp19-05.pdf](https://image.slidesharecdn.com/impactassessment1-250608191506-683de423/85/impact_assessment-1-DWP-document-300-pagespdf-165-320.jpg)
![Error! Unknown document property name.
166
of compliance, thereby giving confidence in the estimates and wide-spread market
coverage. This estimated:
o The policy documentation to be 40 pages which would take around 2 hours to
read. Given both proposals are focused on the pensions industry and the current
uncertainty over the length of any legislation for a multiple default consolidator
solution it is assumed that the proposed multiple default consolidator legislation
would be of a similar length. The Department has presented the impacts of a
reduction and increase in the number of legislative pages within the sensitivity
analysis [line 246].
o Based on TPR input, the average number of trustees per pension scheme is
assumed to be around 3 and the average hourly wage of each trustee, using
ONS ASHE data, is assumed to be around £36.51.
• This has then been scaled up across the whole market based on the Department’s
estimates on the number of DC workplace schemes in 2028. With current
consolidation expected to continue at a similar rate of around 12%283
, the number of
schemes is estimated at under 700 in 2028, down from around 1,110 in 2024284285
.
Therefore, a total familiarisation cost of around £189,000 is estimated, after a 25%
optimism bias is applied.
127. Small Pots Data Platform – As referred to above [line 108] the Department has
estimated the costs of the build and set-up of a Small Pots Data Platform that would help
facilitate the consolidation of small pots to be £216m over the 2 years of transition costs.
There may be alternative approaches taken after further feasibility analysis is undertaken;
though the Small Pots Data Platform is currently the most developed concept. The cost
profile could be different depending on delivery models. For the purposes of this IA, it is
assumed that the build costs of a Small Pots Data Platform would be directly funded by the
pensions industry. Therefore, in this IA the costs of a Small Pots Data Platform have been
classified as a direct cost to business.
128. Transfer Costs – The cost of transferring deferred small pots for consolidation is
considered a significant ongoing cost to industry. The estimated transfer costs across the
10-year appraisal period of £215m are based on the cost of transferring the current stock in
the year of implementation and then the yearly creation of small pots in the following years
thereafter. In the initial year of implementation, the number of transfers required is based on
the Department’s projected number of small pots expected in 2030 (more detail below).
• Cost of Transfer per pot – The cost of a transfer pot has been estimated at an initial
cost of £20 per pot (£10 cost for both the ceding and receiving schemes). The
Department has assumed that over time the costs of transfers will begin to fall, with a
reduction in costs expected from year two after implementation falling by £2 per
transfer to a total cost of £18 by 2031. Transfer costs are then expected to continue
falling by £2 each year until year four (2033) after implementation where costs are
assumed to have fallen to £14 per pot which is the assumed total cost for each
transfer in the following years of consolidation modelled within the 10-year appraisal
period.
o Initial costs of £20 per transfer are based upon provider data, similar to the cost
estimates of administration costs mentioned previously. Figures from the
Department’s 2024 data gather largely varied between £20-£40 per transfer, which
aligned with previous figures from the Department’s 2023 Call for Evidence which
283
https://webarchive.nationalarchives.gov.uk/ukgwa/20240605045559/https://www.thepensionsregulator.gov.uk/en/document-
library/research-and-analysis/occupational-defined-contribution-landscape-2023
284
https://www.fca.org.uk/publication/consultation/cp24-16.pdf
285
https://webarchive.nationalarchives.gov.uk/ukgwa/20240605045559/https://www.thepensionsregulator.gov.uk/en/document-
library/research-and-analysis/occupational-defined-contribution-landscape-2023](https://image.slidesharecdn.com/impactassessment1-250608191506-683de423/85/impact_assessment-1-DWP-document-300-pagespdf-166-320.jpg)


![Error! Unknown document property name.
170
industry, with the small pots problem believed to persist largely within the larger
Master Trust schemes.
129. Existing Consolidator Schemes – Currently within the DC pensions market, some
schemes already offer consolidation services to members. With the business model of some
schemes focused on consolidating pots into one pot within their scheme. The introduction of
a multiple default consolidator solution that would be free to members could have an
implication on these schemes. The potential implications have not been monetised, but the
impact is expected to be minimal, with the pot limit of £1,000 meaning only those pots that
are currently unprofitable would be within scope of a consolidator solution, pots that are
unlikely to be those targeted by the existing consolidator schemes. Evidence also does show
that existing consolidation levels remain low, further discussion around the potential impact
on existing consolidator schemes is discussed below [line 240].
Costs to Individuals
130. A significant benefit of a Multiple Default Consolidator solution is that the Department
does not consider there to be any cost to employees as the solution would be addressing
pots that have been deferred for at least 12 months and therefore are no-longer receiving
any employer or employee contributions.
131. The consolidation of members’ deferred small pots under a default consolidator
solution would be free of charge and therefore there would be no direct costs to members
involved in the process of consolidation.
132. Risk of schemes passing on costs – The costs of a Small Pots Data Platform are
likely to represent a significant cost to industry and therefore there is a risk that some
schemes could mitigate against these costs by passing them on to members through higher
charges. On balance, the risk of this is considered low given:
• Schemes compete heavily on charges, with the average charge well below the charge
cap of 0.75%292
- so are unlikely to raise charges as would risk becoming
uncompetitive.
• The costs of a Small Pots Data Platform are likely to borne across the pensions
industry – reducing the average cost to each scheme and therefore reducing the need
for individual schemes to offset any costs through increased member charges.
• Small pots are currently loss-making, so the expectation is that in in the long-term
schemes will benefit from the consolidation of small pots even when considering the
cost implication of a Small Pots Data Platform and therefore cost savings should
mitigate against the need to recoup increased costs through member charges.
• Given that price-setting is commercially sensitive and challenging to estimate as well
as the downward pressure on charges across the pensions industry it is assumed that
any increase in costs would not be passed on to members.
133. Charges – There is the risk to members of their pots being moved to a scheme with
higher charges and/or lower investment returns. However, given the authorisation regime to
become a consolidator scheme, VfM framework293
and other mitigations including the 0.75%
charge cap294
and the de minimis295
– members are unlikely to face detriment as a result of a
consolidation solution.
134. Whilst the de minimis protects the smallest pension pots from flat fees, there is the
potential for some members to be disadvantaged, with the combination of numerous very
small pension pots. Schemes are currently unable to charge flat fees on pension pots below
£100, however, if when consolidated a member’s small pots had a combined value greater
292
https://www.gov.uk/government/publications/pension-charges-survey-2020-charges-in-defined-contribution-pension-
schemes/pension-charges-survey-2020-charges-in-defined-contribution-pension-schemes#member-borne-charges-within-the-
cap
293
https://www.fca.org.uk/publication/consultation/cp24-16.pdf
294
https://assets.publishing.service.gov.uk/media/61d823e3d3bf7f053fd8254e/charge-cap-guidance.pdf
295
https://www.gov.uk/government/consultations/permitted-charges-within-defined-contribution-pension-schemes/permitted-
charges-within-defined-contribution-pension-schemes](https://image.slidesharecdn.com/impactassessment1-250608191506-683de423/85/impact_assessment-1-DWP-document-300-pagespdf-170-320.jpg)
![Error! Unknown document property name.
171
than £100 this pot could now face a flat fee from some schemes. Resulting in a flat fee being
charged on a pension pot of minimal value, increasing the risk of the pot being eroded over
time.
• The impact of this is thought be largely outweighed for most members through the
benefits of consolidation and the Department is considering the level of the
deminimis, for consolidated members, which would reduce the number of members
facing flat fees, but any change is yet to be decided.
Costs and Benefits to Employers
135. The Department does not anticipate there to be a cost to employers as the result of
the consolidation of small pots as the consolidation process under a multiple consolidator
solution would be separate to employer interactions with employees’ workplace pensions.
The process of consolidation will be the responsibility of the pension schemes and supported
by the Small Pots Data Platform and would require no input from employers as only deferred
pots would be within scope.
• Employers would not be involved in the consolidation process under a multiple
default consolidator solution.
136. As the Policy details are still to be finalised, whilst employers will have no direct role
in the consolidation process the Department is considering increasing the duties on
employers in terms of updating member records and adding email addresses for example
where appropriate to support the consolidation process. If decided on, there is the potential
for some minimal administrative cost on employers as a result. Any increase in costs
experienced by employers would be to improve member records across the industry and not
necessarily specific to a consolidator solution.
Benefits to Industry
137. The consolidation of small pots will result in a reduction in the number of pots having
to be administered across the DC workplace pensions market and with the majority of these
small pots expected to be loss-making to schemes the Department considers this reduction
in administration costs as a result to be a significant benefit to schemes.
• For schemes transferring out small pots, the reduction in administration costs as a
result should outweigh the estimated transfer costs per pot [line 128].
138. The reduction in the number of pots that schemes have to administer as a result of
the consolidation of small pots will represent a reduction in total administration costs. As
previously referenced [line 112], the average administration cost of a deferred pot has been
estimated at around £20 per pot and therefore once accounting for the estimated charge that
would’ve been applied to each of these deferred pots (average value * average % AMC) this
is the assumed saving benefit to industry of the cumulative reduction of each small pot. With
each reduction in the number of pots representing a cost saving of around £18 per pot
reduced per year. The benefits are compounded each year with a reduction in one year
representing a saving in the following years compared to a do-nothing approach where the
assumption is that the scheme would have continued to administer the small pot as member-
led consolidation is unlikely.
139. The Department’s modelling of the impacts of the introduction of a Multiple Default
Consolidator solution which are modelled in Figure 13 below, calculates the projected costs
and benefits of the transfer process and the reduction of small pots through consolidation. It
should be noted that the modelling doesn’t account for transition costs, but these have been
monetised previously, instead it focuses on the costs and benefits of the transfer process
involved after implementation.](https://image.slidesharecdn.com/impactassessment1-250608191506-683de423/85/impact_assessment-1-DWP-document-300-pagespdf-171-320.jpg)

![Error! Unknown document property name.
173
is assumed to remain below £1,000. Only, as outlined in the assumption above,
those consolidator pots assumed to have a value above £1,000 would class as a
further reduction in the number of small pots (which would represent reduction of two
small pots for the outlined scenario if the consolidator pot had a value above £1,000).
Benefits to Individuals
142. The Department’s assessment is that fewer deferred small pots would be of benefit
to individuals, who would see their pension savings spread across fewer schemes. The
benefit will largely be felt amongst those who would’ve otherwise accumulated a large
number of deferred small pots.
143. Although it is expected that the industry savings generated by an automated transfer
solution would be passed on to members in the form of lower charges, given it’s a
competitive price-based market and average AMCs are already below 0.5%, the impact on
charges in % terms is likely to be small. As part of the analysis to support the July 2023
pension reforms, the impact on charges of a multiple default consolidator model were
estimated to be a reduction of 2 basis points.296
For a median earner with a full work history,
this reduction was modelled to increase their pension pot by £700 at retirement (2023
earnings terms), and £500 for a National Living Wage earner. Across millions of savers, the
extra pension income would represent billions of pounds.
144. The Department has attempted to monetise the benefit to members of a 0.02%
reduction in average AMCs, bringing the average charge per pot down from 0.48% to 0.46%.
This reduction in the average % AMC represents the removal of the cross-subsidisation
effect alluded to previously [line 47] with the reduction in small pots meaning schemes no-
longer have to counter the loss-making nature of these small pots by applying higher
charges across all members.
• Therefore, the Department has calculated the saving to members of a 2-basis points
reduction in the average % AMC as a saving across all pots within the DC market
and not just small pots by estimating projected values of DC assets across the DC
pensions market.
• It is assumed the reduction in costs would not occur at the point of implementation
but would instead take a number of years before any costs savings are passed on by
schemes to members. The benefits of lower charges have therefore been monetised
from 2034-2037 and are estimated to represent a total benefit of £805.8m to
members over these four years.
145. Consumer Surplus - The automatic consolidation of small pots should bring a direct
economic benefit to some members through the consumer surplus they accrue from the free
of charge nature of a default consolidator solution. For members that would have been
willing to pay a sum of money for the automatic consolidation of their deferred pension pots
(below £1,000), their consumer surplus will represent the value in which they would have
been willing to pay for said automatic consolidation. Therefore, a default consolidator
solution should represent a direct monetary benefit to these members.
146. Not all members that would see their deferred small pots consolidated would have
been willing to pay to have their small pots automatically consolidated and therefore a
default consolidator solution would bring them no consumer surplus by providing a service
that the member would have been unwilling to pay for.
147. Respondents were asked about their willingness to pay for the automatic
consolidation of their small pots in a recent wave of the Planning and Preparing for Later Life
(PPLL) survey297
. The PPLL survey is a cross-sectional survey of GB adults aged 40-75 that
is nationally representative and commissioned by DWP, covering a range of DWP policy
areas.
296
https://assets.publishing.service.gov.uk/government/uploads/system/uploads/attachment_data/file/1168816/analysing-the-
impact-of-private-pension-measures-on-member-outcomes.pdf
297
‘Planning and Preparing for Later Life 2024, DWP, publication forthcoming’](https://image.slidesharecdn.com/impactassessment1-250608191506-683de423/85/impact_assessment-1-DWP-document-300-pagespdf-173-320.jpg)

![Error! Unknown document property name.
175
Figure 14 – Estimated Consumer Surplus from a multiple default consolidator
solution298
Low Estimate Central Estimate High Estimate
Number of members modelled to have a
small pot consolidated over the 10-year
appraisal period
9,300,000 9,300,000 9,300,000
Average Value Willing to Pay £5.00 £8.80 £16.80
Total Consumer Surplus £46,300,000 £81,000,000 £155,500,000
Source: DWP calculations from Planning and Preparing for Later Life Survey (PPLL)299
160. Considering the central estimate, the monetary benefit to individuals as a result of the
consumer surplus gained by the free provision of a default consolidator solution is estimated
to be £56.4m in the year of implementation (after the two year transition period) where the
stock of small pots would be addressed.
161. Based on a growth of 1.3m small pots each year after the initial year of
implementation there would be an expected consumer surplus gained by the continued
transfer of small pots each year. This has been estimated as a yearly consumer surplus
benefit of around £3.5m, therefore the total consumer surplus over the 10-year appraisal
period has been estimated at £81m, as shown in Figure 14.
Summary of Costs and Benefits
162. The Department has monetised a number of estimated costs and benefits across
schemes and members with total costs to schemes estimated at £407.2m (Present Value).
The Department then estimates the total benefits across the 10-year appraisal period to be
around £1.65bn (Present Value) of which £957.7m (Present Value) is expected to be a
benefit to schemes and around £694.8m (Present Value) expected to be the monetary
benefit to members.
163. For purely comparative purposes the Department has modelled the impacts (costs
and benefits) of a Single Consolidator (new scheme) and a Single Consolidator (existing
scheme) solution with both tables included in Annex C. As with Figure 13, Figure 33 and
Figure 34 have only focused on the cost and benefits to schemes of the transfer process and
have not considered the wider transition costs or the monetary benefits to members of either
option.
• The wider costs and benefits of a single consolidator model have not be explored due
to both models not being considered as a viable model to address the stock and flow
of small pots whilst supporting both members and the wider pensions industry as has
been discussed previously [line 84]. More work with industry therefore would be
needed to portray the wider costs and benefits of these models, this was not deemed
necessary as neither solution is thought to be viable when compared to a multiple
default consolidator solution.
o Whilst the wider monetary costs and benefits would be expected to differ to those
discussed and monetised for a multiple default consolidator solution the format of
the cost and benefits could be expected to be broadly similar albeit differences in
set-up and implementation costs and then any nuances in the ongoing costs
depending on policy development.
Option 2: Pot follows Member (PfM) Costs and Benefits
164. The Department has estimated the monetised costs and benefits that would be
anticipated under a PfM model. Figure 15 highlights the monetised costs and benefits of PfM
estimated by the Department.
298
Figures have been rounded within the table to the nearest 100,000 where applicable
299
‘Planning and Preparing for Later Life 2024, DWP, publication forthcoming’](https://image.slidesharecdn.com/impactassessment1-250608191506-683de423/85/impact_assessment-1-DWP-document-300-pagespdf-175-320.jpg)
![Error! Unknown document property name.
176
Figure 15 – The estimated monetised costs and benefits to industry and individuals of
a Pot follows Member (PfM) solution
Pot follows Member
Industry Individual
Familiarisation Costs: £0.2m Consumer Surplus (benefit): £56.2m
Small Pots Data Platform (cost): £216.0m Lower Charges (benefit): £402.9m
Transfer Costs: £161.9m
Pot Administration Savings: £962.7m
Net Benefit: £584.7m Net Benefit: £459.1m
Costs and Benefits to Industry
165. The costs involved in the implementation of PfM would be expected to be borne by
schemes. The Department has monetised a number of the key costs and benefits that would
be expected under a PfM solution:
• Familiarisation Costs – These would be expected to be similar to the familiarisation
costs estimated by the Department for the implementation of a Multiple Default
Consolidator solution and therefore for this IA the same familiarisation costs for a
consolidator and PfM solution have been used. As outlined in more detail above [line
126], familiarisation costs across the 2-years of transition before implementation
have been estimated at £189,000 across all schemes.
• Small Pots Data Platform – The Department has also estimated the build and set-
up costs of a Small Pots Data Platform for a PfM solution with a Small Pots Data
Platform being the current most developed concept to support the transfer process,
discussed previously [line 127]. How the design requirements or functionality of a
Small Pots Data Platform may differ under PfM compared to a default consolidator
solution is currently unknown due to the uncertainty surrounding a central
mechanism. Therefore, the Department has assumed the same cost estimates for a
Small Pots Data Platform under PfM as those discussed previously for a default
consolidator solution [line 108], as the foundational purposes would likely to be
similar under both solutions. The costs of a Small Pots Data Platform under PfM
therefore have been estimated as £216m over the 2 years of transition costs.
• Transfer Costs – A PfM solution would require the transfer of pension pots when
individuals move employment and therefore schemes would face an increase in
overall transfer costs due to an increase in the number of transfers.
o Due to the build-up of the stock of small pension pots, it is assumed that when an
individual moves to a new employer and a new automatic enrolment DC scheme,
their existing pots (created since the introduction of automatic enrolment) are in
scope to be automatically transferred to their new scheme.
o Purely for illustrative purposes, it is assumed that all DC workplace pension pots
are eligible, as the scale of pots with particular rights or guarantees is unknown,
and that all DC pension schemes are eligible to receive pots. In practice, the
Government could limit the scope to only pots created after the implementation
date, pots without any extra rights or guarantees, and limit the eligibility of
schemes to receive pots through an authorisation process.
166. The number of transfers that would be expected under a PfM model is closely linked
with the labour market and the expected movement of members between employments. The
estimate that individuals move jobs every 3 years has been used alongside analysis of
Wealth and Assets Survey data to estimate the number of transfers required each year.
• The estimate that on average an individual moves jobs around every 3 years is
based on DWP’s analysis of HMRC’s RTI data using the median job count figures
discussed in further detail in Annex A.](https://image.slidesharecdn.com/impactassessment1-250608191506-683de423/85/impact_assessment-1-DWP-document-300-pagespdf-176-320.jpg)
![Error! Unknown document property name.
177
167. The same cost savings of bulk transfers that have been estimated under a
consolidator solution would not be expected under PfM. An initial transfer cost of £20 per
pot has been estimated, with more detail given on the evidential base around this given
previously [line 128]. However, unlike under a consolidator model, no economies are scale
are expected to be realised, with a lower likelihood of bulk transfers being widely used and
an overall reduction in the number of transfers required. Therefore, across the 10-year
appraisal period transfer costs are expected to remain at £20 per pot. Therefore, the
Department estimates total transfer costs of a PfM model over the 10-year appraisal period
to cost schemes £161.9m. This cost estimate would be impacted by any changes within the
labour market and any potential cost savings around transfers as a result of a PfM solution.
168. The initial transfer costs would depend on the design and timings of the solution. For
the purposes of this IA, the transfer of a small pot has been assumed to occur when a
member moves within the labour market and joins a new scheme. The movement of small
pots is assumed to be based on the job churn of individuals.
o If schemes were to immediately begin to search for an active pot to transfer out
their current small pots and/or schemes immediately search for deferred pots to
transfer into their members’ current active pots, the level of transfers within the
first few years after implementation could be higher.
o The interactions of schemes and a Small Pots Data Platform would largely
determine the rate at which small pots are moved between schemes.
• Staggered movement of Small Pots – As referenced above, it is assumed that there
would not be a big bulk movement of small pots at the point of implementation. This
accounts for:
o It may be harder for schemes to find an active pot in which to transfer their
deferred pots into as it relies on members with small pots currently making active
contributions into a pension pot – some for example may not be within the labour
market or may have opted out of workplace pension savings.
o The design of a PfM solution, may mean that schemes have to wait until a new
pot has been created by a member in-order to trigger the transfer process – which
may result in schemes taking a longer period to report a small pot as schemes
wait until a new pot has been identified.
169. Figure 16 highlights the Department’s estimates for the impact of a Pot follows
Member solution based just on the transfer process with no transition costs included.
Figure 16 – Estimated impacts under a Pot follows Member (PfM) solution
PfM (Central Estimate)
No. of
transfers
(m)
Cumulative
reduction in
deferred small
pots (m)
Cost
(£m)
Benefits
(£m)
Net
(£m)
2030/31 3.1 -3.1 62.2 57.3 -5
2031/32 2.2 -5.3 43.6 97.4 54
2032/33 1.2 -6.5 24.9 120.3 95
2033/34 0.3 -6.8 6.2 126.1 120
2034/35 0.3 -7.2 6.2 131.8 126
2035/36 0.3 -7.5 6.2 137.5 131
2036/37 0.3 -7.8 6.2 143.3 137
2037/38 0.3 -8.1 6.2 149.0 143
Cumulative 8.1 -8.1 161.9 962.7 800.9](https://image.slidesharecdn.com/impactassessment1-250608191506-683de423/85/impact_assessment-1-DWP-document-300-pagespdf-177-320.jpg)
![Error! Unknown document property name.
178
Notes:
i. Solution implemented (transfers begin) in 2030/31.
ii. 3.5% of individuals are assumed to opt-out.
iii. Pot size limit is £1,000 (2024 Earnings Terms)
iv. 5% mismatch rate
v. Volumes rounded to the nearest 0.1m
vi. An average of 1.3 small pots per individual with small pots
vii. The costs of administering a deferred small pension pot is assumed to be £20 per annum. Accounting for an average
management charge (AMC) of 0.48% based on the average small pot value, the saving through the reduction in
small pots is around £18 per pot per annum.
viii. The total cost of transferring a deferred small pension pot is assumed to be £20 across the 10-year appraisal period.
ix. Based on trends from Wealth and Assets Survey data, the proportion of individuals with multiple deferred small pots
is assumed to be between 30%-40% in 2030.
x. Individuals are assumed to move jobs every 3 years.
170. Figure 16 compares the reduction in small pots under PfM to the projection under the
‘do nothing’ scenario, estimating the number of transfers and the recurring administrative
cost and benefits which would arise as a result (i.e. the saving from no longer having to
administer small deferred pots and the cost of the transfers). Schemes would see higher
costs in the early years as they incur the upfront cost of processing transfers, but over time
this would be outweighed by the savings they make from having to administer fewer and
fewer deferred pots.
171. The reduction in the number of small pots through the transfer of members’ old
workplace pensions into their new AE schemes as they move employment should see a
reduction in the total number of loss-making pots that schemes must administer.
• Unlike the modelling of a multiple default consolidator solution, each transfer of a small
pot under a PfM solution is classified as a reduction in the number of small pots
regardless of whether the active pot the small pots have been consolidated into has a
value above £1,000 or not. This is because any small pots consolidated under PfM
would be consolidated into an active pot and therefore would no longer be classed as
a small pot even if the total value remains below £1,000 as the pot would not be
deferred.
172. The same assumption of £20 administration costs per pot for a multiple consolidator
solution have been used for the industry benefit estimates of a PfM solution due to both
solutions not expected to significantly impact the overall administration costs of individual
small pots. Based on this assumption, outlined in further detail previously [line 138], the
benefit to industry through a reduction in small pots as a result of a PfM solution have been
estimated to be £962.7m over the 10-year appraisal period.
173. The deferred pots which would remain in the system include those which are too big
to be transferred and those which remain deferred because the individual does not enter a
new DC scheme (for example because they have opted out, have not re-entered work or
have entered a DB or CDC scheme).
174. There is the potential that consolidating small pots into marginally larger pots could
have a behavioural effect on saving and hereby change the amount savers choose to save
into a pension. This could either be members choosing to increase savings as they are able
to better understand the income they can expect in retirement through their pensions or a
reduction in savings as the consolidation of pots means members’ pension savings may be
higher than they originally thought. Any behavioural impacts would vary on an individual
basis and therefore for the purposes of this IA it is assumed there would be no impact on the
amount of money saved by members. This is because of the relatively low value of the pots
involved and the low level of pension engagement of many members meaning contributions
are more likely to remain at the level set by their AE scheme or employer rather than being
changed by members themselves as a result of the combination of their old and new](https://image.slidesharecdn.com/impactassessment1-250608191506-683de423/85/impact_assessment-1-DWP-document-300-pagespdf-178-320.jpg)
![Error! Unknown document property name.
179
workplace pension pots. Therefore, the impact on the pension industry’s revenue has simply
been looked at in the terms of any changes in the number of pension pots to administer.
Costs and Benefits to Individuals
175. The Department has considered the potential impacts of a Pot follows Member
solution on members.
176. Consumer Surplus - The transfer of small pots into members’ active pots free of
charge should represent a monetary benefit to those members that would have been willing
to pay for these transfers. Whilst there are some differences in how a multiple default
consolidator and PfM solution would consolidate small pots, research suggests member
support for either solution300
and therefore the same method of calculating the consumer
surplus has been used for both models. The method used is explained in detail above [lines
145-158] and uses data collected through the PPLL survey301
.
177. Figure 17 below presents the estimated consumer surplus benefit of a PfM solution
over the 10-year appraisal period.
Figure 17 – Consumer Surplus of a Pot follows Member solution302
Low Estimate Central Estimate High Estimate
Number of members modelled to
have a small pot consolidated over
the 10-year appraisal period
6,400,000 6,400,000 6,400,000
Average Value Willing to Pay £5.00 £8.80 £16.80
Total Consumer Surplus £32,100,000 £56,200,000 £107,900,000
Source: DWP calculations from Planning and Preparing for Later Life Survey (PPLL)303
178. Considering the central estimate, the monetary benefit to individuals as a result of the
consumer surplus gained by the free provision of a pot follows member solution is estimated
to be £21.6m in the year of implementation (after the two year transition period).
179. Over the 10-year appraisal period, the total consumer surplus to members under a
PfM solution is estimated at £56.2m, however, depending on the true willingness of
members to pay, this figure could potentially vary between £32m-£108m as shown in Figure
17.
180. The proportion of members willing to pay and the value that they would be willing to
pay has been assumed to be the same under both a PfM and default consolidator solution,
however, it is possible that this would not be the case and without further research it is not
possible to say how the willingness to pay of members may vary across the two solutions.
Therefore, using the WTP data from the PPLL survey is considered by the Department as
the best estimate for the consumer surplus under a PfM solution. A low and high estimate for
the consumer surplus has been estimated to partly account for the uncertainty on the
similarity between the WTP of members across both a consolidator and PfM solution.
181. Lower Charges – As mentioned previously [line 171], the Department expects
schemes to benefit from the reduction in the number of pots to administer as a result of the
transfer of members’ small pots into their currently active pots under a PfM solution. The
Department has then considered that the expectation would be that the industry savings
would be passed on to members through a reduction in % charges.
300
https://www.gov.uk/government/publications/understanding-member-engagement-with-workplace-pensions/understanding-
member-engagement-with-workplace-pensions#consolidating-deferred-pension-pots
301
‘Planning and Preparing for Later Life 2024, DWP, publication forthcoming’
302
Figures have been rounded within the table to the nearest 100,000 where applicable
303
‘Planning and Preparing for Later Life 2024, DWP, publication forthcoming’](https://image.slidesharecdn.com/impactassessment1-250608191506-683de423/85/impact_assessment-1-DWP-document-300-pagespdf-179-320.jpg)
![Error! Unknown document property name.
180
• To monetise the potential benefit to members as a result of the lower charges, the
Department has utilised the same methodology used to monetise the benefit under a
multiple default consolidator solution which has been explained previously [line 144].
However, the expectation would be that the basis points reduction as a result of a PfM
solution would be below that previously modelled as a result of a default consolidator
solution.
• The reduction in charges is assumed to be lower than that under a default
consolidator solution due to a number of considerations:
o Pots could become deferred once again – As small pots would be transferred
into a member’s active pot in a PfM solution, depending on how close each
member is to retirement, there is a chance that members will move jobs again
before retirement. Depending on the pot limit set under a PfM solution for the
automatic transfer of deferred members it risks members creating numerous
larger deferred pots. If the pot limit was set around the £1,000 limit proposed
under a default consolidator model, the combination of small pots into an active
pot could easily result in a pot created with a value above this limit. Any pot
above the limit would not be eligible for an automatic transfer and therefore due
to inertia and lack of engagement would likely remain deferred were the member
to move jobs. As discussed previously [line 35] even pots up to around £4,000
can be loss-making and therefore there is the potential for a PfM solution to
transfer small pots into an active pot which could then itself become deferred and
still be loss-making for schemes. This would limit the economic benefit to
schemes and their ability to pass on lower charges to members as a result.
o Pots transferred into more schemes – The expectation under a default
consolidator solution is for a small number of already large schemes to apply for
authorisation to become consolidator schemes and therefore any pots
consolidated would be transferred to a small number of schemes that are already
benefitting from scale. The influx in small pots should allow the consolidator
schemes to further increase in scale and further benefit from doing so through
economies of scale. These economies of scale should allow schemes to reduce
fixed costs per member and negotiate lower fees helping them to offer members
lower charges, with a 2-basis point reduction modelled previously [line 143].
Under a PfM solution, however, the small pots could be transferred into a much
wider range of schemes which could limit the ability of schemes to grow in scale
as a result and therefore achieving economies of scale benefits would be more
challenging. The schemes that receive the transfer of small pots may not receive
enough in terms of scale to benefit and therefore could struggle to offer any
reduction in charges to members as they face a growth in loss-making pots in
which their scale is potentially not sufficient enough to comfortably outweigh.
o More frequent transfers of each pot – PfM may require the continued transfer
over time of a member’s combined deferred small pots and active pot as
members move jobs. This would require schemes to buy and sell assets as they
transfer members’ pots between schemes. This could increase the administration
costs to schemes and therefore reduce the likelihood that schemes would
experience a sufficient level of economic benefit to pass on to members through
lower charges.
• Although the impacts are challenging to know, on balance, it is expected that the risk
of a greater pool of smaller pots and them being spread across a wider range of
schemes may still result in a greater number of small pots remaining and thus losses
to industry under PfM. As a result, the reduction in lower charges is estimated at 1
basis points, rather than 2 basis points.
• The Department has therefore monetised a 1 basis-point reduction in % AMC charges
across all DC members under a PfM solution to account for the benefit that schemes
should be able to pass on to members. The benefits of lower charges has therefore
been monetised to represent a total benefit of £402.9m between 2034-2037.](https://image.slidesharecdn.com/impactassessment1-250608191506-683de423/85/impact_assessment-1-DWP-document-300-pagespdf-180-320.jpg)
![Error! Unknown document property name.
183
• The duration of the transition costs may deviate from the assumed two years, with
more certainty likely after the feasibility review around the Small Pots Data Platform.
Any deviation itself is not expected to impact the nominal monetary cost and benefit
estimates, rather the net present value calculations could be potentially impacted by
any changes in the distribution of the transition costs over a period of years.
198. Small Pots Data Platform (Red) – How the costs of a Small Pots Data Platform
would be re-couped from industry is currently under consideration, so whilst in this Impact
Assessment it has been assumed that any costs incurred would be paid directly by industry,
the Department is currently exploring how this would work in practice. The current process of
this is unknown and therefore a different mechanism or different timeframe may be used
after the build of a Small Pots Data Platform.
• After further feasibility analysis is undertaken, an alternative approach to a Small Pots
Data Platform could be taken, which could impact the cost estimates included within
this Impact Assessment. With any change in the delivery model of a central
mechanism likely to impact the cost profile. For the purposes of this IA, a number of
assumptions around a central mechanism have been made based on a Small Pots
Data Platform, which is currently the most developed and likely concept at this stage.
199. Year of Implementation (Green) – There is currently some uncertainty over the
timescale that would be required to implement a Small Pots solution, with more certain
expected as the policy progresses. For this IA, the Department has assumed the beginning
of the transition period to begin in 2028, with the full implementation and transfers occurring
from 2030 onwards. This is based on the assumption that this represents a reasonable
timeframe based on the current status of the policy development and the infrastructure
required for its implementation.
• If the timeframe for implementation were to differ from the one referenced in this IA,
there could be some small impact on costs and benefits depending on the scale of the
deviation.
200. £1,000 Pot limit (Green) – As part of legislation for a multiple default consolidator
solution an eligibility pot limit of £1,000 will be outlined and therefore throughout this IA, the
pot limit is assumed to remain at £1,000 across the 10 year-appraisal period. Reasons for
setting the initial eligibility pot limit at £1,000 are discussed previously [line 23].
• Whilst the Department plans to introduce legislation to support future uplifts of the pot
limit, any potential impact of an uplift cannot be considered as part of this IA as the
Department would only proceed with an uplift of the pot limit if and when this was
deemed appropriate to support member outcomes and the stability of the pensions
industry. Any instances of the pot limit being uplifted over time cannot be known in
advance, but there is the potential that both costs and benefits could change
depending on the potential for future changes in the eligibility for consolidation under
a multiple default consolidator solution.
Analytical Risks
201. Yearly Creation of Small Pots (Amber) – Projections over time are highly uncertain
and there are several upward and downward pressures on the potential creation of small
pots that may impact the Department’s best estimate of 1.3m small pots a year [line 128].
• Upward Pressures (Green) – include future policy expansions and changes (we’ve
not accounted for this) but could potentially expand eligibility for consolidation and
therefore the overall number of pot creations. An expansion of the population and/or
an increase in the size of the working population or any changes resulting in shorter
tenures could further increase the number of small pots created. These upwards
pressures are all uncertain but could have a potential impact on the number of small
pots created each year and the stock of small pots at the point of implementation.
• Downward Pressures (Green) – could also be the result of future policy expansions.
The trust-based side of the DC market is becoming increasingly concentrated and the
consolidation of the market continues to be encouraged. Within a more consolidated](https://image.slidesharecdn.com/impactassessment1-250608191506-683de423/85/impact_assessment-1-DWP-document-300-pagespdf-183-320.jpg)
![Error! Unknown document property name.
184
market, it would become increasingly likely that a member would return to the same
pension scheme over time as they move in and out of employment and/or pension
saving. This could result in a reduction in the creation of small pots as members
recommence contributions into their previously deferred pots. Currently, however, it is
known that not all pension schemes apply a lifetime pot model and therefore this
uncertainty means that any potential impacts cannot be currently accounted for.
• Since the introduction of AE, the rate of small pots creation has remained relatively
stable but the average growth in pots since AE may be less representative for future
growth. The number of instances of people that stopped contributions into a pension
after less than 6 months307
in 2021/22 nearly doubled when compared to 2015/16;
however, the Department’s evidence from industry does suggest a potential reduction
year on year in the growth of small pots. Therefore, any estimates do remain
uncertain.
o Comparisons (Green) – PPI suggested that the number of small pots within the
DC master trust market was likely to reach around 27m by 2035308
, very similar to
the Department’s estimates of an overall number of 27.3m small pots across the
DC market by 2035, based on a growth of 1.3m small pots each year.
❖ DWP modelling on the average year-on-year growth rate of DC memberships
between 2020/21 – 2024/25 returns an average yearly growth rate of 11%.
11% of the current stock of small pots would represent around 1.4m small
pots, similar to the Department’s estimate of a 1.3m growth rate each year. It
is difficult to extrapolate any average % growth figure over time due to the
compounding impact this would have and the changing growth in small pots
over time as the Automatic Enrolment market has matured since its
introduction and continues to do so.
o These comparisons help to give confidence to a somewhat highly uncertain
value.
202. Transfer Costs (Green) – It is unknown how quickly costs will fall. It is possible in
the interim period between the policy being announced and implemented that systems and
processes will be established which allow for cheaper transfers immediately, especially as
data quality improves in light of the Pensions Dashboard. The marginal savings of each
additional pot transferred simultaneously are also unknown, with industry suggestions that
the costs of bulk transfers can be highly subjective to a number of factors. This has been
addressed by staggering the projected reduction in transfer costs over a number of years of
the appraisal period after implementation to account for the uncertainty on how and when
cost savings may materialise within the transfer process. International evidence from
Australia has been used as a suggestion for the level of cost savings that could occur and
our sensitivity analysis [Annex B] portrays the impacts of transfer costs remaining stable
over the appraisal period, as well as transfer costs falling in the intervening period before
implementation.
203. Small Pots Data Platform (Red) – The costs of a Small Pots Data Platform are
currently uncertain with the estimates given within this IA being the Department’s current
best estimates. Further work through the feasibility review is exploring the infrastructure
required for a Small Pots Data Platform, which is hoped will help to refine the cost estimates
over time.
204. Lower Charges (Green) – A 2-basis points reduction in average annual
management charges across the DC market was estimated through modelling by the
307
https://view.officeapps.live.com/op/view.aspx?src=https%3A%2F%2Fassets.publishing.service.gov.uk%2Fmedia%2F64a82b88
a32f130013f068dc%2Fstopping-saving-and-pensions-in-payment-
statistics.ods%23%3A~%3Atext%3DAs%2520published%2520previously%2520in%2520the%2Cthe%2520financial%2520year
%25202021%2520to&wdOrigin=BROWSELINK (Table 7: Count of individuals who have stopped workplace pension
contributions in each year, by length of contribution period)
308
https://www.pensionspolicyinstitute.org.uk/research-library/research-reports/2020/2020-07-23-policy-options-for-tackling-
the-growing-number-of-deferred-members-with-small-pots/ (Policy options for tackling the growing number of deferred
members with small pots)](https://image.slidesharecdn.com/impactassessment1-250608191506-683de423/85/impact_assessment-1-DWP-document-300-pagespdf-184-320.jpg)

![Error! Unknown document property name.
186
size of the stock reduction that would be expected but work is ongoing with industry
stakeholders and others including PPI to better understand the instances of members having
multiple small pots.
207. Mismatch rates (Amber) – As previously stated, the evidence and research around
a mismatch rate is limited and therefore the Department has included a high and low
estimate in its sensitivity analysis of the costs and benefits of a multiple consolidator solution
[line 246].
• Low estimate of 9% is based on research by ITM published in PLSA’s report313
, with
the assumption that no further improvements in matching rates occur over time.
• High estimate of 1% is based on research conducted based on the Pensions
Dashboard314
that suggested with repeated matching attempts a matching rate above
99% could be reached and the assumption that matching rates should improve over
time.
• As with the opt-out rates used in the sensitivity analysis, a higher % figure is used for
the low estimate of the mismatch rate than for the high estimate as the low estimate
forms part of the wider analysis to model a low estimate for the number of transfers
and therefore a low estimate for the reduction in small pots and vice versa for the high
estimate. This is explained further below [line 255].
Summary of why Option 1 is the preferred option
208. A Multiple Default Consolidator solution presents the best overall net benefits of the
viable solutions explored by the Department and should provide a focus on improving
member outcomes throughout.
209. Do Nothing – Even with the introduction of the Pensions Dashboards and FCA’s
consultation on targeted support, due to their reliance on member engagement, the
continued growth in the number of small pots would be expected to continue as such
member engagement is not present at scale. The Department therefore does not consider
this a viable option. Under a “do nothing” approach the costs to schemes and the detriment
to members would be expected to increase as the number of small pots continued to grow.
210. Pot follows Member – As with a default consolidator solution, a PfM solution would
require the use of government legislation be that the use of existing powers that the
Government has already previously legislated for in anticipation of a small pots solution or
(most likely) the requirement for further government legislation. The transition costs are
assumed to be similar to those under a default consolidator model and due to the lower
number of transfers under a PfM model the yearly costs to schemes would be expected to
be lower than the yearly costs of a consolidator solution. The lower number of transfers due
to the initiation of any transfers based on when a member moves between employment
means that when compared to a consolidator model it is expected that a PfM model would
result in a lower overall reduction in the number of small pots over the 10-year appraisal
period. Therefore, whilst a consolidator solution is assumed to involve higher overall costs,
the benefit to both members and industry as a result of a larger reduction in small pots would
be expected to outweigh the higher costs.
• DWP analysis finds PfM would have slightly fewer pots consolidated compared to the
default consolidator approach (as discussed in the Costs & Benefit section). However,
it is recognised these results are uncertain and dependent on a number of
assumptions, including opt-outs.
313
https://www.plsa.co.uk/Portals/0/Documents/Policy-Documents/2021/Small-pots-cross-industry-co-ordination-group-update-
report.pdf
314
https://www.pensionfusion.com/sites/default/files/2022-
09/Pension%20Fusion%20-%20Pensions%20Dashboards%20-%20Getting%20to%20the%20heart%20of%20matching%20-%
20Single%20page%20view.pdf](https://image.slidesharecdn.com/impactassessment1-250608191506-683de423/85/impact_assessment-1-DWP-document-300-pagespdf-186-320.jpg)

![Error! Unknown document property name.
188
Monetised Benefits
Pot Administration Savings Direct
benefit to
business
The transfer of small pots will be a direct
action of the legislation and the first step
in the logic chain (the reduction in the
number of small pots). Therefore, it is
appropriate to see the reduction in costs
of administrating these pots as a direct
benefit.
Lower charges for Members Indirect
benefit to
Members
As it is a choice whether providers lower
the charges for members, this is
considered an indirect benefit. This is
because it relies on schemes passing on
some of their cost savings onto members.
As this is therefore “avoidable” and
requires an additional step in the logic
chain for the benefit for members to be
realised, it is considered indirect.
Consumer Surplus Direct
benefit to
Members
As all members of small pots will gain
directly from having their pots
automatically consolidated (unless they
opt-out), the consumer surplus from the
measure is a direct benefit to members. It
is a result of members having their pots
consolidated and these savers attributing
a value to this. This is the result of the first
step in the logic chain.
Summary of direct and indirect costs and benefits
214. The Department’s assessment is that a default consolidator solution would have no
cost burden, either directly or indirectly on members. The policy will focus on improving
outcomes for members.
215. All of the cost to schemes monetised are considered to be direct costs by the
Department.
216. Each of the costs and benefits to business and members have been explained in
further detail in the costs and benefits sections above [lines 123-163].
217. In the earlier sections of this Impact Assessment, the Department has included
estimates for the costs and benefits to both members and schemes of the introduction of a
multiple default consolidator solution. Therefore, the monetised values of any costs and
benefits to members have not been included again within this section, which instead focuses
on the direct costs and benefits to business.
Direct costs and benefits to businesses – EANDCB
218. Figure 19 summarises the direct costs and benefits to business of a multiple default
consolidator solution with all figures presented in present value form. The table also
summarises the EANDCB and Net Present Value figures for a multiple default consolidator
solution.](https://image.slidesharecdn.com/impactassessment1-250608191506-683de423/85/impact_assessment-1-DWP-document-300-pagespdf-188-320.jpg)
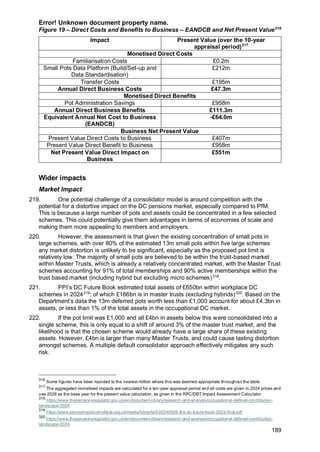
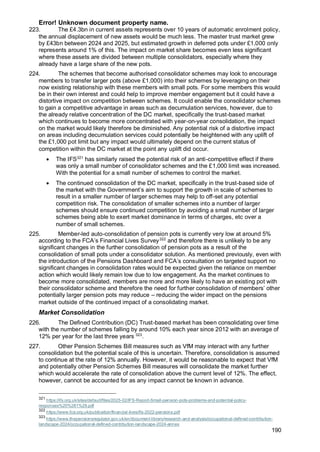
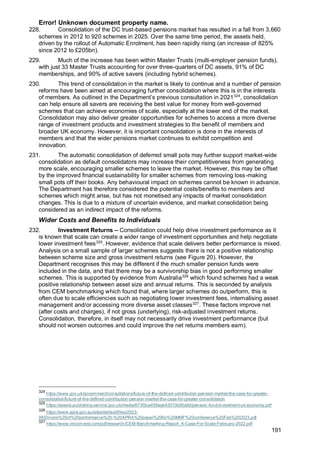
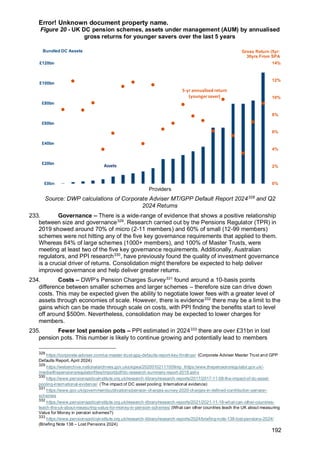

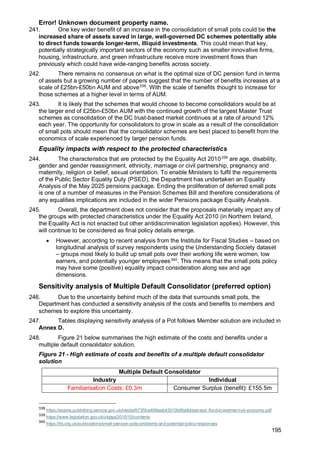
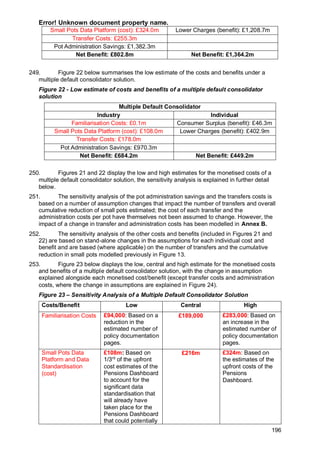


![Error! Unknown document property name.
199
260. A default consolidator model would be focused on pension schemes (rather than
wider businesses or employers) and the costs would be borne by schemes themselves, with
benefits for both members and schemes expected.
261. As discussed previously [line 10], the Department proposes based on the grounds of
proportionality that Small Self-Administered Schemes and Executive Pension Plans would
be excluded and that to apply the Default Consolidator framework to these micro schemes
would be disproportionate due to the cost the schemes would incur as a result. Therefore,
the very smallest pension schemes have been exempted.
262. As per the above referenced definition, small schemes (defined as having between
12 and 999 members) would be within the scope of a default consolidator solution.
Proportionality
263. The Department has estimated the monetised costs and benefits to small schemes,
along the same methodology as described previously within the main parts of this Impact
Assessment. As described below this shows that there is estimated to be a net benefit to
small schemes from this legislation.
264. To estimate the total number of small schemes in scope at the start of the appraisal
period, a number of assumptions have been used.
265. Consolidation – The reduction in the number of DC schemes each year has been
based on the assumption that the recent trend of consolidation will continue, with analysis of
TPR scheme returns data344
, suggesting an average consolidation rate around 12% per year
for the last three years. The number of contract-based schemes has been kept constant
across the appraisal period at around 30 contract-based schemes as the consolidation of the
DC market is currently focused on the trust-based side of the market. Some consolidation
within the contract-based market could occur but any such consolidation cannot be known in
advance and the absence of consistent consolidation over recent years means the
Department cannot quantify any potential impacts, any such consolidation would be
expected to be minimal.
266. Proportion of Small Schemes – Small schemes were calculated to account for 71%
of total DC schemes. This proportion has been kept constant across the analysis over the
10-year appraisal period due to the uncertainty of the extent to which consolidation might
impact this.
• The rate of consolidation of DC schemes is being driven by the reduction in small
schemes as they consolidate into the larger Master Trusts. Therefore, it could be
considered likely that with continued consolidation the proportion of small schemes in
the DC market will fall over time. If the number of small schemes were to fall in-line
with the expectation that the consolidation of the market will continue the costs and
benefits to small schemes outlined in Figure 25 could be reduced.
267. Based on these assumptions, the estimated number of small schemes in scope at
the start of the appraisal period (2028) is around 490.
268. Familiarisation costs have been estimated at around £135,000 for small schemes
split evenly across the two years of transition costs (2028, 2029). Whilst this represents a
significant proportion of the total estimated familiarisation costs, due to the larger number of
smaller schemes these costs would represent an average total cost of around £270 for each
of the 490 small schemes.
269. The costs and benefits to small schemes after implementation (2030-2037) are
based on the number of small pot transfers (modelled in Figure 13) that would be expected
344
https://webarchive.nationalarchives.gov.uk/ukgwa/20240605050724/https://www.thepensionsregulator.gov.uk/en/document-
library/research-and-analysis/occupational-defined-contribution-landscape-2023/occupational-defined-contribution-landscape-
2023-annex](https://image.slidesharecdn.com/impactassessment1-250608191506-683de423/85/impact_assessment-1-DWP-document-300-pagespdf-199-320.jpg)
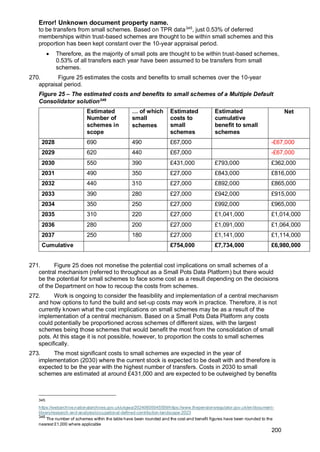
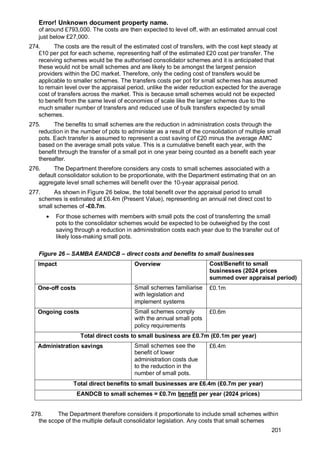
![Error! Unknown document property name.
204
• Improved performance on average for members with a DC pension, especially those
who previously had a number of small deferred pots.
• A potential for a financially stable and digitally possible expansion in the number of
pots that are eligible for consolidation.
Annexes
Annex A: Estimates of the number of jobs per individual
288. The Department had previously estimated an average of 11 jobs per individual over
their working lives, to support the Department’s understanding and work around the Small
Pots issue, 3 methodologies were explored to strengthen the Department’s estimate for the
average number of jobs per individual. The 3 methodologies used were as follows: HMRC
RTI data, DWP PENSIM models and external research and data as supporting evidence.
289. The analysis of these 3 methodologies was referenced above [line 16] but is
presented further below: His Majesty’s Revenue and Customs (HMRC’s) Real Time
Information (RTI) is a reporting system for income taxed via Pay As You Earn (PAYE). It is a
requirement of employers and pension schemes to report payments to employees or
recipients of occupational pensions to HMRC on or before each payment date where it is
practical to do so. HMRC provided DWP with RTI job count data, which the department has
then used here as a proxy for the average number of jobs per individual over a lifetime by
using the RTI employment tables which show the count of unique employment identifiers for
each NINO.
Figure 27 – Mean and Median job count figures by age and gender
Count of Jobs per Person
Female Male Overall
N Mean Median N Mean Median N Mean Median
Age
Band
Unknown 3,300 2 1 1,500 3 2 3,258,000 1 1
Under 16 10,300 1 1 9,000 1 1 20,000 1 1
16 - 25 3,315,000 4 3 3,319,000 4 3 6,640,000 4 3
26 - 35 5,404,000 5 4 5,618,000 6 4 11,034,000 6 4
36 - 45 4,864,000 4 3 5,201,000 4 3 10,066,000 4 3
46 - 55 4,097,000 4 3 4,271,000 4 3 8,368,000 4 3
56 - 65 4,082,000 4 3 4,155,000 4 3 8,237,000 4 3
66+ 7,248,000 3 2 7,804,000 3 2 15,054,000 3 2
Source: HMRC RTI Employment Tables
290. Figure 27 above summarises the mean and median number of unique jobs held by
individuals within different age bands with a split by gender as reported by HMRC’s RTI data
from April 2014 – March 2024. The age bands outlined within the table were calculated as of
4th
April 2024.
291. The distribution of individuals across the RTI data is heavily focused on a job count
ranging between 1-20 jobs, with less than 1% of individuals having a total job count of 20 or
above and 95% having 10 or less jobs according to the RTI data. Whilst the mean figures
from the table above provide an average number of unique employments by age and](https://image.slidesharecdn.com/impactassessment1-250608191506-683de423/85/impact_assessment-1-DWP-document-300-pagespdf-204-320.jpg)
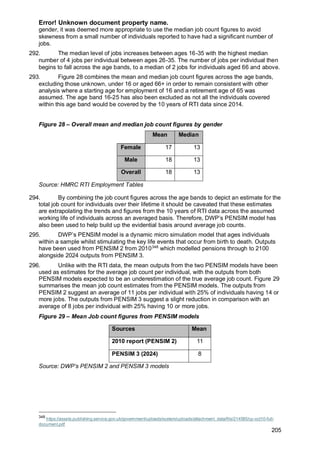
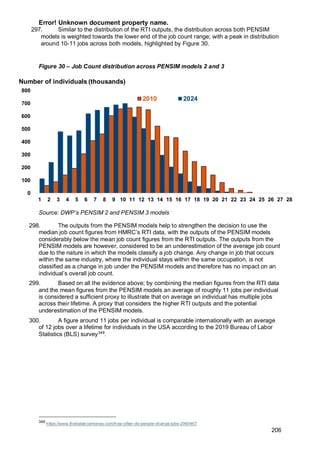
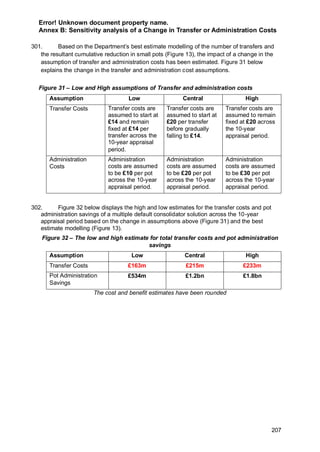
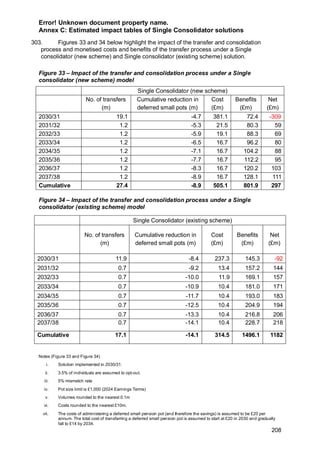
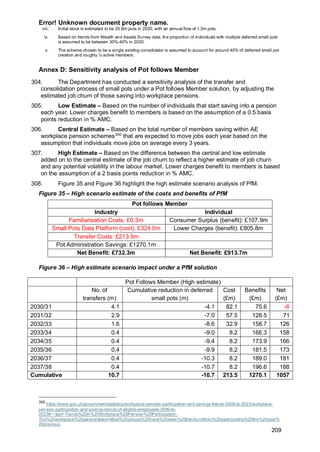
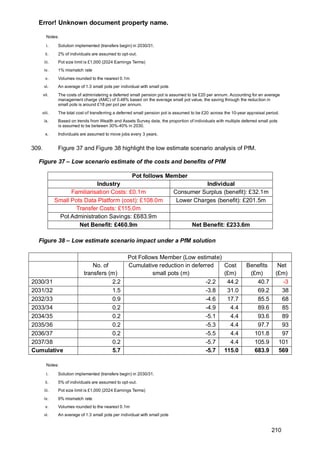
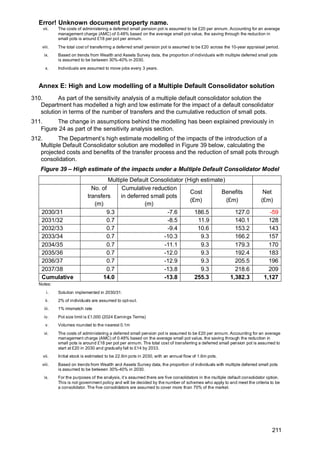
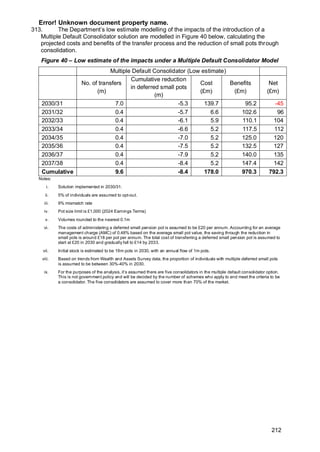

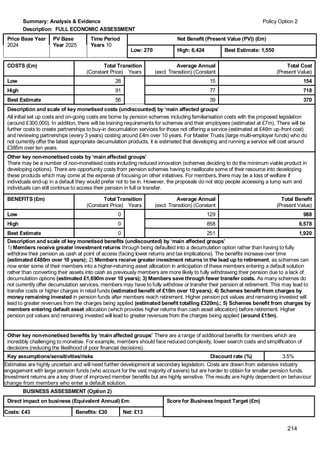

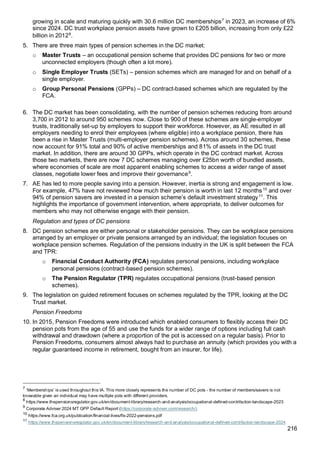
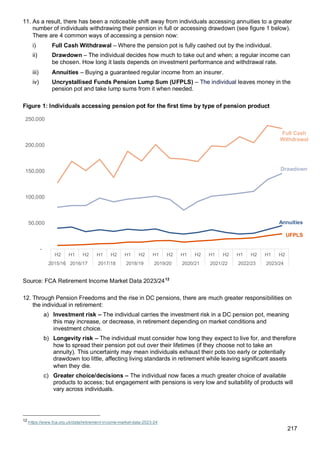

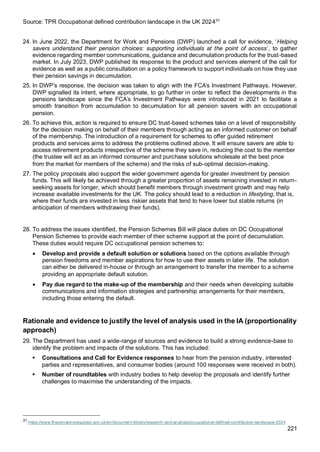

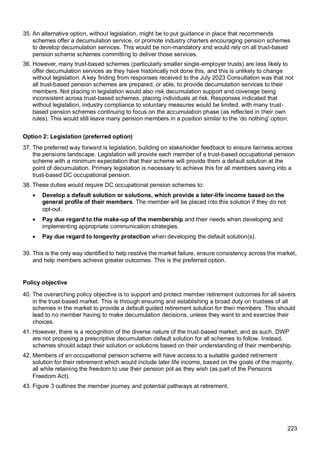
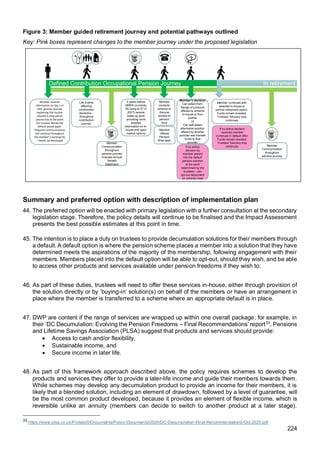

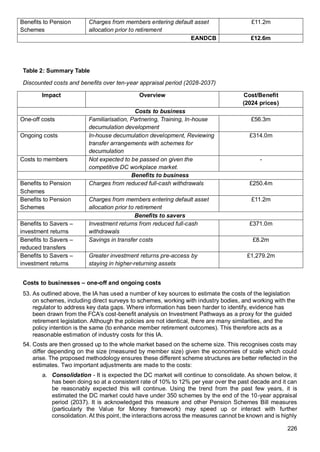
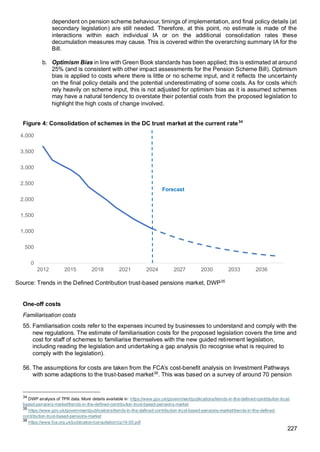
![228
schemes and supplemented with the FCA’s wider evidence base on costs of compliance, therefore
giving confidence in the estimates and wide-spread market coverage. This estimated:
• The policy documentation to be 40 pages which would take around 2 hours to read. Given
similarities in the proposals, it is assumed the proposed guided retirement legislation is similar
in length.
• Based on TPR input, the average number of trustees at schemes is assumed to be around 3
and the average hourly wage of trustees, using ONS ASHE data, to be around £36.51.
• This is scaled up across the whole market (1,080 schemes) to get a total familiarisation cost
of around £296,000, after the 25% optimism bias is applied. This is a direct cost to pension
schemes, as all schemes will need to immediately familiarise themselves with the policy
details to understand what actions are required to comply with the legislation.
In-house decumulation product development costs and partnering
57. All schemes under the proposal will either need to offer a decumulation solution in-house (including
buying-in solutions through a partnership arrangement) or organise an arrangement where they can
transfer their members to a scheme which provides an appropriate default solution(s). TPR analysis
from a selected 580 schemes shows around 160 single-employer trusts (30% of sample) currently
offer a decumulation service37
, while around 30 Master Trusts offer a decumulation service. This
leaves hundreds of schemes who would be required to develop a decumulation offer or develop an
arrangement with another scheme. Based on industry engagement, it is assumed:
▪ Only Master Trusts will develop an in-house decumulation product (where they are not
currently doing so)
▪ All single-employer trusts will look to establish an arrangement to transfer their
members to another scheme.
58. Discussions with industry highlighted the costs and risks of setting up an in-house service were likely
to be disproportionate for non-Master Trusts given their size and scope. The greater level of assets
Master Trusts hold offers economies of scale in producing in-house default solutions and greater
ability to spread risk and offer longevity pooling. Therefore, it is assumed these schemes will opt for
this route in order to capitalise on increased charges from their members who will enter drawdown.
59. For Master Trusts developing a decumulation offer, the Corporate Advisor Retirement Report and
desk research was used to estimate that 5 to 10 Master Trusts will need to develop a decumulation
product38
. Based on the various engagement with industry, it is estimated the up-front cost of
developing a drawdown solution to be £1m (the Corporate Advisor report highlights the majority of
products not offered among Master Trusts is drawdown). Since most schemes currently offer UFPLS
to their members, it is estimated the upfront cost per Master Trust will in fact be half this cost at
£500,000. This is because UPFLS is not too dissimilar a product from drawdown, and thus, schemes
will not have to engage in as much product development to now offer drawdown to their members as
opposed to developing the product from scratch. The total up-front costs of product development are
estimated to be £3.5m. This is a direct cost to pension schemes who currently do not offer
decumulation products and decide to develop an offering in-house, as this will be a necessary cost to
comply with the legislation.
60. For non-Master Trusts, it is assumed those not currently offering a decumulation product will partner
with another scheme. This is due to the large differential between the cost of developing an in-house
decumulation product versus partnering with a scheme offering decumulation products to transfer
members to access these products; single-employer trusts tend to be significantly smaller in size
than Master Trusts and thus would likely lack the economies of scale necessary to develop in-house
products profitably. Using TPR scheme returns and coverage of decumulation estimates, this puts
around 620 schemes in scope.
o 510 small schemes [12 to 999 members]
37
https://www.thepensionsregulator.gov.uk/en/document-library/research-and-analysis/use-of-decumulation-products-within-occupational-dc-
schemes
38
For the purposes of the analysis, a midpoint of 7 Master Trusts as a midpoint which also reflects the best available information whilst
recognising commercial sensitivity.](https://image.slidesharecdn.com/impactassessment1-250608191506-683de423/85/impact_assessment-1-DWP-document-300-pagespdf-228-320.jpg)
![229
o 80 medium schemes [1,000 to 4,999 members]
o 30 large schemes [5,000+ members]
61. Based on industry engagement, larger schemes will be able to conduct a wider and more complex
market search to find the most suitable partnerships and will be able to secure the services of
employer benefit consultants (EBCs) to support this. Whereas it may be expected for smaller
schemes to reach out to those with high brand recognition rather than conducting significant
searches. Partnership costs may comprise of the potential use of innovation firms, such as fin-techs,
to develop interfaces and solutions to share data across schemes, legal fees in producing
partnership contracts, and the use of EBCs to search the market. Industry engagement and
discussions estimated the cost of partnering for small schemes will be around £50,000, for medium
schemes £150,000, and £250,000 for large schemes. In total, the industry-wide up-front cost of
partnering is expected to be £45m. This is a direct cost to pension schemes who currently do not
offer decumulation products and decide to secure transfer arrangements for their members at
decumulation, as this will be a necessary cost to comply with the legislation.
Table 3: Estimated schemes in scope of partnering and costs to partner
Scheme Size Number of schemes to
partner
Cost per scheme to partner Total Costs
Small 510 £50,000 £25.6m
Medium 80 £150,000 £12.0m
Large 30 £250,000 £7.9m
Total 620 £45.5m
Source: DWP roundtables and one-to-one meetings with pension schemes. Schemes rounded to the
nearest 10
Training
62. Training costs are incurred as schemes will need to train their employees on the new legislation,
including its implications and the necessary adjustments required to take members through their
guided retirement journey. The estimated training cost is derived from assumptions gathered through
consultations with industry experts on their implementation plans and the FCA’s cost-benefit analysis
for Investment Pathways (which drew on survey responses from pension schemes). Key
assumptions include:
• Large schemes (including Master Trusts) will need to train 75 staff. This has been pro-rata
adjusted for medium schemes (17 staff) and small schemes (3 staff, where the number is
assumed to be the same as that of trustees).
• All large schemes (including Master Trusts) will train their staff internally, 50% of medium
schemes will provide internal training, while 25% of small schemes will do so.
• The cost of external training is assumed to be £910 per person39
, while for internal training,
the hourly wage for a trainer and trainee is assumed to be £27.42 and £21.81 respectively40
.
• Staff at Master Trusts will require bespoke training. This is estimated at around 6 hours of
classroom training and 40 hours preparation.
• All non-Master Trusts are expected to do basic training (as they are expected to partner with
a MT). This is estimated at around 6 hours of classroom training and 8 hours preparation.
63. Overall, total industry-wide training costs are estimated to be £7m. This is a direct, unavoidable cost
to pension schemes, as it will be necessary to ensure staff are aware of the legislation and what it
39
This is based on the FCA’s assumptions on the cost of external training in their cost-benefit analysis and uprated by CPI since their
publication. https://www.fca.org.uk/publication/consultation/cp19-05.pdf
40
Wage data is sourced by ONS Annual Survey of Hours and Earnings 2022 data
(https://www.ons.gov.uk/employmentandlabourmarket/peopleinwork/earningsandworkinghours/datasets/occupation2digitsocashetable2) and
uplifted by 27% as per the archived Green Book guidance.](https://image.slidesharecdn.com/impactassessment1-250608191506-683de423/85/impact_assessment-1-DWP-document-300-pagespdf-229-320.jpg)

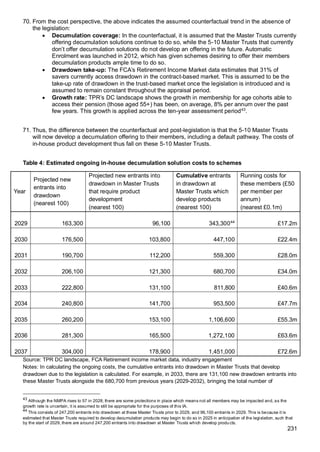
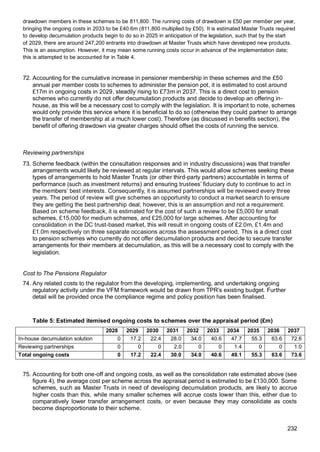
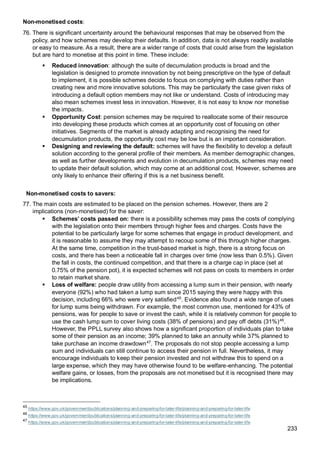
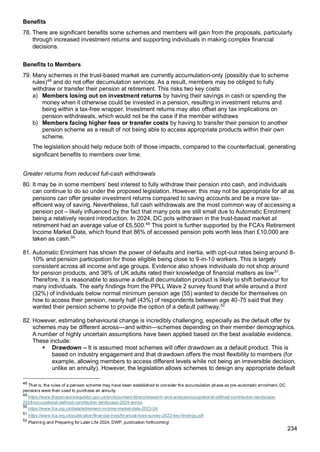

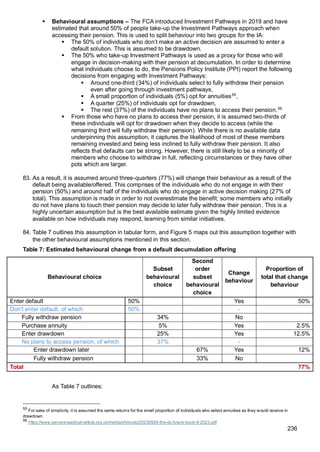
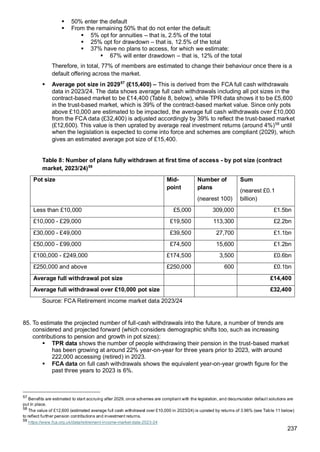

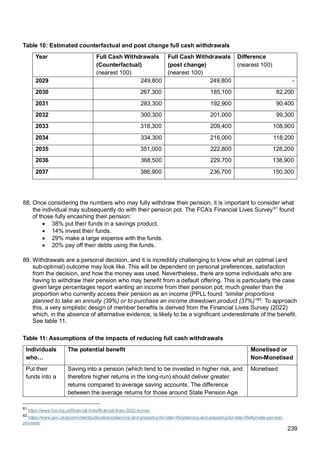
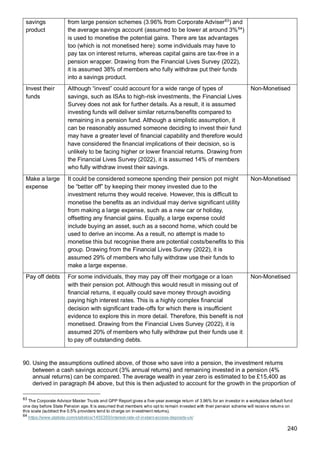
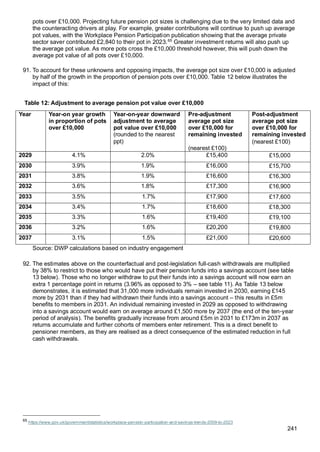
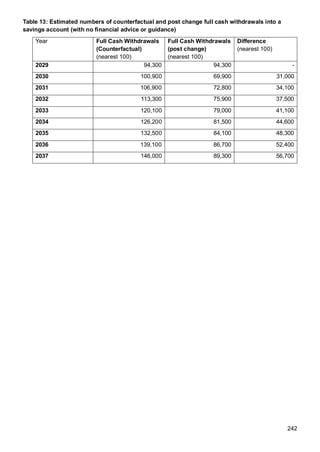

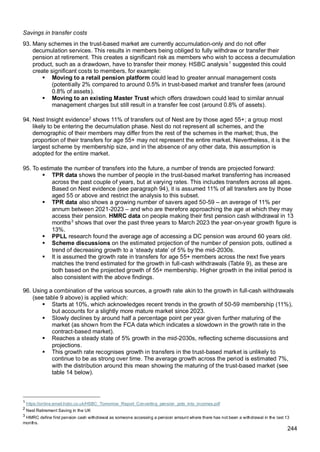
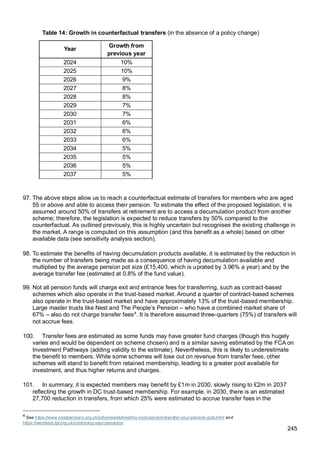
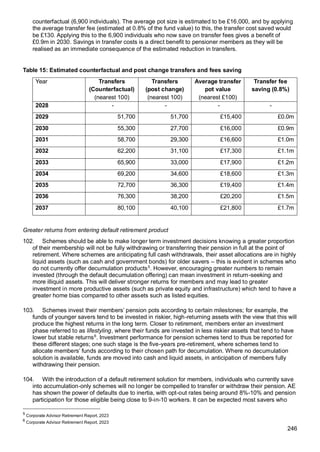
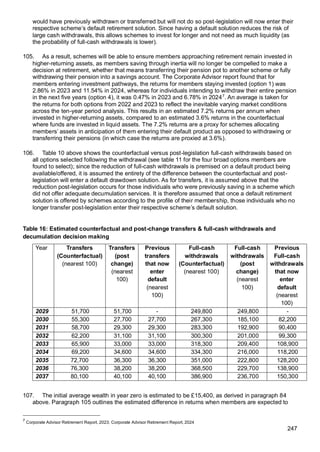
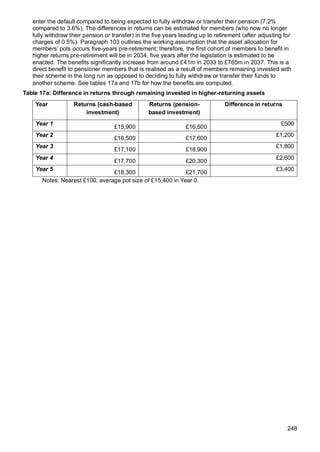

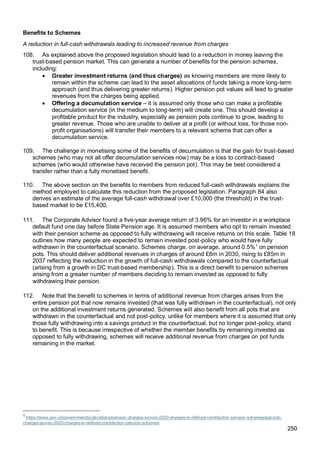
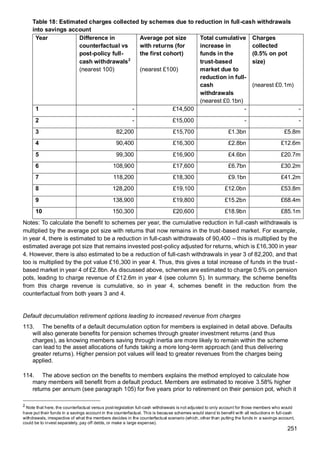
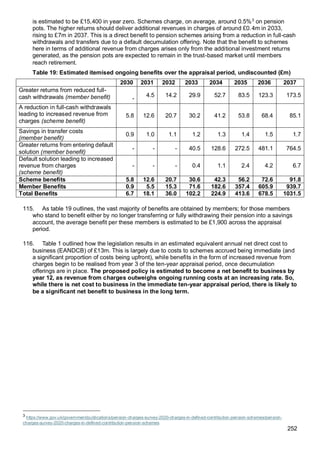
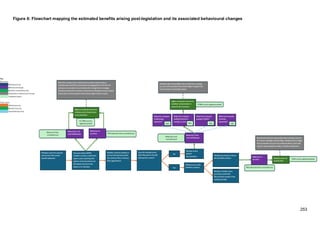


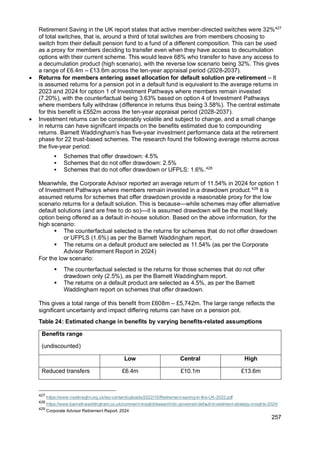
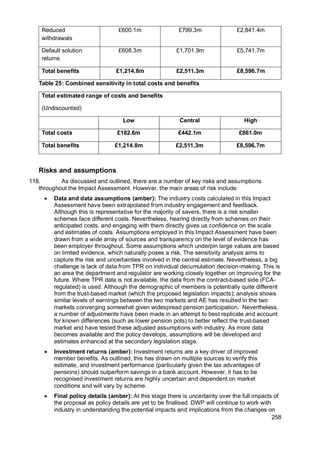

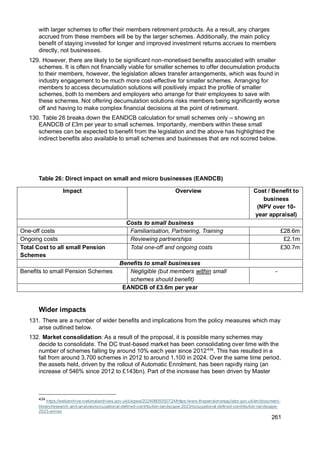


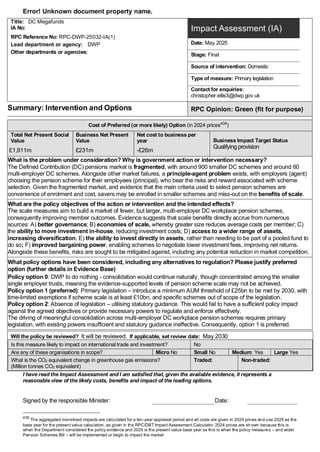
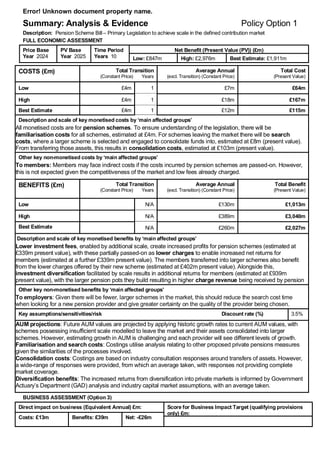
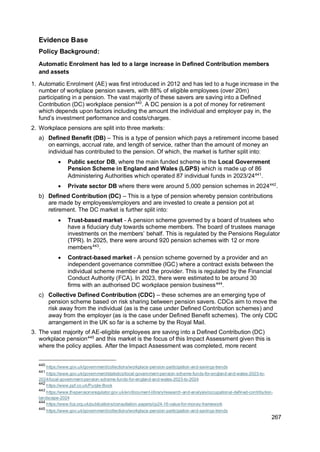
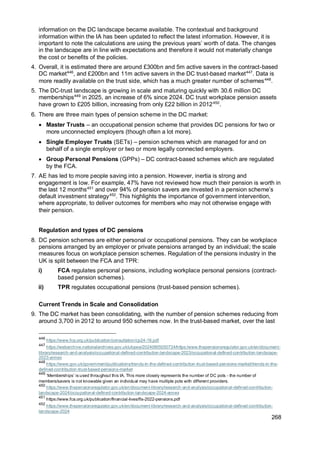
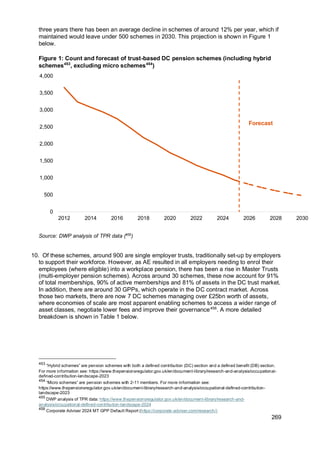
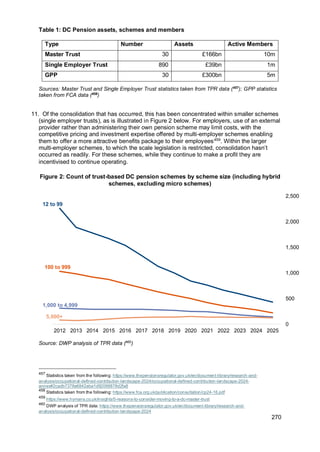
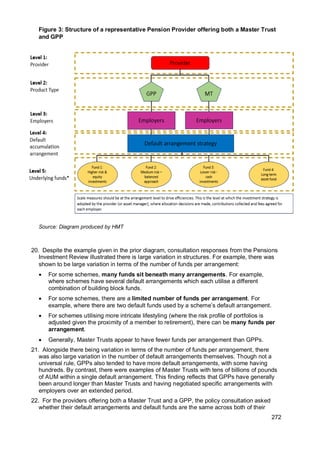


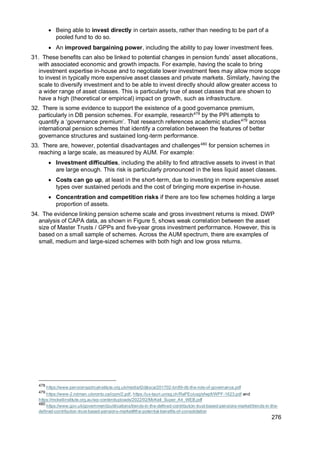
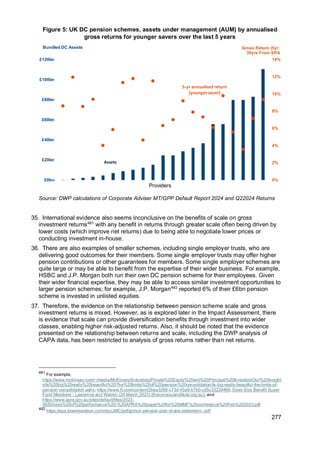


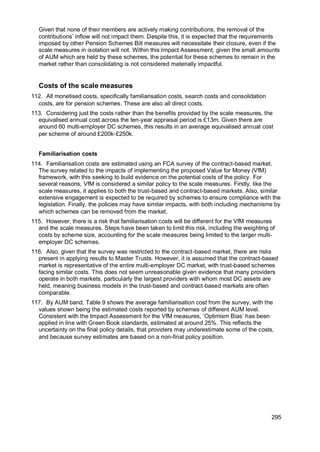
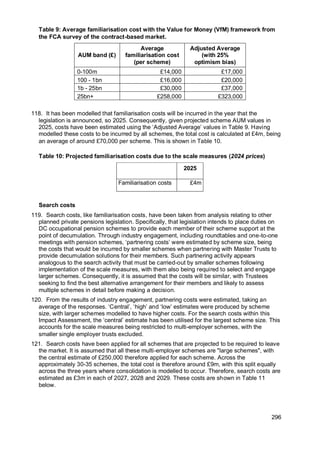
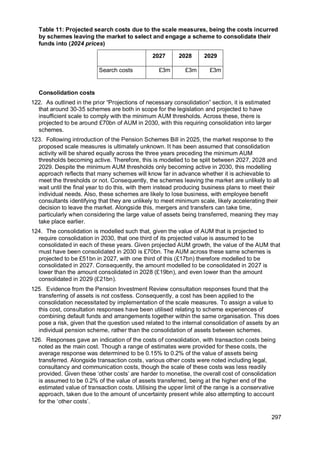

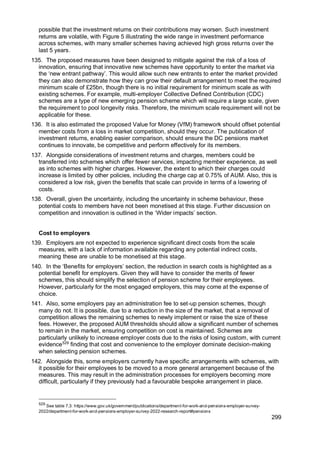
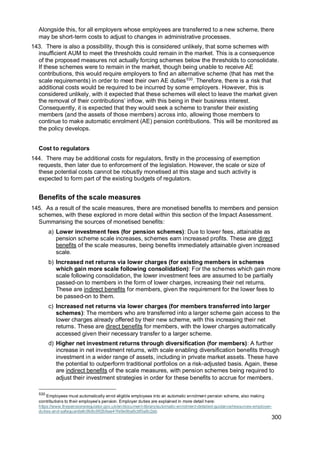

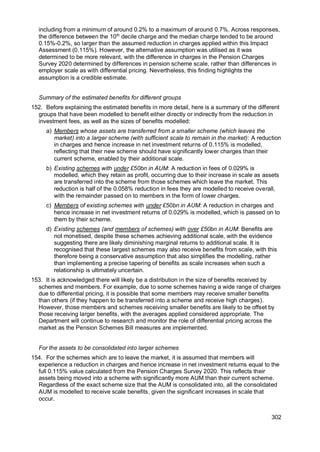
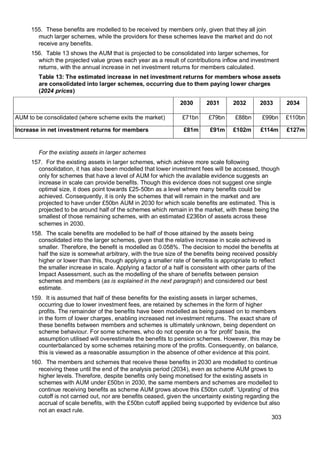
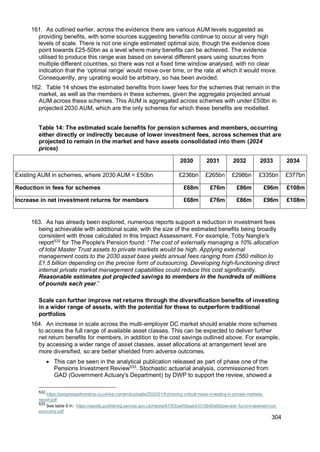

![306
Pension Scheme), “the relatively larger private markets allocation of the Canadian
funds versus the LGPS funds is likely a key contributor to the slightly lower
comparative returns [of LGPS funds]”537
. Australia and Canada have been pensions
markets that successive governments have closely followed to inform UK pensions
policy developments538
.
• Other institutional capital market assumptions assume a greater level of return
from private market assets that scale should allow access to. For example, each of JP
Morgan, Amundi and Blackrock project private markets (including private debt and
infrastructure) to outperform public markets in their publicly available assumptions539
.
This outperformance is often by a larger margin than the 0.07% established above
given that GAD use a different set of capital market assumptions (supplied by
Moody’s). Though any estimate in capital market assumptions are volatile and will be
dependent on fees.
168. Therefore, a range of estimates are available regarding the potential uplift that
diversification can provide. It is also important to recognise that future returns are uncertain,
dependent on scheme behaviour and evidence on private market outperformance can be
impacted by survivorship bias540
.
169. Given the available evidence, it is assumed that higher private market allocations
delivered through scale provide a 0.1% improvement to investment returns. This is
informed by the 0.07% result calculated from the GAD analysis, as well as other institutional
capital market assumptions which often suggest a larger outperformance by private markets.
This rate of return could conceivably improve further over time (i.e. beyond the end of the
appraisal period) as J-curves541
are managed and there is a greater supply of and demand
for domestic private market opportunities.
170. As with the benefits accruing directly or indirectly as a result of lower fees, the size of
benefits received through diversification has been modelled as being dependent on the
relative increase in scale achieved following consolidation activity. The methodology adopted
is also consistent, with this explained in the following sections.
For the assets to be consolidated into larger schemes
171. For the smallest schemes which are to leave the market, it is assumed that members will
experience increases in investment returns through diversification of the full 0.1%.
172. Table 15 shows the AUM that is projected to be consolidated into larger schemes, for
which the projected value grows each year as a result of contributions inflow and investment
returns, with the annual increase in net investment returns for members calculated.
Table 15: The estimated increase in net investment returns for members whose assets
are consolidated into larger schemes, occurring due to investment diversification as
pension scheme scale increases (2024 prices)
2030 2031 2032 2033 2034
AUM to be consolidated (where scheme exits the market) £71bn £79bn £88bn £99bn £110bn
537
https://www.hymans.co.uk/media/uploads/Policy_briefing_note_-_the_Canadian_model.pdf
538
For example, the Chancellor’s 2024 Mansion House speech “… sets out our plans to create Canadian and Australian style-
“megafunds” to power growth in our economy”
539
https://www.blackrock.com/institutions/en-us/insights/charts/capital-market-assumptions ;
https://am.jpmorgan.com/content/dam/jpm-am-aem/global/en/insights/portfolio-insights/ltcma/noindex/ltcma-full-report.pdf ;
https://research-center.amundi.com/article/capital-market-assumptions-2024
540
“Survivorship bias” is where the assessment of an asset is determined only by the performance of existing assets in the
market, discounting those that have previously left the market.
541
“J-curves” are the pattern that private investments often follow, whereby they initially experience lower returns before
outperforming in the long-run, thus a curve plotting their returns may appear similar to the letter “J”.](https://image.slidesharecdn.com/impactassessment1-250608191506-683de423/85/impact_assessment-1-DWP-document-300-pagespdf-306-320.jpg)