
![20 G. Katz and A.L. Snow
5. Collect each sample using constant time (20–30 s/sample)
(see Note 11).
6. For analysis, use FACS analysis software (e.g., FlowJo,
FACSDiva, or equivalent) to plot FSC versus FL2 for each
sample, gating on the viable cells (FSChi
/PI-
population, see
Fig. 2) to determine the number of viable cells collected.
7. Calculate the % cell loss for each dose of OKT3 as follows: %
cell loss=[1–(# of viable (PI-) restimulated cells/# of untreated
viable cells)]×100, see Note 12.
8. Plot % cell loss data on a dose–response curve (see Fig. 2 for
example).
1. For best PBMC viability, whole blood may be collected in
tubes with acid citrate dextrose (ACD) as an anticoagulant.
Alternatively, the enriched PBMC fraction obtained from a
whole unit blood donation after initial centrifugation
(a.k.a. the “buffy coat”) may be used to obtain large quan-
tities of PBMC.
2. For best results to layer Ficoll underneath blood/PBS mixture,
we recommend placing a sterile 5.75 in. glass Pasteur pipette
4. Notes
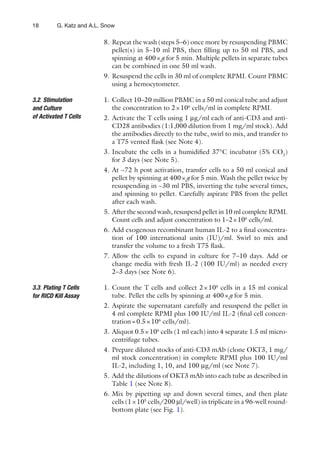
Fig. 2. Gating strategy for quantifying viable cells using PI exclusion. After restimulation (~24 h), PI-stained T cells are
collected on the flow cytometer for a constant time (20–30 s/sample). (a) For analysis, data is visualized in a 2-color dot
plot with forward scatter (FSC) on the x-axis and PI (FL2) on the y-axis. Viable cells (FSChi
, PI-) are gated as shown to
determine the number of viable cells collected per sample. Percent cell loss is then calculated as follows:
# of viable cells (20 sec collection): unstim (0 ng/ml) = 10813; + 100 ng/ml OKT3 = 4849; % cell loss = [1-(4849/10813)]
* 100 = 55.2%
(b) By repeating this calculation for triplicate values, a dose–response curve for mean RICD sensitivity (−/+ SD) can be
readily generated to compare different donors (Panel B).](https://image.slidesharecdn.com/immunehomeostasis-130518010048-phpapp01/85/Immune-homeostasis-6-320.jpg)


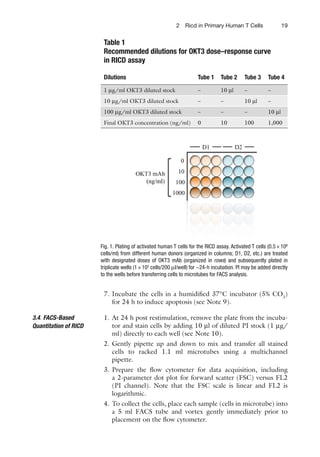
Activated human T cells can undergo programmed cell death called restimulation-induced cell death (RICD) when re-exposed to antigen. This document describes a method to measure RICD sensitivity in vitro using fluorescently labeled propidium iodide and flow cytometry. Primary human T cells are isolated from blood, activated with antibodies, and expanded with IL-2. Activated T cells are then restimulated with varying doses of anti-CD3 antibody for 24 hours before analyzing the percentage of dead cells by flow cytometry using propidium iodide staining. This assay provides a tool to study RICD and assess dysregulated T cell death in diseases.


