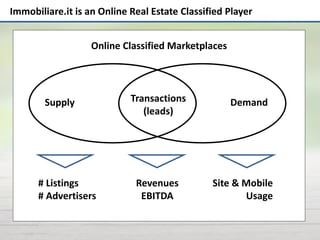
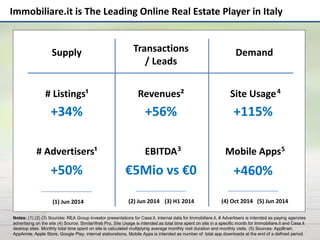
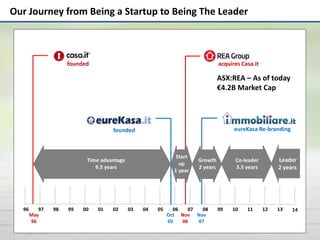
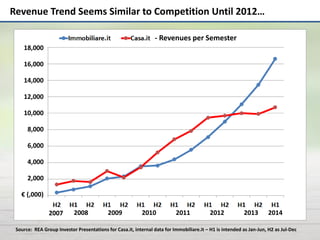
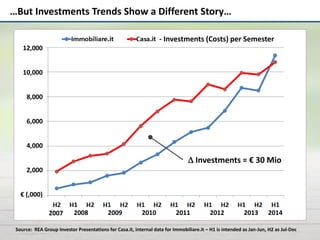
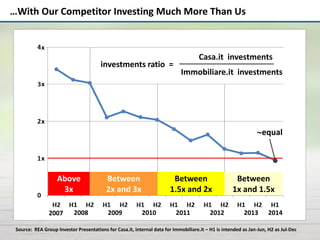
Make Your Money Count
13-14 November 2014
Silvio Pagliani – Immobiliare.it
Immobiliare.it is an Online Real Estate Classified Player
Supply DemandTransactions
(leads)
# Listings
# Advertisers
Revenues
EBITDA
Site & Mobile
Usage
Online Classified Marketplaces
Immobiliare.it is The Leading Online Real Estate Player in Italy
Supply DemandTransactions
/ Leads
# Listings¹
EBITDA
Site Usage
# Advertisers¹
Revenues²
Mobile Apps
+34%
+50%
+56%
€5Mio vs €0
Notes: (1) (2) (3) Sources: REA Group investor presentations for Casa.it, internal data for Immobiliare.it, # Advertisers is intended as paying agencies
advertising on the site (4) Source: SimilarWeb Pro, Site Usage is intended as total time spent on site in a specific month for Immobiliare.it and Casa.it
desktop sites. Monthly total time spent on site is calculated multiplying average monthly visit duration and monthly visits. (5) Sources: AppBrain,
AppAnnie, Apple Store, Google Play, internal elaborations, Mobile Apps is intended as number of total app downloads at the end of a defined period.
+115%
+460%
(1) Jun 2014 (2) Jun 2014 (3) H1 2014 (4) Oct 2014 (5) Jun 2014
3
4
5
Our Journey from Being a Startup to Being The Leader
96 97 98 99 00 01 02 03 04 05 06 07 08 09 10 11 12 13 14
Time advantage
9.5 years
Growth
2 years
Leader
2 years
Co-leader
3.5 years
founded
Oct
05
Nov
07
eureKasa Re-branding
May
96
Nov
06
acquires Casa.itfounded
ASX:REA – As of today
€4.2B Market Cap
Start
up
1 year
Revenue Trend Seems Similar to Competition Until 2012…
Source: REA Group Investor Presentations for Casa.it, internal data for Immobiliare.it – H1 is intended as Jan-Jun, H2 as Jul-Dec
- Revenues per Semester
2007 2008 2009 2010 2011 2012 2013 2014
€ (,000)
12,000
10,000
8,000
6,000
4,000
2,000
14,000
16,000
18,000
…But Investments Trends Show a Different Story…
Source: REA Group Investor Presentations for Casa.it, internal data for Immobiliare.it – H1 is intended as Jan-Jun, H2 as Jul-Dec
 Investments = € 30 Mio
- Investments (Costs) per Semester
2007 2008 2009 2010 2011 2012 2013 2014
€ (,000)
12,000
10,000
8,000
6,000
4,000
2,000
…With Our Competitor Investing Much More Than Us
Source: REA Group Investor Presentations for Casa.it, internal data for Immobiliare.it – H1 is intended as Jan-Jun, H2 as Jul-Dec
Casa.it investments
Immobiliare.it investments
investments ratio =
equal
Above
3x
Between
2x and 3x
Between
1.5x and 2x
Between
1x and 1.5x
2007 2008 2009 2010 2011 2012 2013 2014
x
x
x
x
Main Cost Drivers For Real Estate Online Classified Players
Marketing
50%
Product &
Technology
10%
People
35%
Cost-Effective Marketing Investments
Cost-Effective Not Cost-Effective
• Budget managed by
internal department
• Investments linked to
ROI and well defined
KPIs
• Balance performance
deals and brand deals
• Budget managed by
external agency
• No focus on ROI and
KPI (or wrong KPIs)
• Overspending in
performance or brand
deals
Marketing
Example: TV Advertising
Started TV advertising when it was no longer effective to
increase the online budget
Cost-Effective Not Cost-Effective
• Grant stock options (to
key people only)
• Build quality work
environment (people are
motivated for more than
financial reasons)
• Reward people on short-
term and long-term vision
People
• Grant high salaries &
benefits not linked to
performances
• Bonus based on wrong
defined KPIs
• «Buy» people, accepting
mainly for financial
reasons
Cost-Effective People Investments
Cost-Effective Technology Investments
Cost-Effective Not Cost-Effective
• Make / Insource
-> develop know-how
• Open source / Free
Software approach
• Continuous optimization
Technology / Product
• Buy / Outsource
-> limited know-how
• Closed source /
Proprietary software
(licences) approach
• Add more hardware
Example: Mobile Apps
First iOS app, developed internally, launched in November
2009. Built dedicated internal team for iOS and Android
Example: System Integration
Internally developed server and storage clusters, allowing
us to scale up from few to 150+ servers infrastructure with
virtually no changes since 2007
Make Your Money Count
Good Use
• Outbid competitors
• Poor after-investment
evaluation
• «Buy» people
• Buy technology
solutions without fine
tuning
Bad Use
• Invest & evaluate
• Adapt to internet
evolution
• Hire and grow
talents
• Develop cutting
edge features
• Invest for the
future
Marketing
People
Technology
Thank you
Contacts
Silvio Pagliani
silvio@immobiliare.it

Immobiliare.it - NOAH14 London

  • 1.
    Make Your MoneyCount 13-14 November 2014 Silvio Pagliani – Immobiliare.it
  • 3.
    Immobiliare.it is anOnline Real Estate Classified Player Supply DemandTransactions (leads) # Listings # Advertisers Revenues EBITDA Site & Mobile Usage Online Classified Marketplaces
  • 4.
    Immobiliare.it is TheLeading Online Real Estate Player in Italy Supply DemandTransactions / Leads # Listings¹ EBITDA Site Usage # Advertisers¹ Revenues² Mobile Apps +34% +50% +56% €5Mio vs €0 Notes: (1) (2) (3) Sources: REA Group investor presentations for Casa.it, internal data for Immobiliare.it, # Advertisers is intended as paying agencies advertising on the site (4) Source: SimilarWeb Pro, Site Usage is intended as total time spent on site in a specific month for Immobiliare.it and Casa.it desktop sites. Monthly total time spent on site is calculated multiplying average monthly visit duration and monthly visits. (5) Sources: AppBrain, AppAnnie, Apple Store, Google Play, internal elaborations, Mobile Apps is intended as number of total app downloads at the end of a defined period. +115% +460% (1) Jun 2014 (2) Jun 2014 (3) H1 2014 (4) Oct 2014 (5) Jun 2014 3 4 5
  • 5.
    Our Journey fromBeing a Startup to Being The Leader 96 97 98 99 00 01 02 03 04 05 06 07 08 09 10 11 12 13 14 Time advantage 9.5 years Growth 2 years Leader 2 years Co-leader 3.5 years founded Oct 05 Nov 07 eureKasa Re-branding May 96 Nov 06 acquires Casa.itfounded ASX:REA – As of today €4.2B Market Cap Start up 1 year
  • 6.
    Revenue Trend SeemsSimilar to Competition Until 2012… Source: REA Group Investor Presentations for Casa.it, internal data for Immobiliare.it – H1 is intended as Jan-Jun, H2 as Jul-Dec - Revenues per Semester 2007 2008 2009 2010 2011 2012 2013 2014 € (,000) 12,000 10,000 8,000 6,000 4,000 2,000 14,000 16,000 18,000
  • 7.
    …But Investments TrendsShow a Different Story… Source: REA Group Investor Presentations for Casa.it, internal data for Immobiliare.it – H1 is intended as Jan-Jun, H2 as Jul-Dec  Investments = € 30 Mio - Investments (Costs) per Semester 2007 2008 2009 2010 2011 2012 2013 2014 € (,000) 12,000 10,000 8,000 6,000 4,000 2,000
  • 8.
    …With Our CompetitorInvesting Much More Than Us Source: REA Group Investor Presentations for Casa.it, internal data for Immobiliare.it – H1 is intended as Jan-Jun, H2 as Jul-Dec Casa.it investments Immobiliare.it investments investments ratio = equal Above 3x Between 2x and 3x Between 1.5x and 2x Between 1x and 1.5x 2007 2008 2009 2010 2011 2012 2013 2014 x x x x
  • 9.
    Main Cost DriversFor Real Estate Online Classified Players Marketing 50% Product & Technology 10% People 35%
  • 10.
    Cost-Effective Marketing Investments Cost-EffectiveNot Cost-Effective • Budget managed by internal department • Investments linked to ROI and well defined KPIs • Balance performance deals and brand deals • Budget managed by external agency • No focus on ROI and KPI (or wrong KPIs) • Overspending in performance or brand deals Marketing
  • 11.
    Example: TV Advertising StartedTV advertising when it was no longer effective to increase the online budget
  • 12.
    Cost-Effective Not Cost-Effective •Grant stock options (to key people only) • Build quality work environment (people are motivated for more than financial reasons) • Reward people on short- term and long-term vision People • Grant high salaries & benefits not linked to performances • Bonus based on wrong defined KPIs • «Buy» people, accepting mainly for financial reasons Cost-Effective People Investments
  • 13.
    Cost-Effective Technology Investments Cost-EffectiveNot Cost-Effective • Make / Insource -> develop know-how • Open source / Free Software approach • Continuous optimization Technology / Product • Buy / Outsource -> limited know-how • Closed source / Proprietary software (licences) approach • Add more hardware
  • 14.
    Example: Mobile Apps FirstiOS app, developed internally, launched in November 2009. Built dedicated internal team for iOS and Android
  • 15.
    Example: System Integration Internallydeveloped server and storage clusters, allowing us to scale up from few to 150+ servers infrastructure with virtually no changes since 2007
  • 16.
    Make Your MoneyCount Good Use • Outbid competitors • Poor after-investment evaluation • «Buy» people • Buy technology solutions without fine tuning Bad Use • Invest & evaluate • Adapt to internet evolution • Hire and grow talents • Develop cutting edge features • Invest for the future Marketing People Technology
  • 17.