Downloaded 51 times

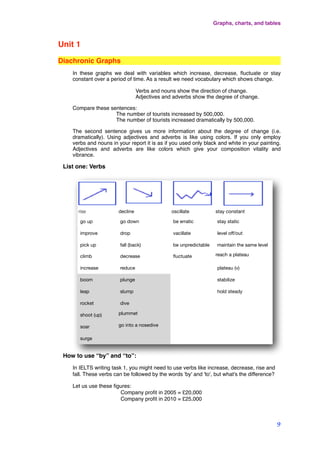
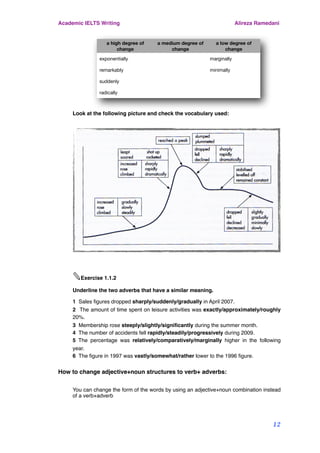
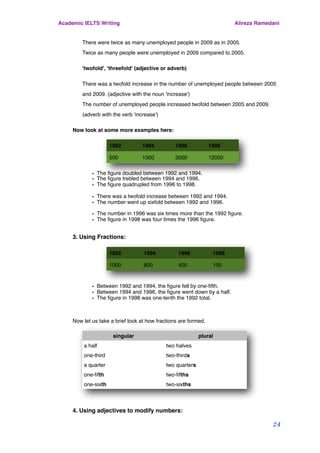


This document provides guidance on vocabulary for describing graphs, charts and tables in IELTS writing task 1. It includes lists of verbs, nouns, adjectives and adverbs to describe changes over time in diachronic graphs. Examples are given of how to use these words to discuss increasing, decreasing or fluctuating trends. Advice is given to use adjectives and adverbs to provide more vivid descriptions beyond just verbs and nouns.


![Grammar practice for elementary students [walker,elsworth] longman](https://cdn.slidesharecdn.com/ss_thumbnails/grammarpracticeforelementarystudentswalkerelsworth-longman-181004165820-thumbnail.jpg?width=640&height=640&fit=bounds)


