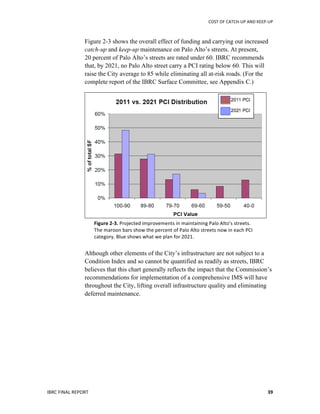
The Infrastructure Blue Ribbon Commission was appointed by the Palo Alto City Council to assess the state of the city's infrastructure and make recommendations. The Commission found that Palo Alto has underfunded infrastructure maintenance by over $2 million per year, resulting in over $40 million in backlogged needs. It recommends increasing annual infrastructure spending by $6 million and replacing five major facilities including the police headquarters and two fire stations for $79 million. It also recommends funding a $100 million study and redevelopment of the Municipal Services Center area. To prevent future issues, the Commission recommends creating an infrastructure management system and single point of responsibility. It presents four alternatives to fund the recommendations that include tax increases or utilizing potential savings from ending contracts with the


![PUBLIC
SAFETY
FACILITIES
IBRC
FINAL
REPORT
45
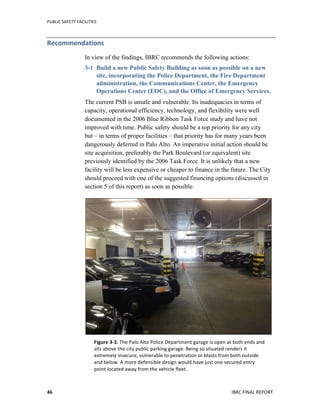
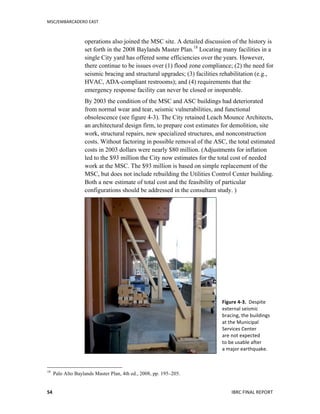
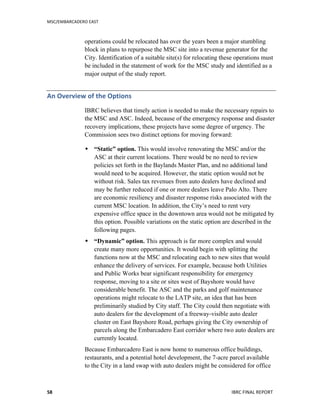
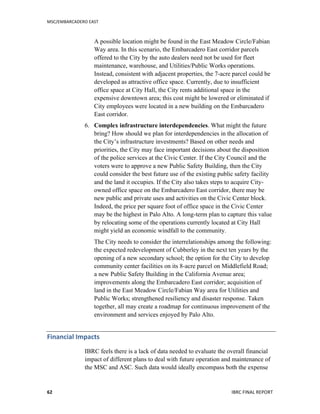
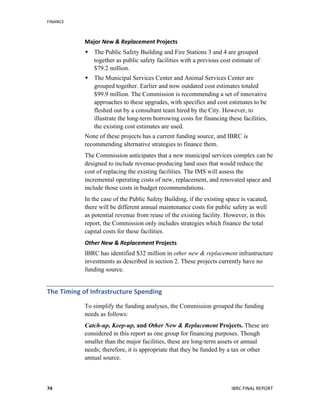
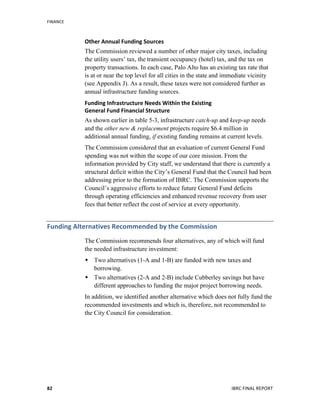
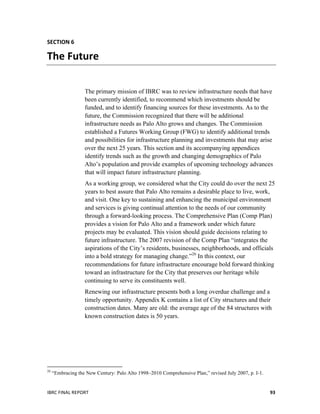
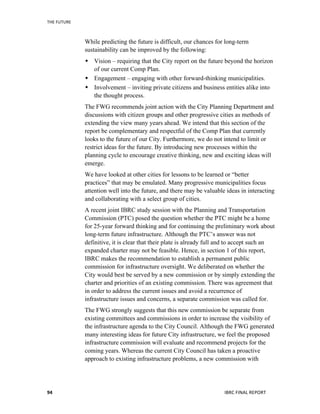
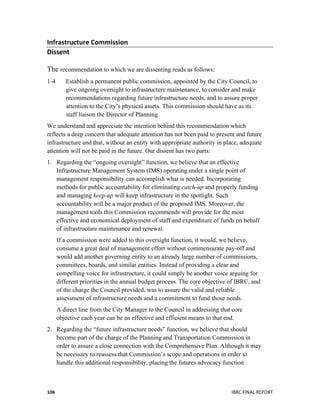
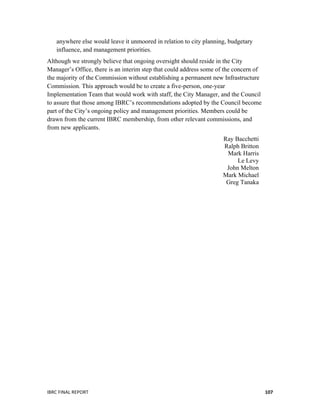
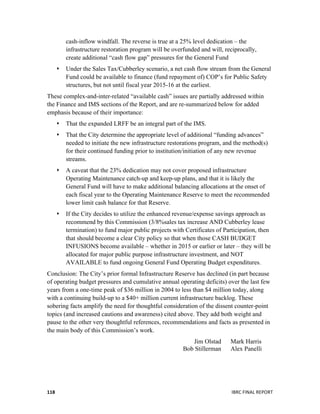
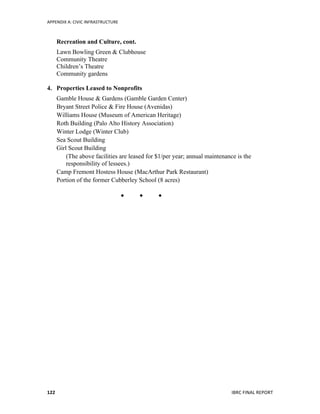
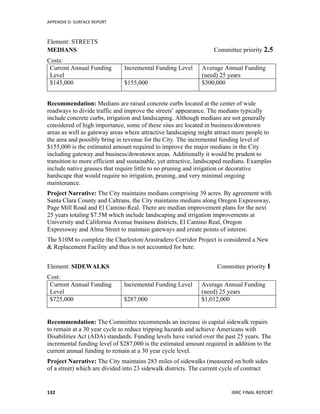
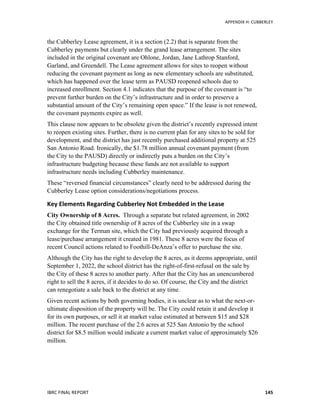
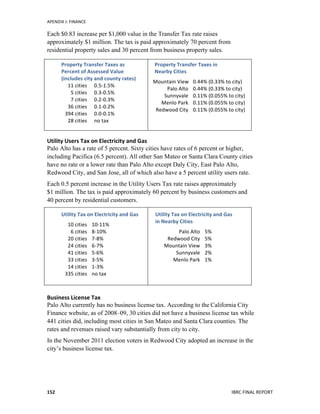
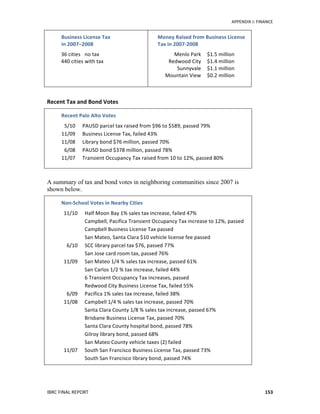
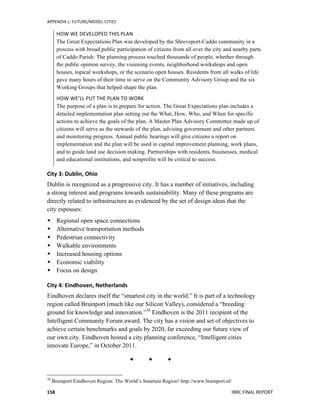
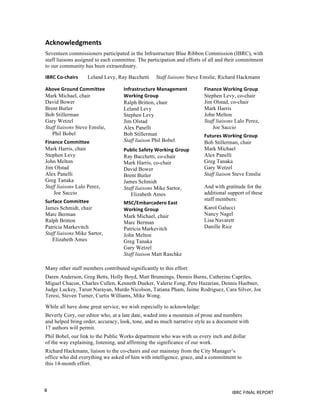
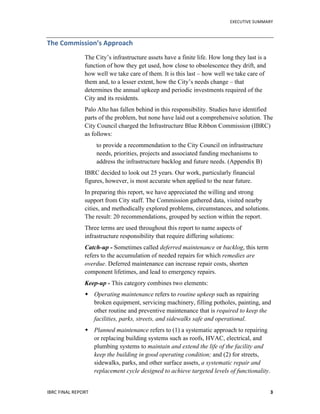
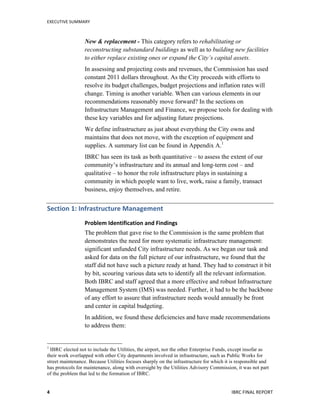
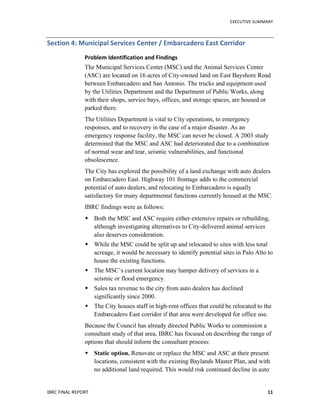
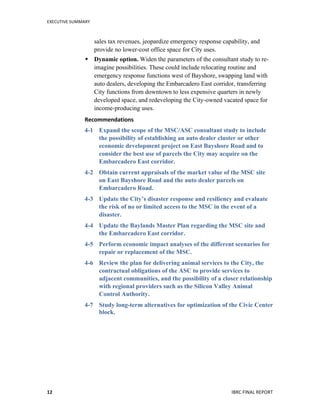
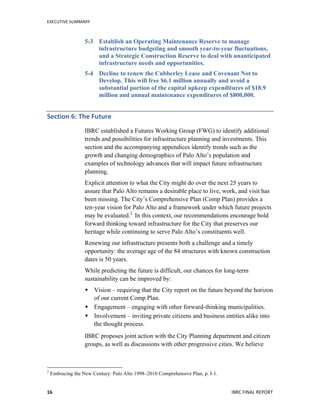
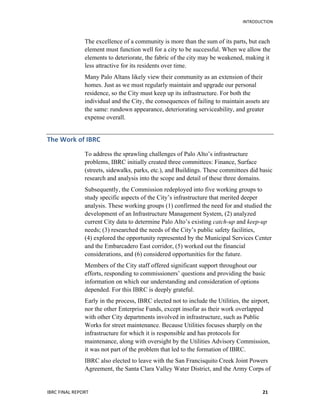
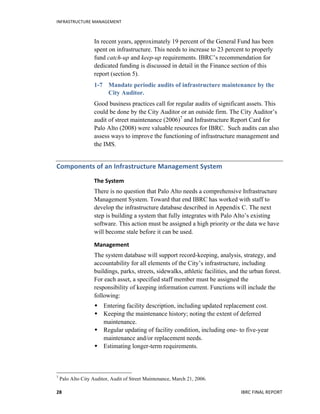
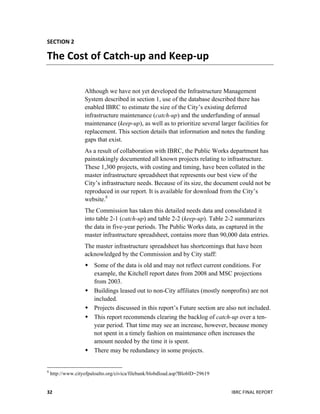
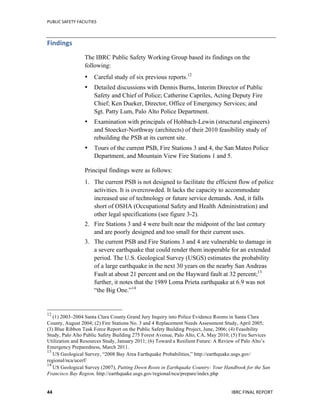
Figure
3-‐2.
Evidence
storage
for
the
Palo
Alto
Police
Department
(left)
is
well
below
current
law
enforcement
standards
and
is
cramped
for
space.
Current
standards
call
for
updating
Palo
Alto
to
a
system
like
the
evidence
storage
lockers
used
by
San
Mateo
(right).
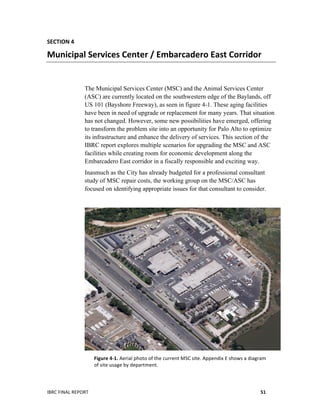
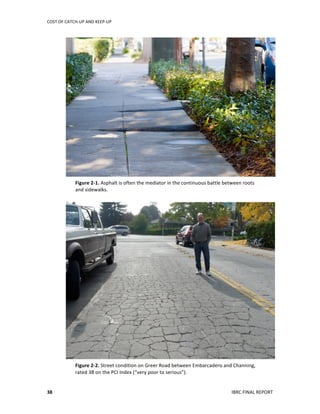
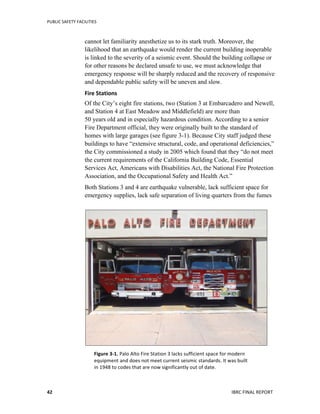
4. The current PSB lacks blast protection from outside and below (see
figure 3-3). The PSB and fire stations were built for the last century’s
public safety and community service needs, not for current and
projected emergency response services.
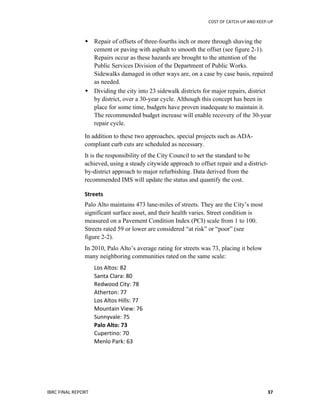
5. Estimated replacement costs are Public Safety Building – $65 million;
Fire Station 3 – $6.7 million; Fire Station 4 – $7.5 million. [Note:
These estimates are several years old and would need to be redone with
specific designs in mind. In the case of the contemplated Public Safety
Building, its contents would include elements not included in the
previously estimated structure, namely, an Office of Emergency
Services and the administrative component of the Fire Department.
These are together estimated to add another 7,500 square feet plus
allowances for circulation and shared spaces, additions which have
been included in the $65 million estimate. In the case of Fire Station 4,
the 2005 cost estimate includes a meeting room no longer needed since
the construction of the Mitchell Park Community Center; this removes
approximately 1,000 square feet from the conceptual design.]](https://image.slidesharecdn.com/dc00a1f9-2b14-443b-9811-d4b7c2ff2c65-150804215126-lva1-app6891/85/IBRC-Final-Report_12-22-2011-51-320.jpg)