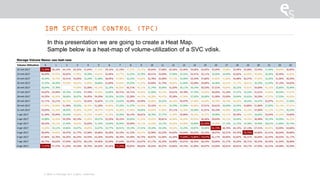
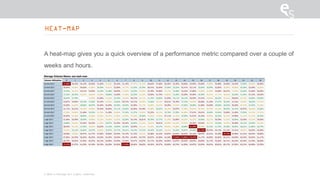
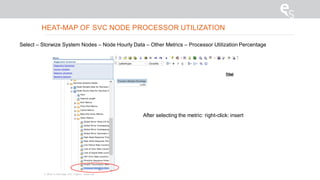
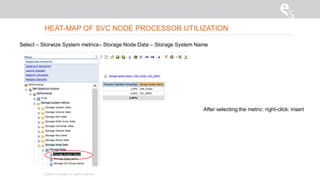
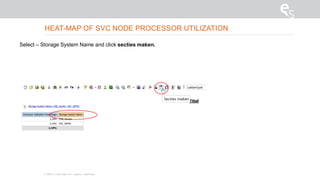
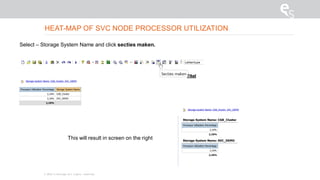
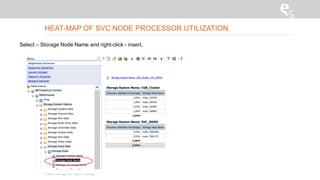
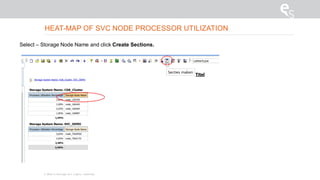
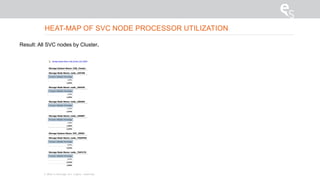
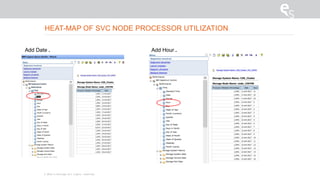
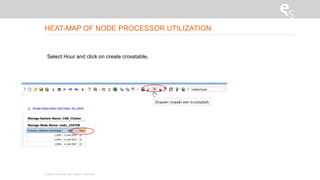
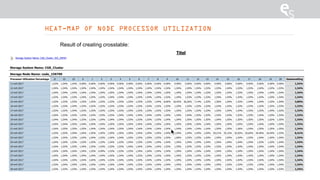
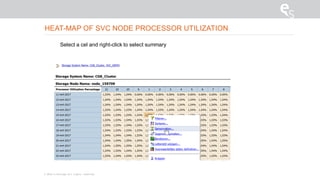
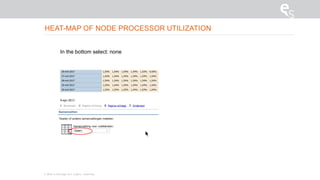
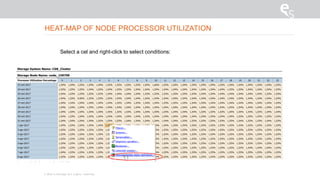
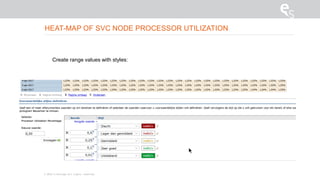
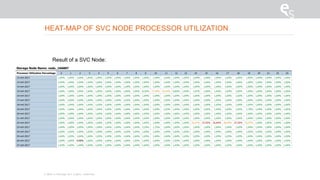
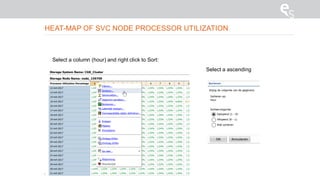
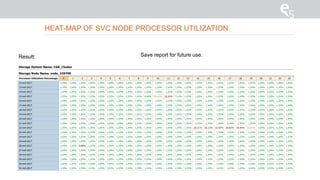
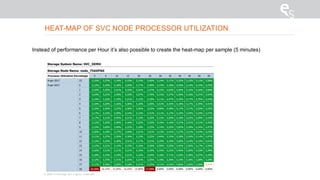
The document provides steps to create a heat map showing processor utilization for nodes in an SVC storage system over time. It explains how to generate the heat map report within the IBM Spectrum Control (TPC) Cognos tool by selecting the appropriate metrics, creating sections by storage system and node, and then configuring cell colors based on utilization ranges. The final heat map report gives a visual overview of processor usage across nodes and clusters in the SVC.


![Getting Started with Apache Spark: Big Data Made Simple [Free Meetup]](https://cdn.slidesharecdn.com/ss_thumbnails/apachesparkgettingstarted-260203175547-8361bcc3-thumbnail.jpg?width=640&height=640&fit=bounds)


