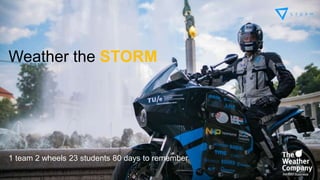
10. Teaming Up
With
Storm-
Eindhoven
140 airlines served
Globally, more than
750+ TV stations globally
5,000+ businesses
180 million consumers
200 million mobile app downloads
200,000+ personal weather stations
To Examine The
Impact Of Weather
On Battery
Performance
14. The Data Story
is Also About
Precision
Currents on Demand for
2.2 Billion Points On Earth
Netherlands Has The Most
Private Weather Stations Per
Capita Of Any Country In The
World
15. And Accuracy
A Single Forecast Model Doesn’t
Produce The Best Results; A
Combination of 162 Models Does
17. Probability Forecasts
Decisions made without probability-based analytics will always result insuboptimal economic outcomes
0
2
4
6
8
10
12
14
16
0 1 2 3 4 5 6 7 8 9 10 11 12 13 14 15 16 17 18 19 20
Percent
86.4% probability of snowfall
0 inches – 1st most probable outcome
Snowfall (inches)
10 inches – 2nd most probable outcome
4.8 in.– least error forecast (FOD today)
4.5 in.– 50% probability forecast
31.1% probability of 10 inches or more
18. The SUN Platform
24+
compressed
ingested per day
in production
100s
in data lakes
analyzed and
stored
15 Billion
API requests
handled per day
data types
supported today>100
Terabyte
Petabytes
• A cloud-based data platform that
ingests large volumes & types of data
• Delivers insights from precise weather
data combined with location and other
data sets
• Enables companies to embed
weather insights into decision support
platforms to take take action
19. Hyper-Local
Weather
Data
IoT / Data
• Smart
phones
• Homes
• Planes
• Sensors
• Cars
SUN PLATFORM
Businesses
can offer savings,
engage
customers, intro
new features
Consumers
receive alerts
on mobile
devices
Analytics
alert
Applying Analytics to Weather
20. Using Analytics to Engage Customers
Hyper-Local
Weather
Data
Home IoT
Sensors
• H20
meter
• A/C
• Electrical
panel
• Sewer
System
SUN PLATFORM
Insurance
Provider
can offer savings,
alerts, new
features
Motor
Driver
alerted on
mobile device
Analytics
• 40,000 smart home
sensors
• 10,000 home owners
with mobile or website
warnings
• 300 Insurance workers
who want to study their
clients water usage &
warnings
alert
21. Hyperlocal
Forecast
PWS Data Will Feed
Into Weather
Underground's
Forecast Model To
Generate Hyperlocal
Forecasts For The
Students Along
Their Tour
Title Slide
Objective: Introduce yourself; set the stage for the video
23 Dutch students traveling around the world in 80 days on a revolutionary electric motorcycle. to show the true potential of sustainable electric transport. #STORM80Days
Objective: Communicate ubiquity of weather and The Weather Company
Notes:
Weather is a daily habit. 90% of all US adults consume weather information on a weekly basis. Weather touches every life, every day.
The Weather Company, an IBM Business, is the world's largest private weather enterprise, helping consumers make informed decisions – and take action – in the face of weather. We offer the most precise, personalized and actionable weather data and insights to the millions of consumers who rely on us every single day.
Our portfolio includes the fourth most downloaded app, the world largest network of personal weather stations, the seventh most data-rich website, one of the world’s largest IoT data platforms and a host of industry solutions.
In addition to our own properties, but we also power the weather for Apple, FB, Google, Microsoft, Twitter, Yahoo and more.
.
Weather impacts every sector of the economy. I would argue that there isn’t a business on the planet that isn’t impacted by weather. It is the largest external swing factor in business performance responsible for nearly half a trillion dollars in economic impact in the US alone each year.
So let’s talk about what that means…
70% of all flight delays are attributed to weather.
Light rail systems have to slow down when the weather warms too much because the rails are too hot.
Retailers need to understand how weather will impact store traffic so they can make smarter staffing decisions.
Hail causes about $1B in damages to crops and property each year.
Upstream, Oil companies need to optimize their rigs for storm readiness, particularly during massive storms and to anticipate and avoid costly equipment failures. Downstream: they need to use weather data and analytics to support supply chain, distribution and franchise management support.
Utility companies that need to understand how much power will be consumed on any given day.
Farmer has to decide whether to plant.... if there is a 24% probability in the forecast that it's 32 degrees on day 6 they may hold off
Objective: Communicate the value of our assets and our client portfolio
The Weather Company offers data-driven products and services to more than 5,000 clients in a number of industry sectors around the globe as is considered one of the largest providers globally of atmospheric and weather data
We run one of the world’s most used cloud data platforms, with thousands of partners requesting weather data through hundreds of billions of daily transactions.
We update our forecasts every 15 minutes for up to 2.2 billion locations around the world, generating approx. 20 billion forecasts per day on average
Our personal weather station network has grown to more than 200,000 reporting stations globally
We gather weather data from more than 150 different sources – data like pollen, turbulence, radar, satellite imagery, traffic, personal weather stations, smartphone pressure sensors and more.
We have more than 140 meteorologists at The Weather Company in a variety of roles. Many are dedicated to analyzing and forecasting the weather; some use that expertise in other roles, such as software engineering or sales.
But what makes us truly unique is that we are a company that serves both consumers and businesses, which allows us to leverage our presence in both markets to create the richest, most precise data sets; translate that data into valuable insights; and deliver decision platforms and services that prompt action.
What makes our weather story so good is the value of the data. When we talk about it, we focus on SCALE, PRECISION and ACCURACY
Objective of slides 7-10: Tell the story of SCALE
I’m sure this comes as no surprise to any of you, but these devices we all have, changed our lives and that’s not hyperbole.. It caused us here at The Weather Company to rethink how we handled observations. Because we want the forecast for exactly where you are, not the nearest airport. Mobile drove forecast reinvention. We recognized very quickly that we had to focus laser-like on mobile because there is this problem of scale – lots of data and the need to serve millions of people on the planet. As example, we have to serve every native IOS user around the globe for their location. Every Yahoo consumer. Every AOL consumer. Every customer coming from a Google search. The hundreds of millions coming to the Weather company proprietary platform. This is a scale problem and a global one at that.
So now, we’re pulling in data from planes, smart phones and other IoT devices. In fact, we receive:
Over 530M Personal Weather Station reports each day
Over 9M webcam uploads each day
Over 2M Crowd Reports each month
Over 50M IoT Barometric Pressure Reports each day
So, we’re talking about millions of physical devices that are collecting data about weather.
Our personal weather station network is the backbone of our IoT strategy. With more than 200,000 Personal Weather Stations across 195 Countries, this network enables The Weather Company to provide hyper local forecasts to millions around the world with unprecedented accuracy. . You can see here the red dots indicate government reporting stations while the blue dots represent personal weather stations. We deliver 100x more coverage than publically available sources anywhere on the globe.
Each station is equipped with multiple sensors for detecting barometric pressure, humidity, temperature, wind speed and direction, and other factors. Greater personal weather station data leads to more precise and enhanced forecasts, which can help businesses, governments and communities better anticipate and act on weather conditions.
We’re currently collecting data from more than 50k commercial flights per day. And thanks to a partnership with Gogo, we’ll now leverage their expanded fleet of aircraft to both gather and transmit data, like turbulence reports.
As a result of the data, technology and human expertise, we’ve able to map the atmosphere. And that’s enabled us to develop one of the richest location data sets in the world. More than 80% of our users opt-in to share their location with us. And, if you consider the fact that we have 20 million daily users who check in 2-5 times per day…we are mapping 1 billion location pings per week. This means we possesses one of the world’s largest continuous sets of first-party location data. There are very few companies with location data as accurate and as precise as ours.
Objective: Tell the story of PRECISION
Because weather is hyper-local and can differ on a neighborhood by neighborhood basis. Here you can see the temperature differential within just a few kilometers. If you live within 2km of a weather reporting station, your forecast is 15% more accurate.
Objective of slides 12-14: Tell the story of ACCURACY
The best forecast model in the world doesn’t produce the best forecast. A combination of 162 models does.
For our Forecasts on Demand solution, we bring in 162 different sources and models –Japanese, Canadians, brits, US, EURO, our own models. All of these different inputs. Now, there are times when a single model will produce a better forecast. But our approach ON AVERAGE produces a better forecast day 1, day 5, day 10 - Tokyo, Bangkok, Rio, Austin. And, we intelligently weight every forecast input to come ups with a better forecast. And we are really smart about the weighting. Which will differ by location, type of weather, time of year. So many different variables.
And you don’t have to believe me. It’s been verified by an independent third-party research firm. The dark blue line indicates the forecast accuracy percentage for The Weather Company and the lighter shades represent competitors. Again, one day 1, day 3 or day 5 we deliver a more accurate forecast anywhere on the globe.
Objective: Tell the story of Probabilistic Forecasting and why it’s the future.
We’re showing you a probabilistic forecast for a storm earlier this year. On the day of the storm on the consumer app, the forecast for this particular location was for 4.8 inches of snow. When give a single answer, we’re providing the one that minimizes error of forecast. Our goal is to be as close to right as possible.
But there is a LOT of data in this forecast that is not captured by 4.8 inches. For example, in this particular case, the most probable outcome - from 0-16 inches - is 0 inches while the second most probable outcome is 10 inches. And the least error forecast is 5. All three of those numbers are reasonable to focus on. But when you understand the probability or likelihood of 10+ inches, which in this case is greater than 30%, you will make different decisions that you would if the probability were only 5%.
So, a probabilistic forecast system that provides a broad view of probabilities will lead to better, more informed decisions that result in better outcomes.
$1M a mile to evacuate people. You want to know the probability.
Objective: Underscore value of weather data in decision making; highlight that probabilistic will be available next year.
And probabilistic forecast data will be available in key weather data packages from The Weather Company early next year. At present, we offer a number of options – historical, current and forecast data that can be used to analyze, predict and make decisions.
Site Based Weather Observations
Weather observations from stations and crowd-sourced sensors including temperature, wind, humidity, pressure, dew point, visibility, and UV Index
Severe Weather Reports
Hail (US only), tornado, wind, hurricane, snow, rain, ice, and lightning reports in real-time and historical observations
Weather Imagery
Radar, doppler, and satellite imagery updated 5-60 minutes.
Road Conditions
Accumulations and intensity of rain, snow, and ice
Weather Alerts
Severe weather, wildfire, and earthquake alerts in real-time
Tropical Storms
Probabilistic hurricane forecasts up to 15 days; water levels, surges, and wave height levels up to 48 hours
Weather Forecasts
Hyper-local weather forecasts, including 1-hour windows up to 24 hours and 6-hour windows 1-15 days in the future. Includes severe weather and storm path predictions
Seasonal Forecast
Comprehensive long-range forecast beyond traditional 15-day forecast. Temperature and precipitation anomaly predictions extend 4 months into the future.
Objective of slides 17-21: Introduce and tell the story of COGNITIVE
So why do we do all of this? Because at the end of the day, the most precise and accurate data…at scale yields insights that drive better decisions...sooner.
Today, however, 88% of all data is dark. Sources like dark data - - data that is invisible to computers - - like data found in unstructured information – books, emails, tweets, journals, blogs, images, sound and videos.
The challenge here is that this pool of dark matter is only going to get bigger. Therefore businesses need a fundamentally different approach to the infrastructure they have today.
This is why the combination of MAN & MACHINE is so important – because together, they have the ability to illuminate that dark data as well as other types of data like atmospheric data, weather, sentiment, etc. Let’s be clear: the physical world is becoming instrumented and there is a risk for disruption for companies that don’t participate. That is the significance of cognitive computing and Watson
At The Weather Company, we are on the path to cognitive.
As a starting point on our journey, we start with predictive analytics. So, a question for you: Why aren’t businesses doing something about weather? Let’s take a deeper dive. Most analytics are based on airport observations. Traditional weather analytics efforts fail because businesses are looking at the weather for an airport for a day. They are getting simply a daily output for the nearest government reporting station. So just imagine a large quick service restaurant chain in the San Francisco area with 30+ locations. They’re using data from the airport location that, in this case, just happens to be right outside of San Francisco. So why is that a bad thing?
Because as we discussed before, weather is hyper-local and precision is paramount. This is the San Francisco Bay area. Remember, we said that If you live within 2km of a weather reporting station you will receive a forecast that is 15% more accurate. And in analytics 15% makes an incredible amount of difference. Imagine if there were severe weather over just a small portion of this? Consumer behavior changes in the places where it’s pouring. So, you’ll reach a completely different conclusion about store traffic and staffing for a retail outlet or quick service restaurant (QSR) at an area where it is raining heavily.
In Aviation, we see cognitive as a co-pilot, helping to detect and mitigate turbulence; optimize flight routing; determine fuel contingency needs; and monitoring aircraft both on the ground and in the air.
In the Energy sector, we can:
Improve trading decisions, thereby increasing trader profitability
Improve grid resiliency by helping utility operators prevent, recover and survive in the wake of extreme weather
Support investment in renewables through improvements in generation predictability
Safeguard critical infrastructure and protect field workers against extreme weather events - both on and off shore
Objective of slides 22-24: Introduce the SUN Platform
The work we do, however, is only as good as the foundation supporting it. The SUN platform is our cloud-based data platform that ingests more than 24 terabytes of data a day. More than 100 different types of data. The platform supports not only the ingestion of data, but the transformation so that it can be used for analytic purposes.
As an example, various forms of data come into the platform – both IoT sensor based data, but also our hyper-local weather data. It is then made available to analytics applications where that data can be used to provide consumers with the information they need to plan their days, plan for and act in the face of severe weather, or receive ads that are both personalized and relevant to them in the moment.
Businesses can personalize offers to consumers, engaging them in ways never seen before (Watson ads). They can also improve business performance by making smarter decisions about everything from staffing to asset maintenance; from optimal transportation routes to claim mitigation.
Here is an example of how SUN could work in insurance. In this case, insurance companies want to know who might be at risk for a claim or who might be a good upsell / cross sell target. By understanding consumer behavior in the home AND marrying that with weather data, insurers have a much better picture of who to target and when.
Objective of slides 25 – 31 – Tell the story through USE CASES.
At the end of the day, the most precise, accurate data…at scale yields insights that drive better decisions...sooner, which lead to more favorable outcomes. Let’s take a look at some of the solutions The Weather Company offers and the use cases that show them in action.
Alerts is a solution designed to help companies in all sectors strengthen customer relationships through more personalized touchpoints; for those with field workers, like utilities and telecommunications companies – keep them safe from the perils of hazardous weather and for retailers, make more informed decisions about staffing, store stocking and product placement. Powered by The Weather Company data, Alerts is a SaaS based offering that delivers localized, timely and pre-built notifications to deliver important – and potentially life-saving – information to the platform of choice.
The Weather Company provides mission critical applications to the aviation industry and most notably commercial aviation. At present, we serve 45 of the Top 100 global airlines and 13 of the top 20. We work with more than 140 airlines around the world to ensure safe, efficient and on-time operations through a platform of services. Our approach has been to deliver the most precise, actionable weather, transform that data into insights that improve safety and the bottom line while optimizing business performance.
Use Cases:
Turbulence. Turbulence costs a typical large airline $3M annually in crew injury and maintenance costs. To help airlines mitigate the risks, we collect real-time turbulence observations from aircraft equipped with sensors and then send real-time alerts to dispatchers and crew of imminent hazards. Finally, we provide solutions that enable dispatchers and pilots to use those insights to alter routes to either avoid turbulence or encourage crew and passengers to buckle up. As a result, we’ve been able to help individual airlines save 50% in injuries related to turbulence and unplanned maintenance inspections.
Ramp Safety. The timing and duration of ramp closures due to severe weather threats cause flight delays and propagates downstream. By delivering early insights into severe weather threats, including the exact timing of impact, The Weather Company allows airlines to more precisely plan ramp closures and shortens the time to full recovery, significantly reducing impact on operations and saving costs. The value? A major airline saves $1.7M annually by reducing delays by 10 minutes during peak time at O’Hare Airport, Chicago, IL.
Every market has its own kind of disruptive weather. And every television station must forecast, detect and visualize that weather for their audience in their own way, reflecting their own news brand. The Weather Company’s suite of Television, Mobile and Online products allow weather stations and broadcasters to choose from among the most advanced sets of weather data, broadcast production tools and visualization features for all platforms.
Today, we serve more than 700 stations globally, helping them remain essential to the lives of their audiences.
Use Cases:
Mobile Engagement – By 2018, 51% of Americans will view video on a mobile device and video ad revenue will double to $5B. Local television needs to leverage mobile video to monetize their audience. The Weather Company helps these stations by giving them the tools to drive automated, push notifications that deliver hyper-local, contextually relevant stories made for video to garner more eyeballs and higher CPM rates.
A Daily Habit – Overall, local TV news viewership has declined, while morning viewership has grown and is a primary source of revenue for stations and station groups. Stations must differentiate in the mornings to gain younger audiences that are more attractive to advertisers. With The Weather Company, stations can deliver hyper-local real-time traffic and weather information, particularly during morning commute times. They can publish content, including up-to-the-minute reports across digital platforms that audiences come back to throughout the day.
The Weather Company’s suite of products for Energy & Utilities delivers accurate weather forecasting that improve energy trading decisions, long range planning, outage prediction and predictive asset maintenance. The industry’s most reliable, easy-to-use web-based forecasts, long-range outlooks and historical data allow our clients to better predict load and natural gas demand.
Use Cases:
1. Load Forecasting – Energy traders and utility companies need the most skillful weather forecasts to better predict energy demand and the associated price of electricity. At The Weather Company, we translate skillfull short and medium range forecasts by location into energy demand forecasts to help improve energy demand planning and price predictions.
Real-time weather forecasting is essential for truly differentiated response to extreme weather events, like flooding and tropical storms. The Weather Company helps insurers bring together insights from real-time weather data feeds to improve operational performance and decision-making around weather risk assessment, severe weather event preparation, loss prevention, forensic meteorology, and disaster response and recovery.
Use Cases:
Proactive Alerts - For insurance companies, the least costly event is the one that never occurs. Insurers also need to create better customer experiences by helping policyholders protect life and property in the face of significant weather events. Weather data can provide insight into significant and hazardous weather events. Proactive alerts to customers in the path of potential damage from an impending storms can provide significant savings for both customers and insurance carriers. In fact, we’ve seen that when you alert people to imminent hail, encouraging them to take action to protect both life and property, 52% of the people will take action.
What are your customers looking to buy and when? Retailers need to know what’s coming their way — especially when it comes to weather. With a best-in-class suite of custom weather solutions for retail, our customers can better understand how weather affects store traffic patterns and consumer buying habits. So, they can better manage inventory allocation, refine staffing and operations, and generate geo-targeted weather triggered ads that drive sales — and increase brand loyalty. Use Cases:
Weather-Triggered Ads – Retail and CPG companies need to better leverage historic, current and forecasted weather conditions to guide their marketing campaigns and improve effectiveness. The Weather Company delivers precise hour-by-hour weather and location data to help retailers understand the impact of weather on retail sales by both location and season. With that insight, marketers can run geo-located, weather triggered ads at scale that are contextually relevant to audiences and influence buying behaviors.