Population Growth andNatural Resources
EXPLORATION 1
The human population has changed over time as a result of many factors. Increased
use of natural resources, along with improvements in areas such as transportation,
agriculture, health, and sanitation, have allowed the human population to grow.
The Human Population
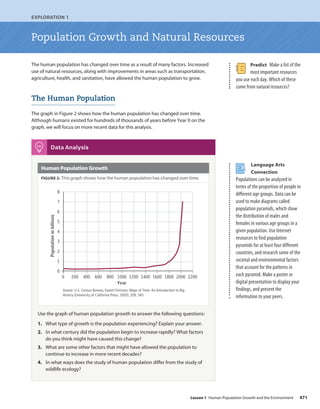
The graph in Figure 2 shows how the human population has changed over time.
Although humans existed for hundreds of thousands of years before Year 0 on the
graph, we will focus on more recent data for this analysis.
Human Population Growth
FIGURE 2: This graph shows how the human population has changed over time.
Source: U.S. Census Bureau; David Christian, Maps of Time: An Introduction to Big
History (University of California Press, 2003), 209, 343
Year
0 200 400 600 800 1000 1200 1400 1600 2000 2200
1800
8
7
6
5
4
3
2
1
0
Population
in
billions
p
Use the graph of human population growth to answer the following questions:
1. What type of growth is the population experiencing? Explain your answer.
2. In what century did the population begin to increase rapidly? What factors
do you think might have caused this change?
3. What are some other factors that might have allowed the population to
continue to increase in more recent decades?
4. In what ways does the study of human population differ from the study of
wildlife ecology?
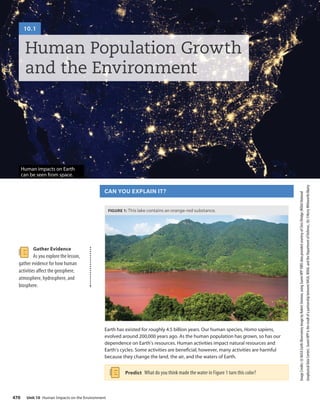
Data Analysis
Predict Make a list of the
most important resources
you use each day. Which of these
come from natural resources?
Language Arts
Connection
Populations can be analyzed in
terms of the proportion of people in
different age groups. Data can be
used to make diagrams called
population pyramids, which show
the distribution of males and
females in various age groups in a
given population. Use Internet
resources to find population
pyramids for at least four different
countries, and research some of the
societal and environmental factors
that account for the patterns in
each pyramid. Make a poster or
digital presentation to display your
findings, and present the
information to your peers.
471
Lesson 1 Human Population Growth and the Environment
Acid Rain
When waterfalls to Earth, water molecules react with carbon dioxide to form carbonic
acid. This weak acid breaks apart, leaving lone hydrogen ions. This gives rain a pH level
of about 5.6. When air pollutants such as nitrogen oxides and sulfur oxides react with
water, sulfuric and nitric acids are produced, making the pH of rain drop below 5.6.
Thus, the rain becomes more acidic and is called acid rain.
Acid rain can have negative effects on soil. As pH decreases, reactions occur that cause
metal ions to be released into the soil. These ions prevent plants from absorbing
calcium, a nutrient that enhances plant growth and development. Aluminum can also
be carried to bodies of water and can cause the deaths of fish and fish eggs. Humans
are not affected directly by acid rain, but it can damage or destroy structures such as
buildings, bridges, and statues.
Climate Change
Earth is somewhat comparable to a greenhouse. Earth’s atmosphere acts like
the glass in a greenhouse. Solar radiation enters the atmosphere as high-energy
wavelengths of light that warm Earth’s surface. This energy is absorbed and reradiated
as infrared radiation from Earth’s surface. Some of the energy escapes into space. The
rest is absorbed by gases and warms the air. This phenomenon, referred to as the
greenhouse effect, keeps the temperature of Earth at a level that supports life.
When gases like carbon dioxide and methane are added to the atmosphere, they
increase the amount of infrared energy that is trapped in the air. Figure 10 shows the
properties of the main greenhouse gases, including their Global Warming Potentials
(GWP). GWP is a comparative measure of how much heat a gas may absorb.
As more energy is stored in Earth’s atmosphere and oceans, the cycling of matter and
energy among ecosystems is altered. Studies suggest that hurricanes, for example,
are becoming more intense on average. Scientists think this is because there is more
energy stored as heat in Earth’s oceans, and this energy provides the fuel for these
destructive storms. As global temperatures rise, glaciers and ice caps have been
observed decreasing in size, and the water contained in them is added to oceans. This
causes average global sea level to rise, which affects ecosystems and human societies.
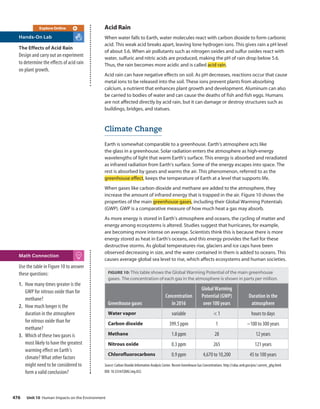
FIGURE 10: This table shows the Global Warming Potential of the main greenhouse
gases. The concentration of each gas in the atmosphere is shown in parts per million.
Greenhouse gases
Concentration
in 2016
Global Warming
Potential (GWP)
over 100 years
Duration in the
atmosphere
Water vapor variable < 1 hours to days
Carbon dioxide 399.5 ppm 1 ~100 to 300 years
Methane 1.8 ppm 28 12 years
Nitrous oxide 0.3 ppm 265 121 years
Chlorofluorocarbons 0.9 ppm 4,670 to 10,200 45 to 100 years
Source: Carbon Dioxide Information Analysis Center. Recent Greenhouse Gas Concentrations. http://cdiac.ornl.gov/pns/ current_ghg.html.
DOI: 10.3334/CDIAC/atg.032.
Use the table in Figure 10 to answer
these questions:
1. How many times greater is the
GWP for nitrous oxide than for
methane?
2. How much longer is the
duration in the atmosphere
for nitrous oxide than for
methane?
3. Which of these two gases is
most likely to have the greatest
warming effect on Earth’s
climate? What other factors
might need to be considered to
form a valid conclusion?
Math Connection
The Effects of Acid Rain
Design and carry out an experiment
to determine the effects of acid rain
on plant growth.
Hands-On Lab
Explore Online
Unit 10 Human Impacts on the Environment
476
CONTINUE YOUR EXPLORATION
MATERIALS
•beaker, 250 mL
• marker
• pencil
• ruler, metric
• seedling, potted radish (4)
• water, pH 3, 100 mL
• water, pH 4, 100 mL
• water, pH 5, 100 mL
• water, pH 6, 100 mL
Hands-On Lab
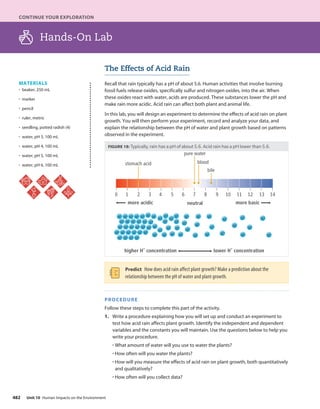
The Effects of Acid Rain
Recall that rain typically has a pH of about 5.6. Human activities that involve burning
fossil fuels release oxides, specifically sulfur and nitrogen oxides, into the air. When
these oxides react with water, acids are produced. These substances lower the pH and
make rain more acidic. Acid rain can affect both plant and animal life.
In this lab, you will design an experiment to determine the effects of acid rain on plant
growth. You will then perform your experiment, record and analyze your data, and
explain the relationship between the pH of water and plant growth based on patterns
observed in the experiment.
FIGURE 18: Typically, rain has a pH of about 5.6. Acid rain has a pH lower than 5.6.
higher H
+
concentration lower H
+
concentration
stomach acid
bile
pure water
blood
neutral
1 2 3 4 14
13
12
11
10
9
8
7
6
5
0
more acidic more basic
H+
H+
H+
H+
H+
H+
H+
H+
H+
H+
H+
H+
H+
H+
H+
H+
H+
H+
H+
H+
H+
H+
H+
H+
H+
H+
H+
H+
H+
H+
H+
H+
H+
H+
H+
H+ H+
H+
H+
H+
H+
H+
H+
H+
H+
H+
H+
H+
H+
H+
H+
H+
H+
H+
H+
H+
H+
H+
H+
H+
Predict How does acid rain affect plant growth? Make a prediction about the
relationship between the pH of water and plant growth.
PROCEDURE
Follow these steps to complete this part of the activity.
1. Write a procedure explaining how you will set up and conduct an experiment to
test how acid rain affects plant growth. Identify the independent and dependent
variables and the constants you will maintain. Use the questions below to help you
write your procedure.
• What amount of water will you use to water the plants?
• How often will you water the plants?
• How will you measure the effects of acid rain on plant growth, both quantitatively
and qualitatively?
• How often will you collect data?
482 Unit 10 Human Impacts on the Environment
14.
2. Have yourteacher approve your procedure before you perform your experiment.
3. Design a data table to organize your results.
4. Gather your materials.
5. Set up and conduct your experiment.
ANALYZE
Follow these steps to complete this part of the activity.
1. Graph your data. Determine whether a line graph or bar graph is appropriate, and
construct that type of graph.
2. Describe patterns you see in the data. How did each pH affect plant growth?
EXPLAIN
Write an explanation that includes the following sections.
Claim What is the relationship between the pH of water and plant growth? Was your
prediction correct?
Evidence Give specific examples from your data to support your claim.
Reasoning Explain how the evidence you gave supports your claim. How does it back
up what you are saying?
REFINE
Address Error Identify possible sources of experimental error in your design. List
possible reasons for inconsistent results you may have observed.
Propose Changes What changes would you make to this procedure if you were to do
it again? Why would you make these changes?
EXTEND YOUR INVESTIGATION
Measure the pH of rain in your area. Based on the results of your experiment, what
could you conclude about how the pH of rain might affect the growth of plants?
What other types of evidence would you need to form a valid conclusion?
CALCULATING YOUR
CARBON FOOTPRINT
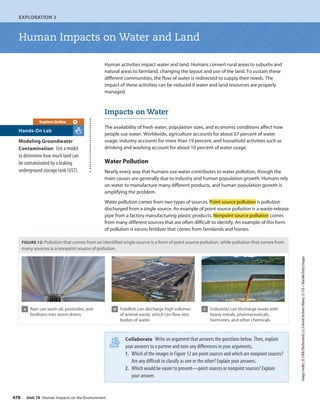
POLLUTION AND
HUMAN HEALTH
CLEANING UP
OIL SPILLS
Go online to choose one of
these other paths.
Lesson 1 Human Population Growth and the Environment 483
Check Your Understanding
1.Which of these have contributed to the increase of
human population growth? Select all correct answers.
a. discovery of penicillin
b. increase in antibiotic-resistant bacteria
c. transportation that allows food distribution
d. administration of vaccinations
e. availability of all types of fast food
2. Wheatgrass is the young grass of the wheat plant, and
it is used to feed livestock. What kind of resource is
wheatgrass?
a. renewable and biomass
b. nonrenewable and biomass
c. renewable and fossil fuel
d. nonrenewable and fossil fuel
3. Which of these activities would be the best way to reduce
fossil fuel use?
a. riding a bike to school
b. eating processed foods
c. watching TV
d. buying books
4. A drought leads to loss of much of the local vegetation.
Which measures would be best for preventing soil
erosion?
a. plant more bushes and trees
b. water remaining plants daily
c. cover soil with stones or rocks
d. add more soil to the ground
5. How does deforestation affect climate change?
6. If the human population were to exceed Earth’s carrying
capacity, how would human population growth change?
7. Consider the group of words
groundwater, trees, solar energy, and steel
Which does not belong to the group and why?
8. Suppose you are an environmental engineer, a scientist
who helps develop solutions to environmental problems.
You have been hired by a manufacturing plant to help
conserve natural resources and save money. What
suggestions would you give to achieve these goals?
9. Which of the following is not an example of a point-
source pollution?
a. oil that is escaping from a damaged tanker
b. heavy metals that are leaching out of an underground
mine
c. water runoff from residential lawns
d. untreated sewage that is accidentally released from a
wastewater treatment plant
10. Over a long period of time, how might living things adapt
to increased carbon dioxide levels and climate change?
Do you think most species will adapt, or are many species
likely to go extinct?
MAKE YOUR OWN STUDY GUIDE
In your Evidence Notebook, design a study guide that
supports the main ideas from this lesson:
The human population has increased over time because of
advances that support and prolong human life.
Human activities can impact air, land, and water quality.
However, actions can be taken to reduce negative impacts on
the environment.
Remember to include the following information in your
study guide:
• Use examples that model main ideas.
• Record explanations for the phenomena you investigated.
• Use evidence to support your explanations. Your support can
include drawings, data, graphs, laboratory conclusions, and
other evidence recorded throughout the lesson.
Consider how human activities can affect the environment, life on
Earth, and Earth’s climate.
EVALUATE
CHECKPOINTS
485
Lesson 1 Human Population Growth and the Environment