Download as PDF, PPTX
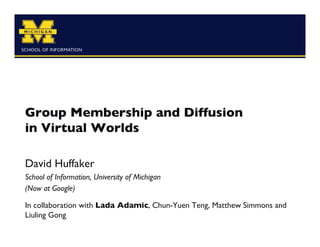
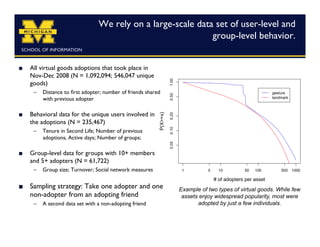
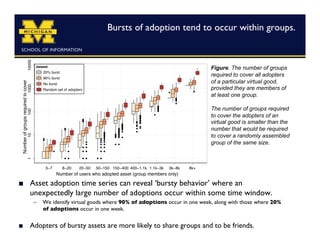
![Diffusion has often been explained in terms of
social influence and homophily.
Theories of Social Influence suggest that Social Influence
exposure to influential individuals increase the
likelihood of adopting similar beliefs [Monge
Contractor, 2003].
– Examples in online settings: Wu et. al, 2006; Bakshy et. al,
2009, Centola, 2010.
Theories of Homophily suggest that individuals
seek out others with same self-categorization or
belong to same formal or informal groups [McPherson Homophily
2001].
– Examples in online settings: Aral et. al, 2009; Leskovec et.
al, 2007)
Some argue there is really a complex
interplay of the two [Jackson, 2009; Shalizi
Thomas, 2011; Crandall et. al, 2008]](https://image.slidesharecdn.com/huffaker-groupdiffusionsecondlife-slides-111014001316-phpapp02/85/Group-Membership-and-Diffusion-in-Virtual-Worlds-3-320.jpg)
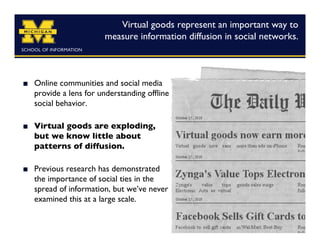
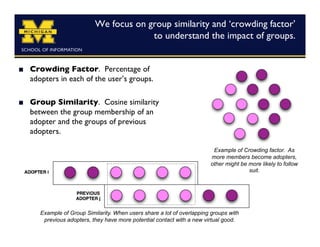
![Second Life is a free, 3D virtual world
with over one million users1.
[1]: Source: http://en.wikipedia.org/wiki/Second_Life](https://image.slidesharecdn.com/huffaker-groupdiffusionsecondlife-slides-111014001316-phpapp02/85/Group-Membership-and-Diffusion-in-Virtual-Worlds-5-320.jpg)
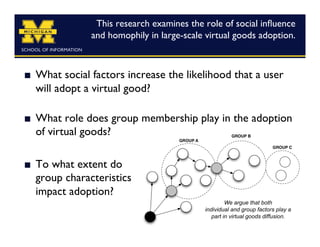
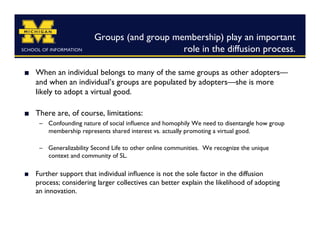
![Users can join up to 25 groups in Second Life.
Most groups involving top virtual goods
sellers fall into the following categories:
[Huffaker et. al, 2010]
– Retail and Scripting (e.g., avatars, fashion,
furniture, etc.)
– Music / Clubs / DJ (e.g., fan clubs, venues,
and promotion)
– Lifestyle (e.g., interest, social or adult-
oriented groups)
– Land Rentals (e.g., landlords, vacation
rentals)
– Games (e.g., casinos, games of chance)](https://image.slidesharecdn.com/huffaker-groupdiffusionsecondlife-slides-111014001316-phpapp02/85/Group-Membership-and-Diffusion-in-Virtual-Worlds-7-320.jpg)
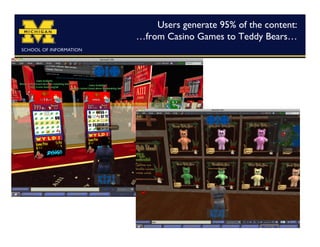
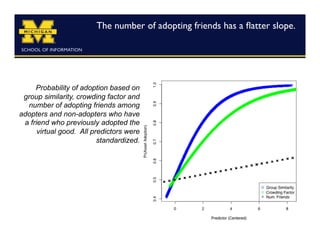
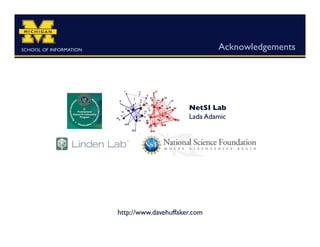
![Group similarity and crowding factor have a strong
impact on the likelihood of adoption.
We use a logistic regression model to Estimate
CV
predict the likelihood of adopting an
asset after a friend adopts it [Bakshy et. al, # Days in Second Life
–.01
.50
2009].
# Adopting Friends
–.44
.53
We use cross-validation (10-fold) in # of Groups
–.52
.53
order to estimate how well the
Distance from 1st Adopter
–.07
.56
predictive model performs. The left-most
column shows the individual CVs. # Other Adopted Assets
.48
.58
Group similarity and crowding # Friends with Previous .34
.58
factor are the most predictive Adopters
individuals variables in Crowding Factor
.10
.61
determined if an adopter’s
friends will adopt. Group Similarity
.23
.63
Combined Model
.68
Note: We applied the same analysis to a data set
where the adopter and non-adopter do not share a
All variables are significant, p .001
common adopting friend and find consistent results.](https://image.slidesharecdn.com/huffaker-groupdiffusionsecondlife-slides-111014001316-phpapp02/85/Group-Membership-and-Diffusion-in-Virtual-Worlds-10-320.jpg)

The research examines the adoption of virtual goods in online communities, specifically focusing on the roles of social influence and homophily. It utilizes a large-scale dataset from Second Life to analyze how group membership and characteristics impact the likelihood of adopting virtual goods. Findings indicate that group similarity and crowding factor significantly influence adoption behavior, highlighting the importance of both individual and group dynamics in the diffusion process.


![5G Explained! A High Level Overview [Introduction]](https://cdn.slidesharecdn.com/ss_thumbnails/5gexplainedahighleveloverview-260119165306-cc137a3e-thumbnail.jpg?width=640&height=640&fit=bounds)


