Download as PDF, PPTX


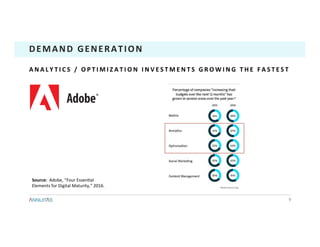

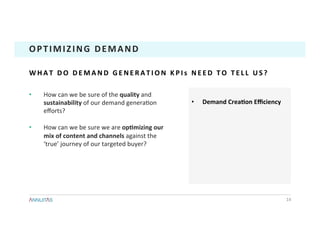
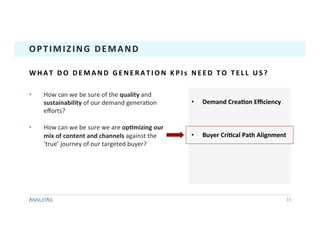
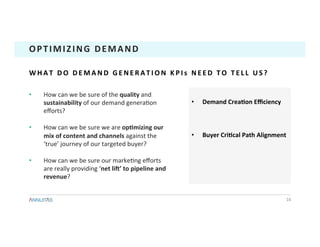
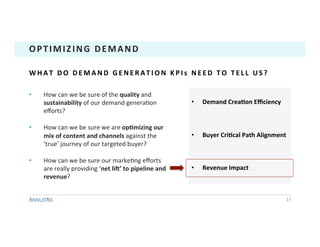
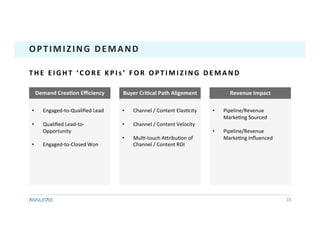

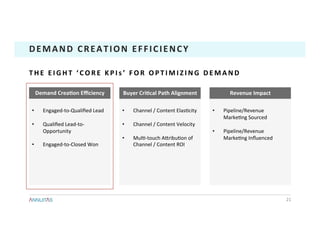
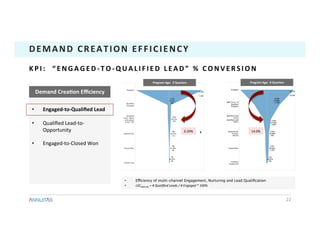
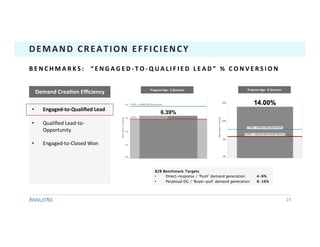
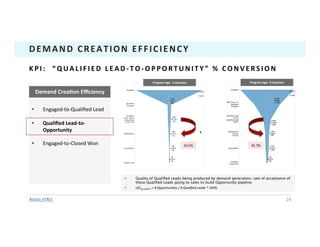
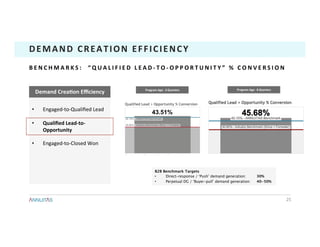
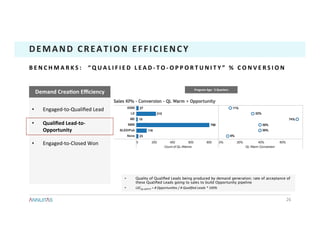


The document discusses demand generation optimization, citing that organizations with mature programs see lead-to-revenue results 4-10 times higher than industry averages. It highlights the importance of demand generation key performance indicators (KPIs) for ensuring quality and sustainability in marketing efforts, including metrics such as engaged-to-qualified lead conversion rates. Additionally, it emphasizes the need for aligning marketing strategies with the buyer's journey to enhance overall effectiveness and revenue impact.


