Download to read offline
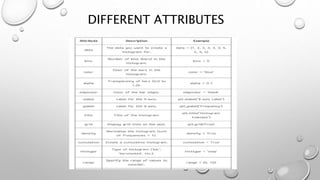
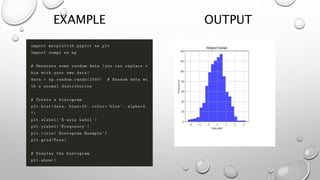

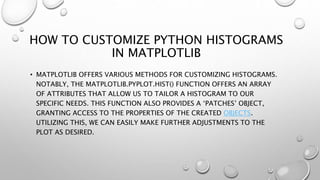
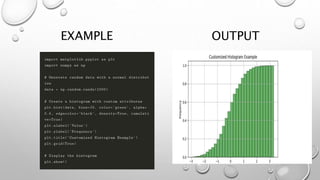

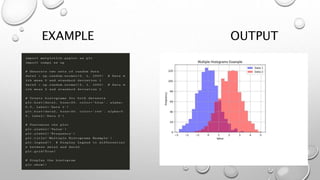

The document provides a guide on creating histograms in Python using libraries like Matplotlib and NumPy. It explains how to customize various attributes of the histogram such as bins, colors, and labels, as well as how to generate and visualize random datasets. Additionally, it discusses methods for creating multiple histograms to compare different data distributions.


![histgram[1].ppt](https://cdn.slidesharecdn.com/ss_thumbnails/histgram1-230407224656-71c96df0-thumbnail.jpg?width=640&height=640&fit=bounds)


