Polymers – AnIntroduction
This tutorial will cover the following topics
• How to recognize different types of polymers
• Crystalline, semi-crystalline and amorphous
• Identification of Polymers
• Measuring Crystallinity
2
3.
Polymers
• Polymers comein many forms. They can be
crystalline, microcrystalline or amorphous.
In a single polymer, you often find all three
forms depending on how the polymer was
made and processed, frequently, forms are
mixed in a single sample.
• Polymers, like other crystalline solids, can
also have polymorphs, polytypes,
and all types of solid state molecular
arrangements.
3
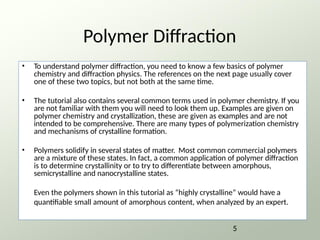
Polymer Diffraction
• Tounderstand polymer diffraction, you need to know a few basics of polymer
chemistry and diffraction physics. The references on the next page usually cover
one of these two topics, but not both at the same time.
• The tutorial also contains several common terms used in polymer chemistry. If you
are not familiar with them you will need to look them up. Examples are given on
polymer chemistry and crystallization, these are given as examples and are not
intended to be comprehensive. There are many types of polymerization chemistry
and mechanisms of crystalline formation.
• Polymers solidify in several states of matter. Most common commercial polymers
are a mixture of these states. In fact, a common application of polymer diffraction
is to determine crystallinity or to try to differentiate between amorphous,
semicrystalline and nanocrystalline states.
Even the polymers shown in this tutorial as “highly crystalline” would have a
quantifiable small amount of amorphous content, when analyzed by an expert.
5
6.
References
A basic primeron polymers and their properties
• http://www.pslc.ws/mactest/maindir.htm
- University of Southern Mississippi, School of Polymers
“Macrogalleria”
150 Full Patterns of Polymers and their blends,
available for sale from the ICDD
• “X-ray Diffraction Patterns of Polymers”, June Turley,
ICDD, 1965
Note: Many illustrations in this tutorial are from this
book.
Fundamental Texts on Diffraction Theory of
Polymers
• “X-ray Diffraction Procedures for Polycrystalline and Amorphous Materials”, Harold P.
Klug and L. R. Alexander, Wiley-Interscience, 1974, available from Wiley-Interscience
• “X-ray Diffraction Methods in Polymer Science”, L. R. Alexander, Wiley-Interscience,
1969 (Note: Hard to find, not currently available), Kreiger Publishing, 1979
6
7.
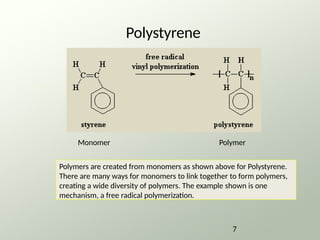
Monomer Polymer
Polystyrene
Polymers arecreated from monomers as shown above for Polystyrene.
There are many ways for monomers to link together to form polymers,
creating a wide diversity of polymers. The example shown is one
mechanism, a free radical polymerization.
7
8.
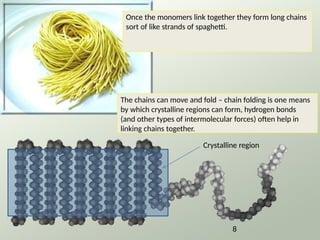
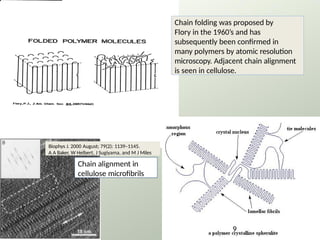
Once the monomerslink together they form long chains
sort of like strands of spaghetti.
The chains can move and fold – chain folding is one means
by which crystalline regions can form, hydrogen bonds
(and other types of intermolecular forces) often help in
linking chains together.
8
Crystalline region
9.
Chain folding wasproposed by
Flory in the 1960’s and has
subsequently been confirmed in
many polymers by atomic resolution
microscopy. Adjacent chain alignment
is seen in cellulose.
Chain alignment in
cellulose microfibrils
9
Biophys J. 2000 August; 79(2): 1139–1145.
A A Baker, W Helbert, J Sugiyama, and M J Miles
10.
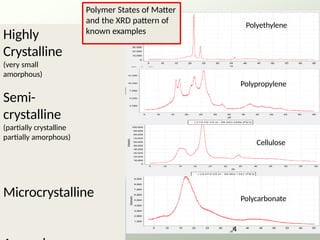
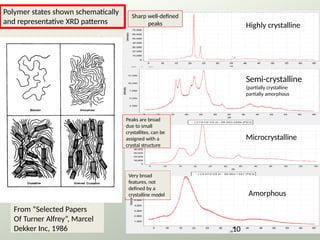
Highly crystalline
Cellulose
Semi-crystalline
(partially crystalline
partiallyamorphous
From “Selected Papers
Of Turner Alfrey”, Marcel
Dekker Inc, 1986
Microcrystalline
Amorphous
Polymer states shown schematically
and representative XRD patterns
Sharp well-defined
peaks
Peaks are broad
due to small
crystallites, can be
assigned with a
crystal structure
Very broad
features, not
defined by a
crystalline model
10
11.
11
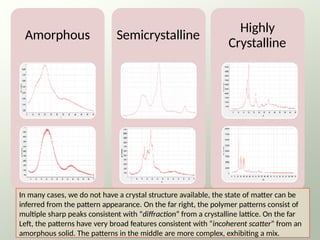
Amorphous Semicrystalline
Highly
Crystalline
In manycases, we do not have a crystal structure available, the state of matter can be
inferred from the pattern appearance. On the far right, the polymer patterns consist of
multiple sharp peaks consistent with “diffraction” from a crystalline lattice. On the far
Left, the patterns have very broad features consistent with “incoherent scatter” from an
amorphous solid. The patterns in the middle are more complex, exhibiting a mix.
12.
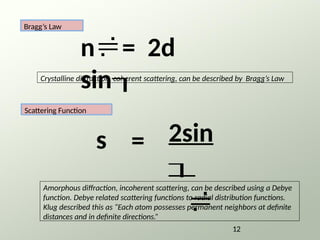
n= 2d
sin
2sin
s =
Bragg’sLaw
Scattering Function
Amorphous diffraction, incoherent scattering, can be described using a Debye
function. Debye related scattering functions to radial distribution functions.
Klug described this as “Each atom possesses permanent neighbors at definite
distances and in definite directions.”
12
Crystalline diffraction, coherent scattering, can be described by Bragg’s Law
13.
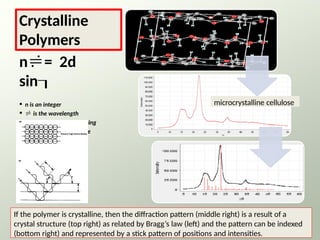
Crystalline
Polymers
n= 2d
sin
• nis an integer
• is the wavelength
• d is the inter-planar spacing
• is the diffraction angle
If the polymer is crystalline, then the diffraction pattern (middle right) is a result of a
crystal structure (top right) as related by Bragg’s law (left) and the pattern can be indexed
(bottom right) and represented by a stick pattern of positions and intensities.
microcrystalline cellulose
14.
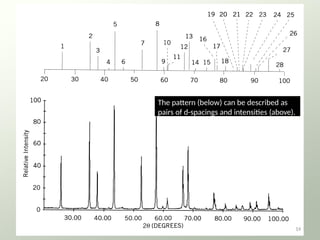
The pattern (below)can be described as
pairs of d-spacings and intensities (above).
14
15.
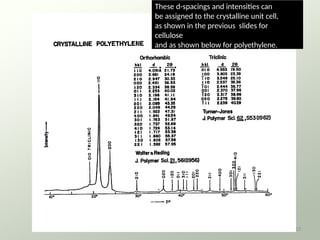
These d-spacings andintensities can
be assigned to the crystalline unit cell,
as shown in the previous slides for
cellulose
and as shown below for polyethylene.
15
16.
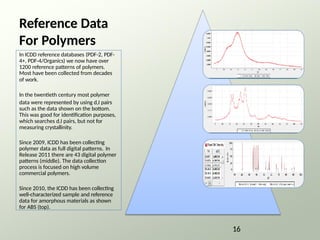
Reference Data
For Polymers
InICDD reference databases (PDF-2, PDF-
4+, PDF-4/Organics) we now have over
1200 reference patterns of polymers.
Most have been collected from decades
of work.
In the twentieth century most polymer
data were represented by using d,I pairs
such as the data shown on the bottom.
This was good for identification purposes,
which searches d,I pairs, but not for
measuring crystallinity.
Since 2009, ICDD has been collecting
polymer data as full digital patterns. In
Release 2011 there are 43 digital polymer
patterns (middle). The data collection
process is focused on high volume
commercial polymers.
Since 2010, the ICDD has been collecting
well-characterized sample and reference
data for amorphous materials as shown
for ABS (top).
16
17.
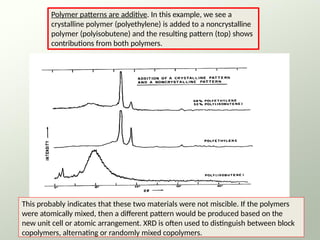
Polymer patterns areadditive. In this example, we see a
crystalline polymer (polyethylene) is added to a noncrystalline
polymer (polyisobutene) and the resulting pattern (top) shows
contributions from both polymers.
This probably indicates that these two materials were not miscible. If the polymers
were atomically mixed, then a different pattern would be produced based on the
new unit cell or atomic arrangement. XRD is often used to distinguish between block
copolymers, alternating or randomly mixed copolymers.
18.
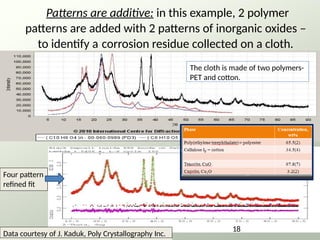
Patterns are additive:in this example, 2 polymer
patterns are added with 2 patterns of inorganic oxides –
to identify a corrosion residue collected on a cloth.
The cloth is made of two polymers-
PET and cotton.
18
Data courtesy of J. Kaduk, Poly Crystallography Inc.
Four pattern
refined fit
19.
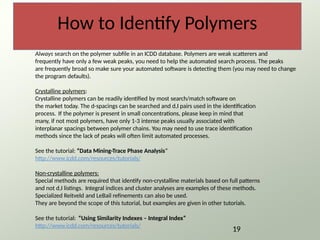
How to IdentifyPolymers
Always search on the polymer subfile in an ICDD database. Polymers are weak scatterers and
frequently have only a few weak peaks, you need to help the automated search process. The peaks
are frequently broad so make sure your automated software is detecting them (you may need to change
the program defaults).
Crystalline polymers:
Crystalline polymers can be readily identified by most search/match software on
the market today. The d-spacings can be searched and d,I pairs used in the identification
process. If the polymer is present in small concentrations, please keep in mind that
many, if not most polymers, have only 1-3 intense peaks usually associated with
interplanar spacings between polymer chains. You may need to use trace identification
methods since the lack of peaks will often limit automated processes.
See the tutorial: “Data Mining-Trace Phase Analysis”
http://www.icdd.com/resources/tutorials/
Non-crystalline polymers:
Special methods are required that identify non-crystalline materials based on full patterns
and not d,I listings. Integral indices and cluster analyses are examples of these methods.
Specialized Reitveld and LeBail refinements can also be used.
They are beyond the scope of this tutorial, but examples are given in other tutorials.
See the tutorial: “Using Similarity Indexes – Integral Index”
http://www.icdd.com/resources/tutorials/
19
20.
Examples of Analyses
–Identification of
Polymers
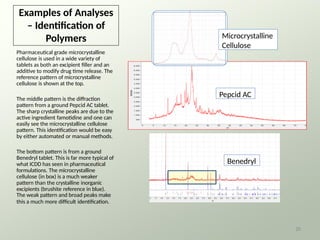
Pharmaceutical grade microcrystalline
cellulose is used in a wide variety of
tablets as both an excipient filler and an
additive to modify drug time release. The
reference pattern of microcrystalline
cellulose is shown at the top.
The middle pattern is the diffraction
pattern from a ground Pepcid AC tablet.
The sharp crystalline peaks are due to the
active ingredient famotidine and one can
easily see the microcrystalline cellulose
pattern. This identification would be easy
by either automated or manual methods.
The bottom pattern is from a ground
Benedryl tablet. This is far more typical of
what ICDD has seen in pharmaceutical
formulations. The microcrystalline
cellulose (in box) is a much weaker
pattern than the crystalline inorganic
excipients (brushite reference in blue).
The weak pattern and broad peaks make
this a much more difficult identification.
20
Pepcid AC
Benedryl
Microcrystalline
Cellulose
21.
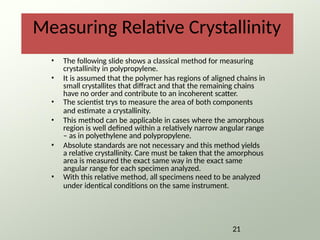
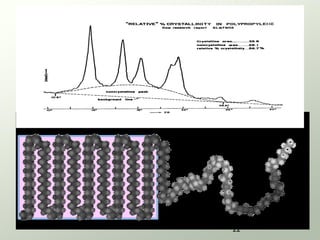
Measuring Relative Crystallinity
•The following slide shows a classical method for measuring
crystallinity in polypropylene.
• It is assumed that the polymer has regions of aligned chains in
small crystallites that diffract and that the remaining chains
have no order and contribute to an incoherent scatter.
• The scientist trys to measure the area of both components
and estimate a crystallinity.
• This method can be applicable in cases where the amorphous
region is well defined within a relatively narrow angular range
– as in polyethylene and polypropylene.
• Absolute standards are not necessary and this method yields
a relative crystallinity. Care must be taken that the amorphous
area is measured the exact same way in the exact same
angular range for each specimen analyzed.
• With this relative method, all specimens need to be analyzed
under identical conditions on the same instrument.
21
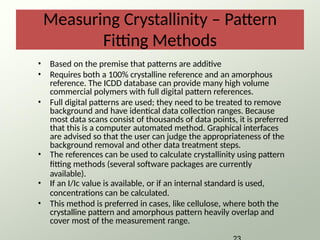
Measuring Crystallinity –Pattern
Fitting Methods
• Based on the premise that patterns are additive
• Requires both a 100% crystalline reference and an amorphous
reference. The ICDD database can provide many high volume
commercial polymers with full digital pattern references.
• Full digital patterns are used; they need to be treated to remove
background and have identical data collection ranges. Because
most data scans consist of thousands of data points, it is preferred
that this is a computer automated method. Graphical interfaces
are advised so that the user can judge the appropriateness of the
background removal and other data treatment steps.
• The references can be used to calculate crystallinity using pattern
fitting methods (several software packages are currently
available).
• If an I/Ic value is available, or if an internal standard is used,
concentrations can be calculated.
• This method is preferred in cases, like cellulose, where both the
crystalline pattern and amorphous pattern heavily overlap and
cover most of the measurement range.
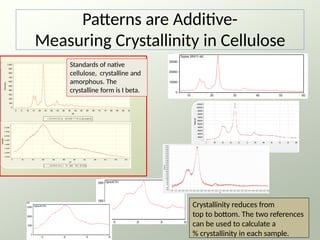
24.
Patterns are Additive-
MeasuringCrystallinity in Cellulose
Standards of native
cellulose, crystalline and
amorphous. The
crystalline form is I beta.
Crystallinity reduces from
top to bottom. The two references
can be used to calculate a
% crystallinity in each sample.
25.
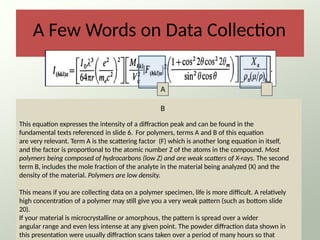
A Few Wordson Data Collection
25
A
B
This equation expresses the intensity of a diffraction peak and can be found in the
fundamental texts referenced in slide 6. For polymers, terms A and B of this equation
are very relevant. Term A is the scattering factor (F) which is another long equation in itself,
and the factor is proportional to the atomic number Z of the atoms in the compound. Most
polymers being composed of hydrocarbons (low Z) and are weak scatters of X-rays. The second
term B, includes the mole fraction of the analyte in the material being analyzed (X) and the
density of the material. Polymers are low density.
This means if you are collecting data on a polymer specimen, life is more difficult. A relatively
high concentration of a polymer may still give you a very weak pattern (such as bottom slide
20).
If your material is microcrystalline or amorphous, the pattern is spread over a wider
angular range and even less intense at any given point. The powder diffraction data shown in
this presentation were usually diffraction scans taken over a period of many hours so that
26.
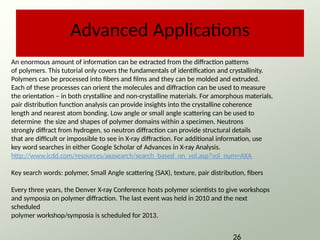
Advanced Applications
An enormousamount of information can be extracted from the diffraction patterns
of polymers. This tutorial only covers the fundamentals of identification and crystallinity.
Polymers can be processed into fibers and films and they can be molded and extruded.
Each of these processes can orient the molecules and diffraction can be used to measure
the orientation – in both crystalline and non-crystalline materials. For amorphous materials,
pair distribution function analysis can provide insights into the crystalline coherence
length and nearest atom bonding. Low angle or small angle scattering can be used to
determine the size and shapes of polymer domains within a specimen. Neutrons
strongly diffract from hydrogen, so neutron diffraction can provide structural details
that are difficult or impossible to see in X-ray diffraction. For additional information, use
key word searches in either Google Scholar of Advances in X-ray Analysis.
http://www.icdd.com/resources/axasearch/search_based_on_vol.asp?vol_num=AXA
Key search words: polymer, Small Angle scattering (SAX), texture, pair distribution, fibers
Every three years, the Denver X-ray Conference hosts polymer scientists to give workshops
and symposia on polymer diffraction. The last event was held in 2010 and the next
scheduled
polymer workshop/symposia is scheduled for 2013.
26
27.
Thank you forviewing our tutorial.
Additional tutorials are available at the ICDD website.
www.icdd.com
International Centre for Diffraction Data
12 Campus Boulevard
Newtown Square, PA 19073
Phone: 610.325.9814
Toll Free Number in US & Canada: 866.378.0331
Fax: 610.325.9823