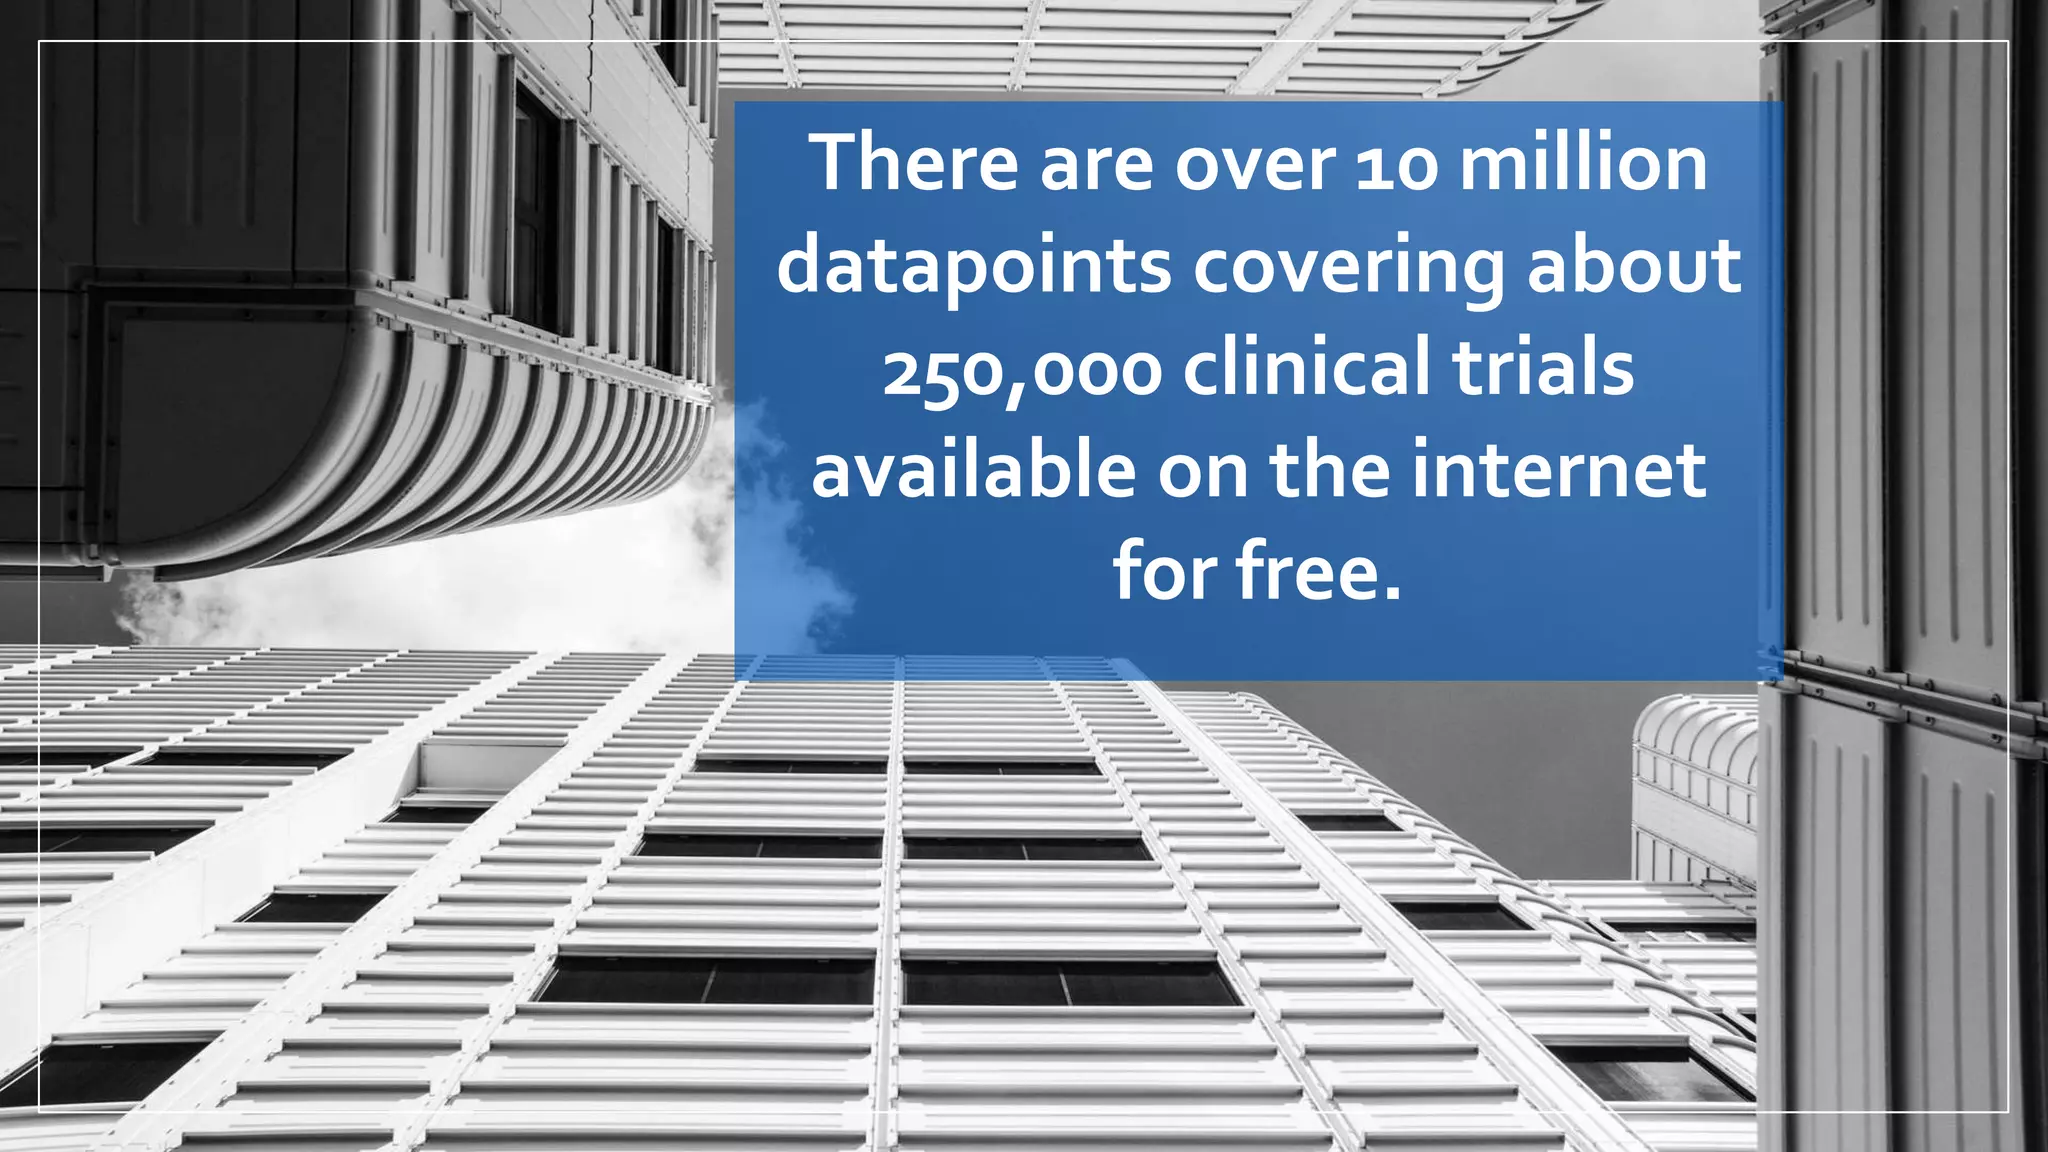
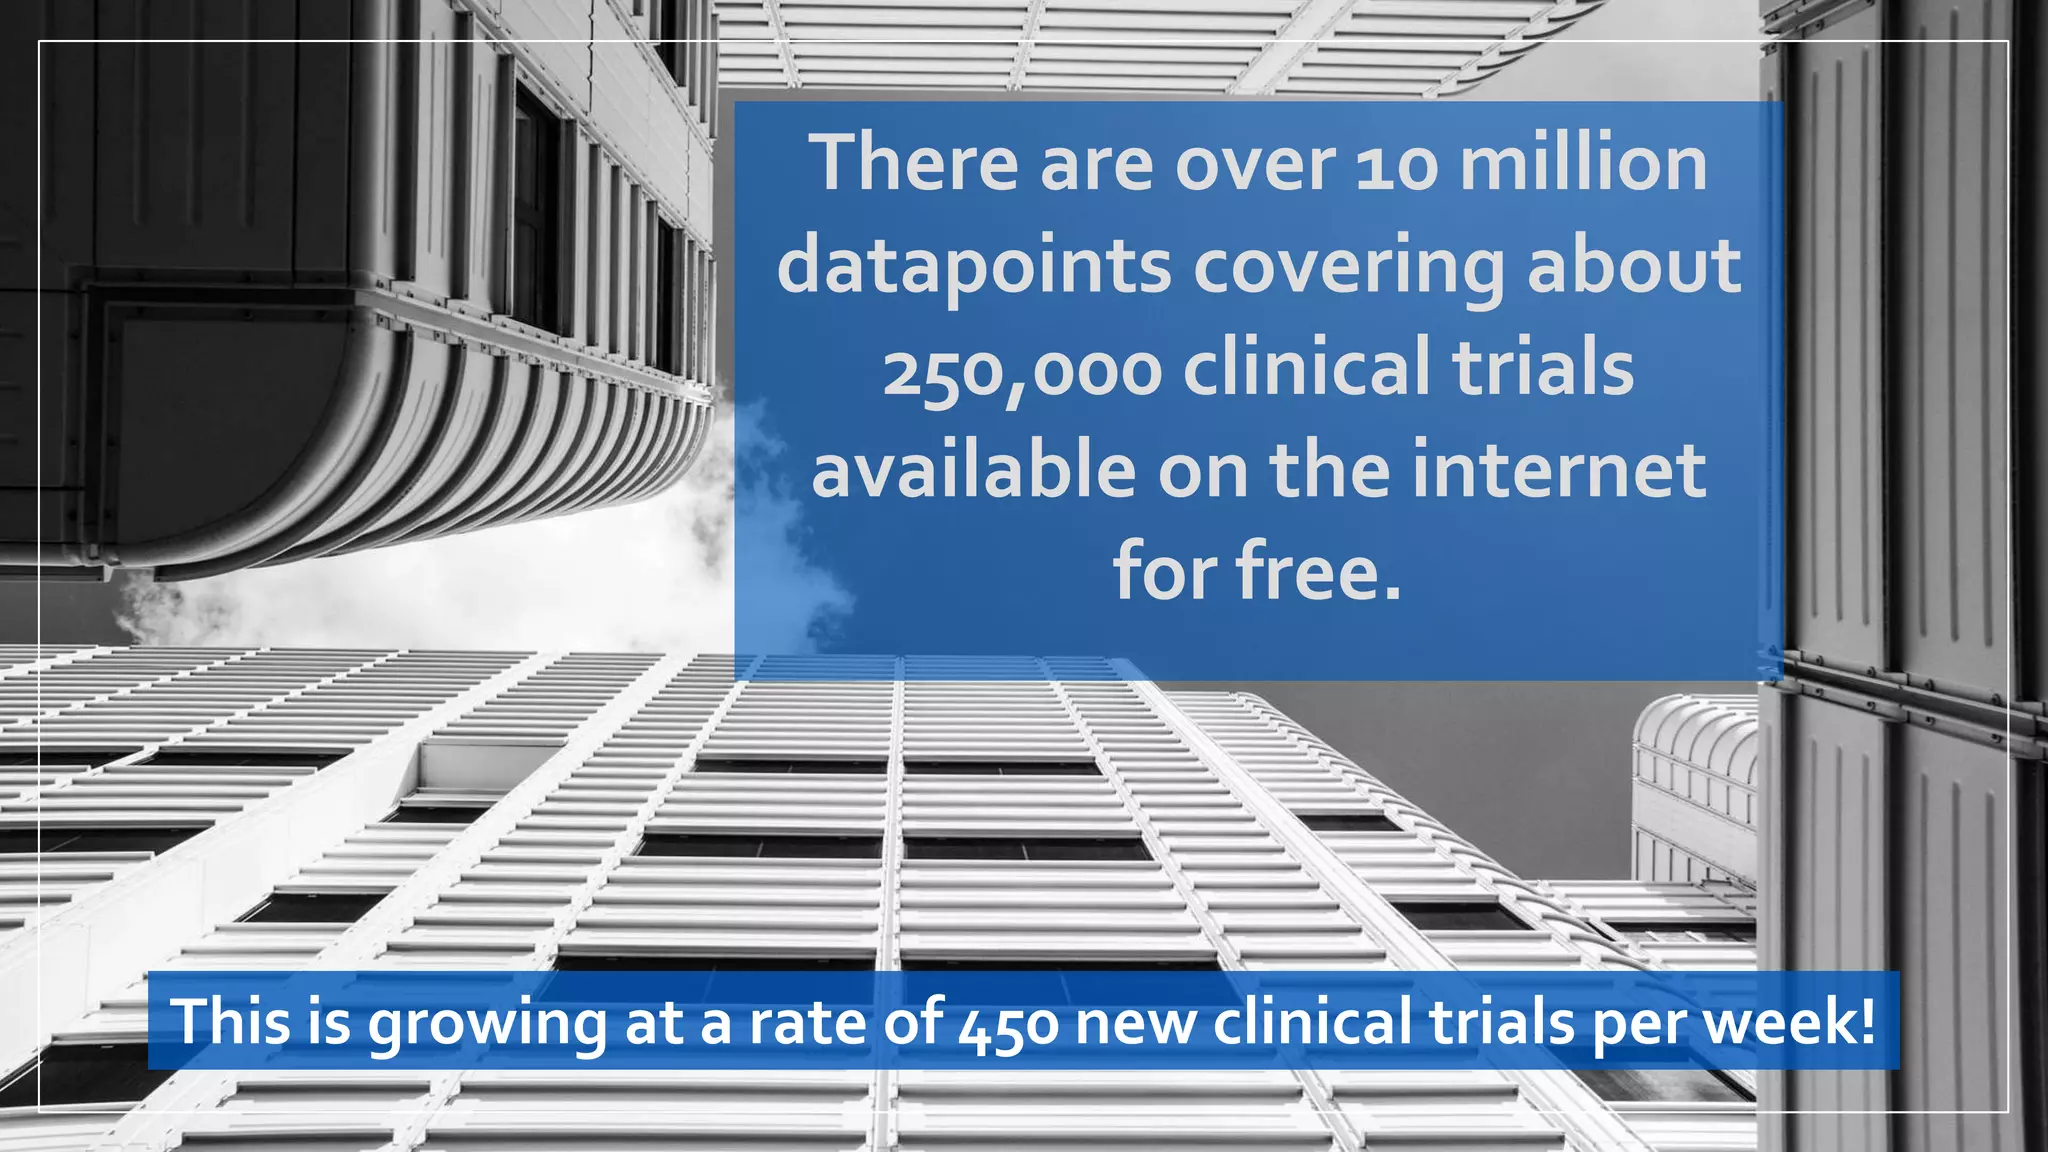
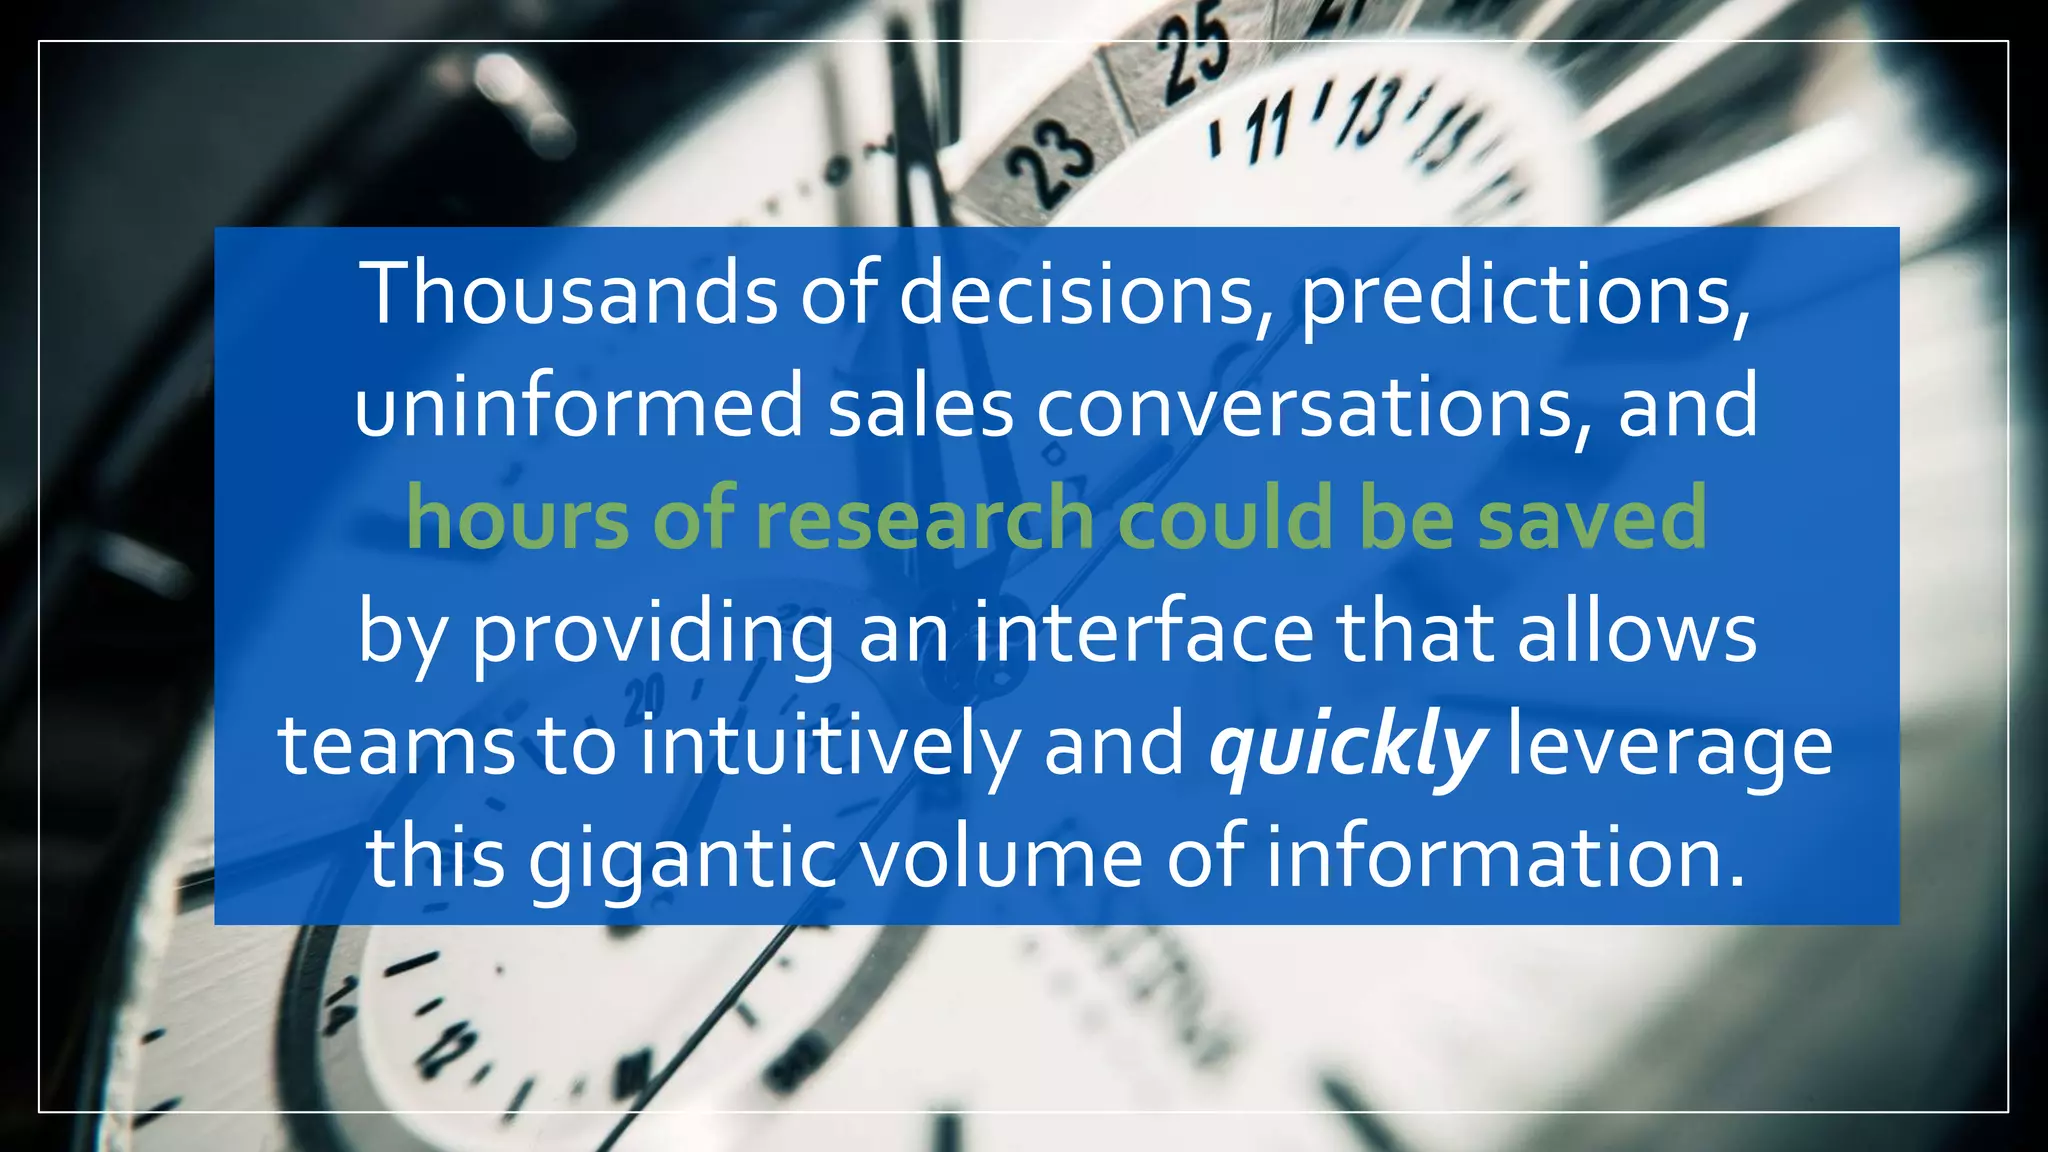
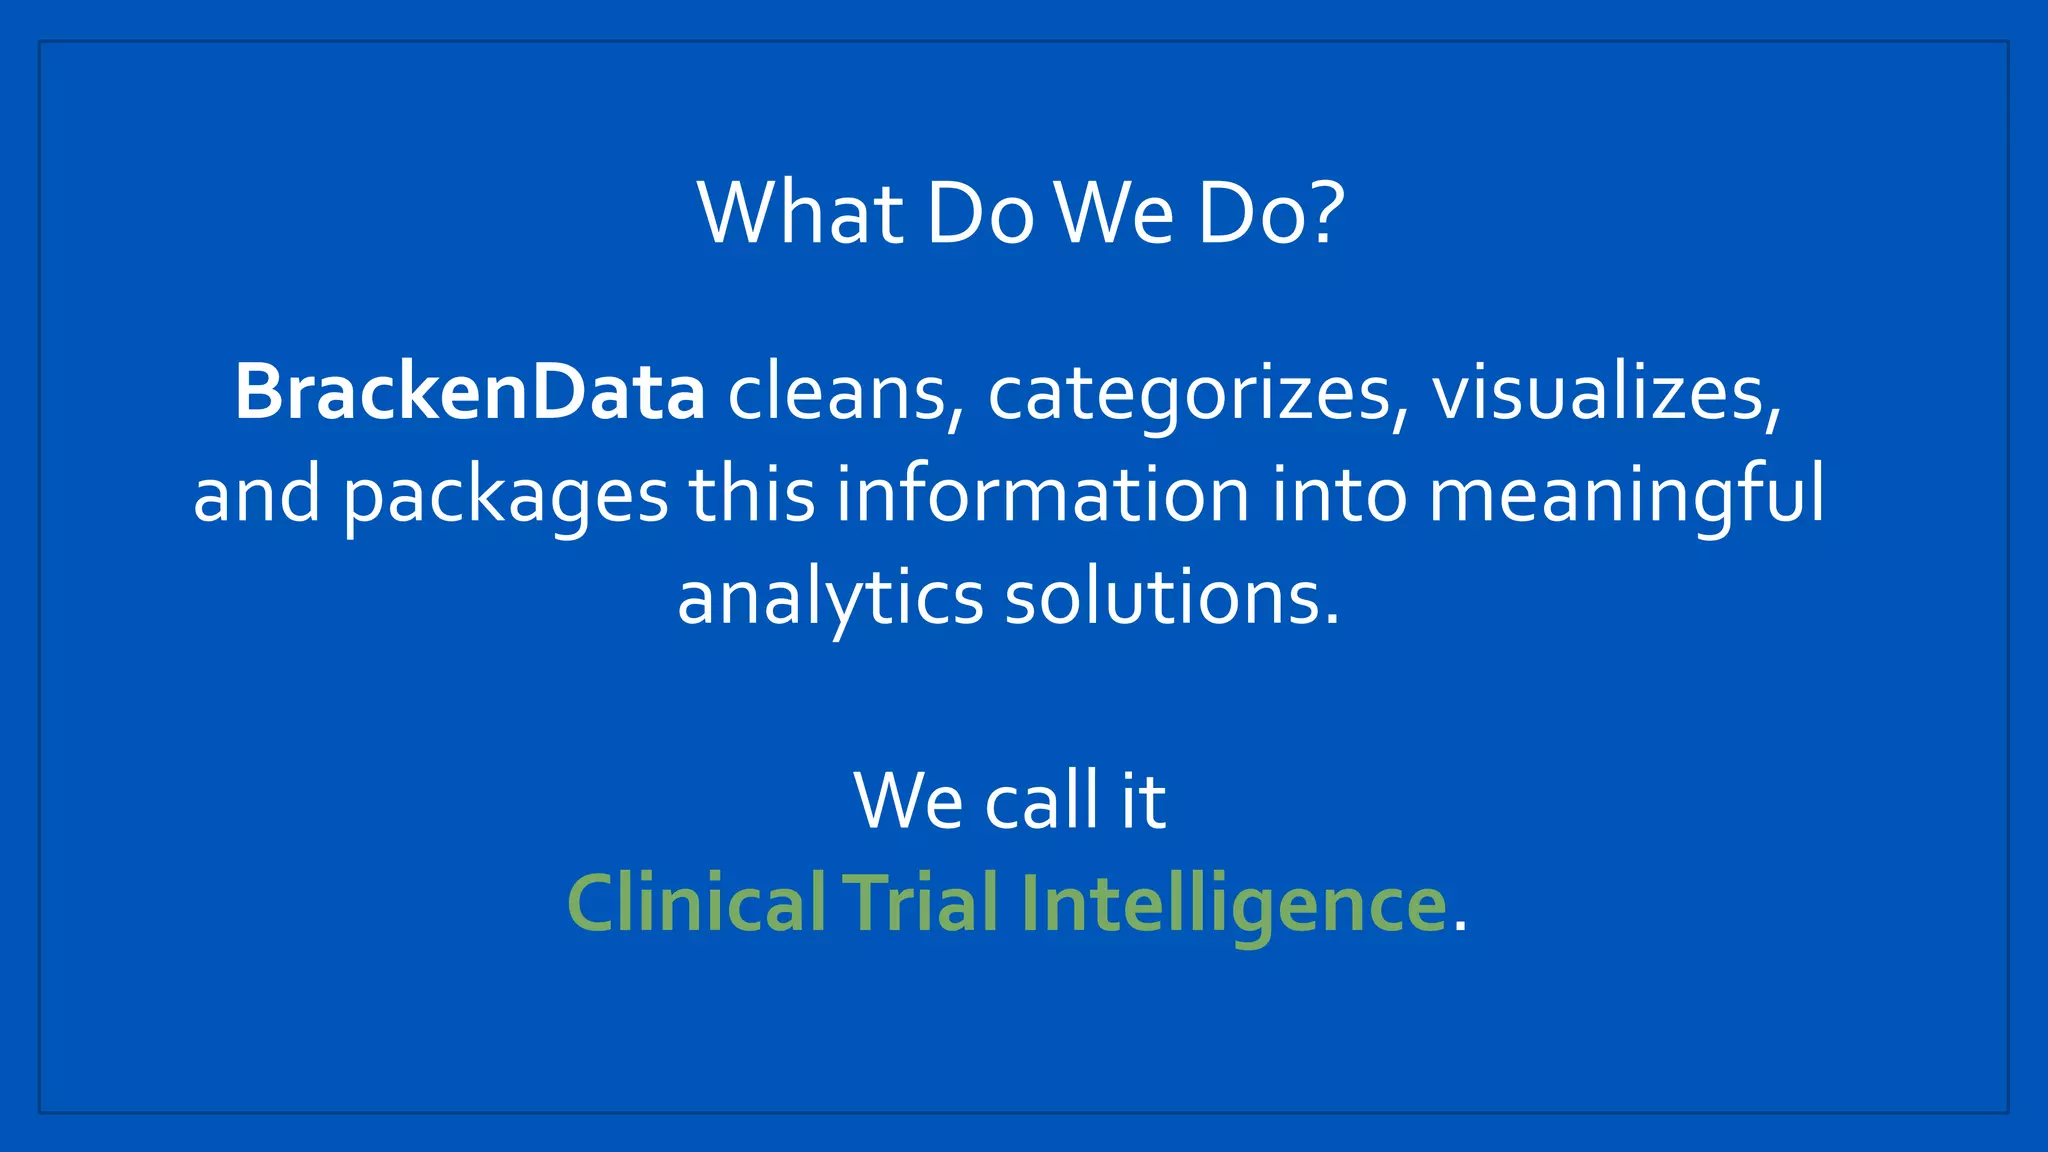
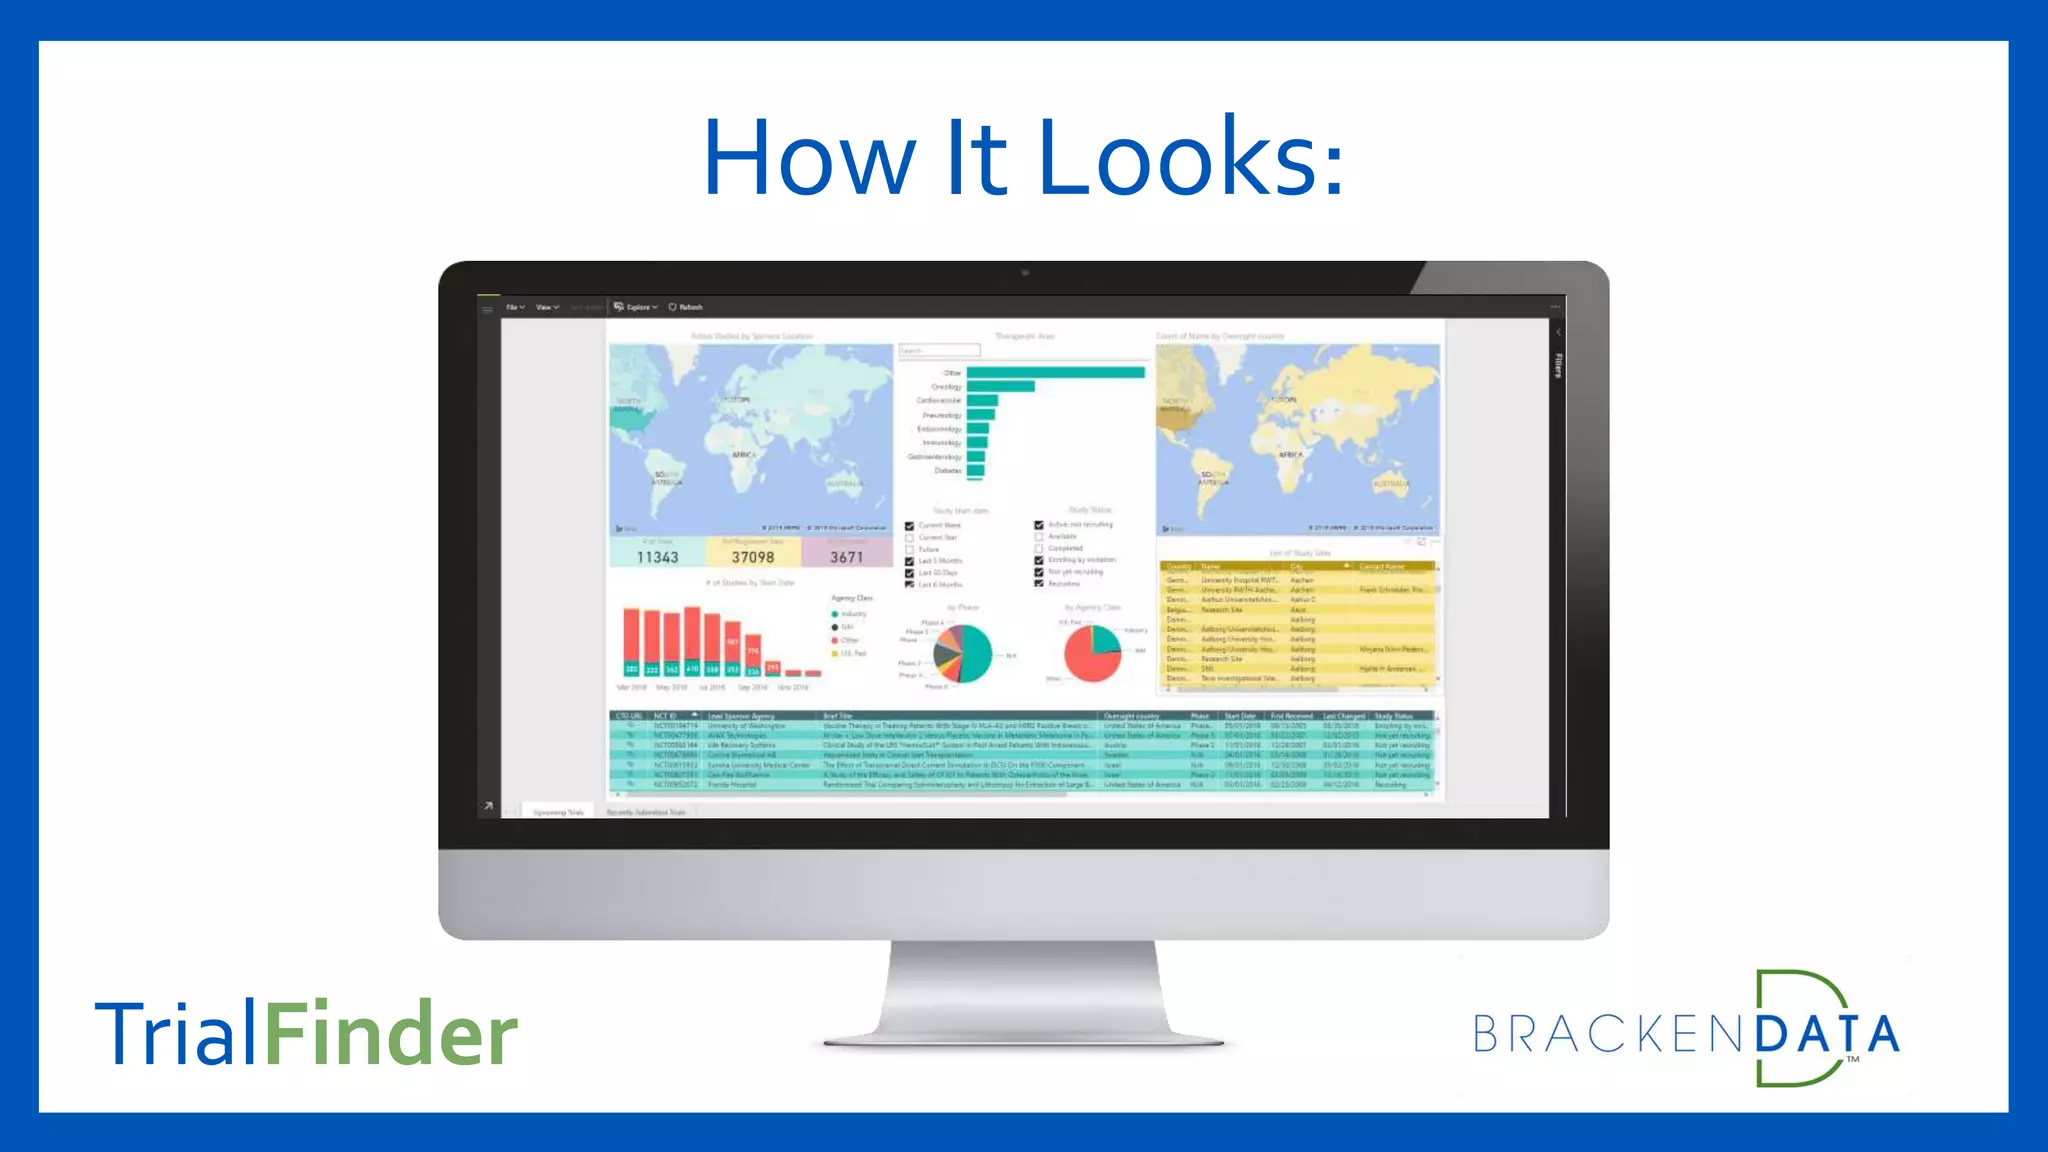
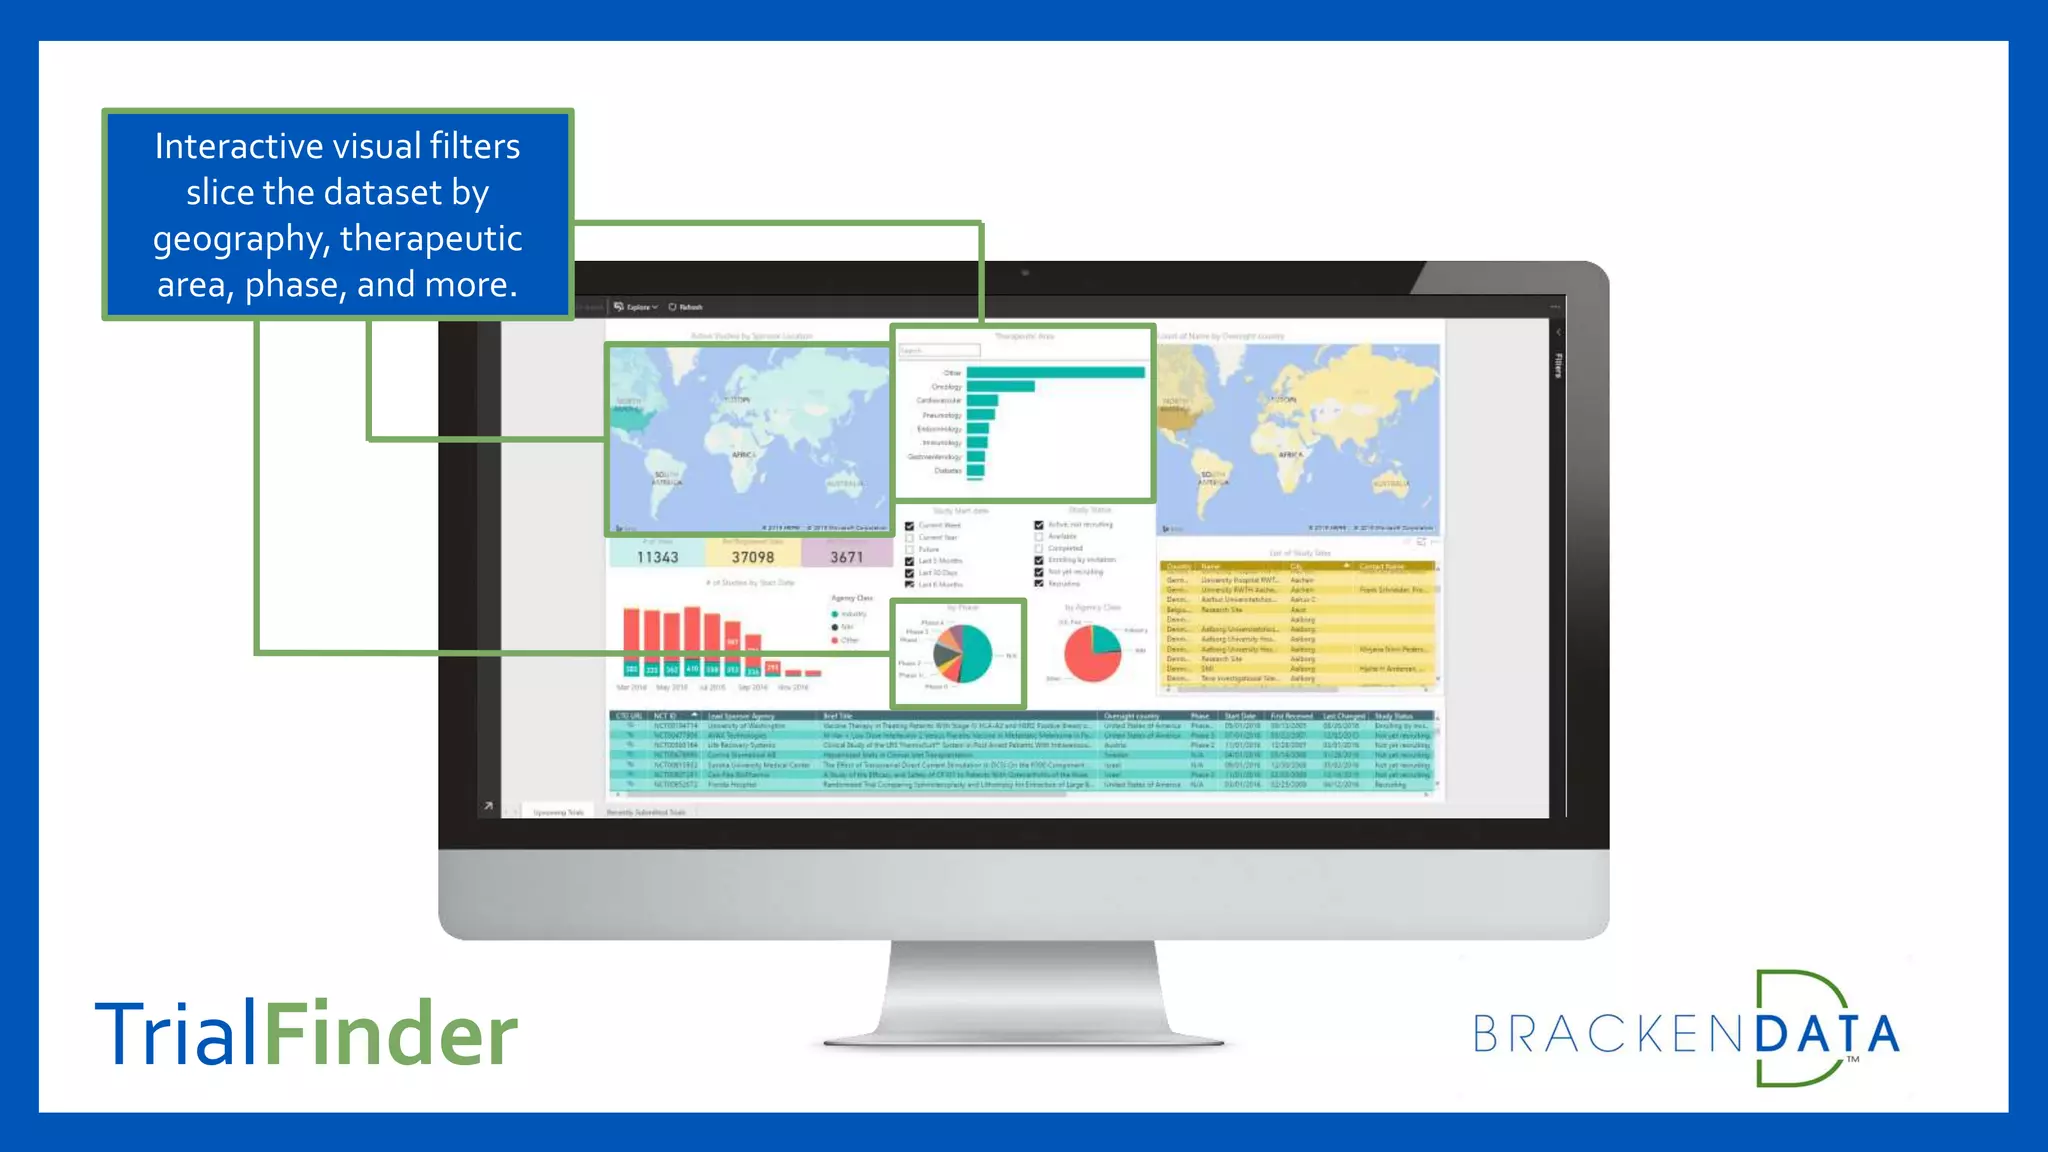
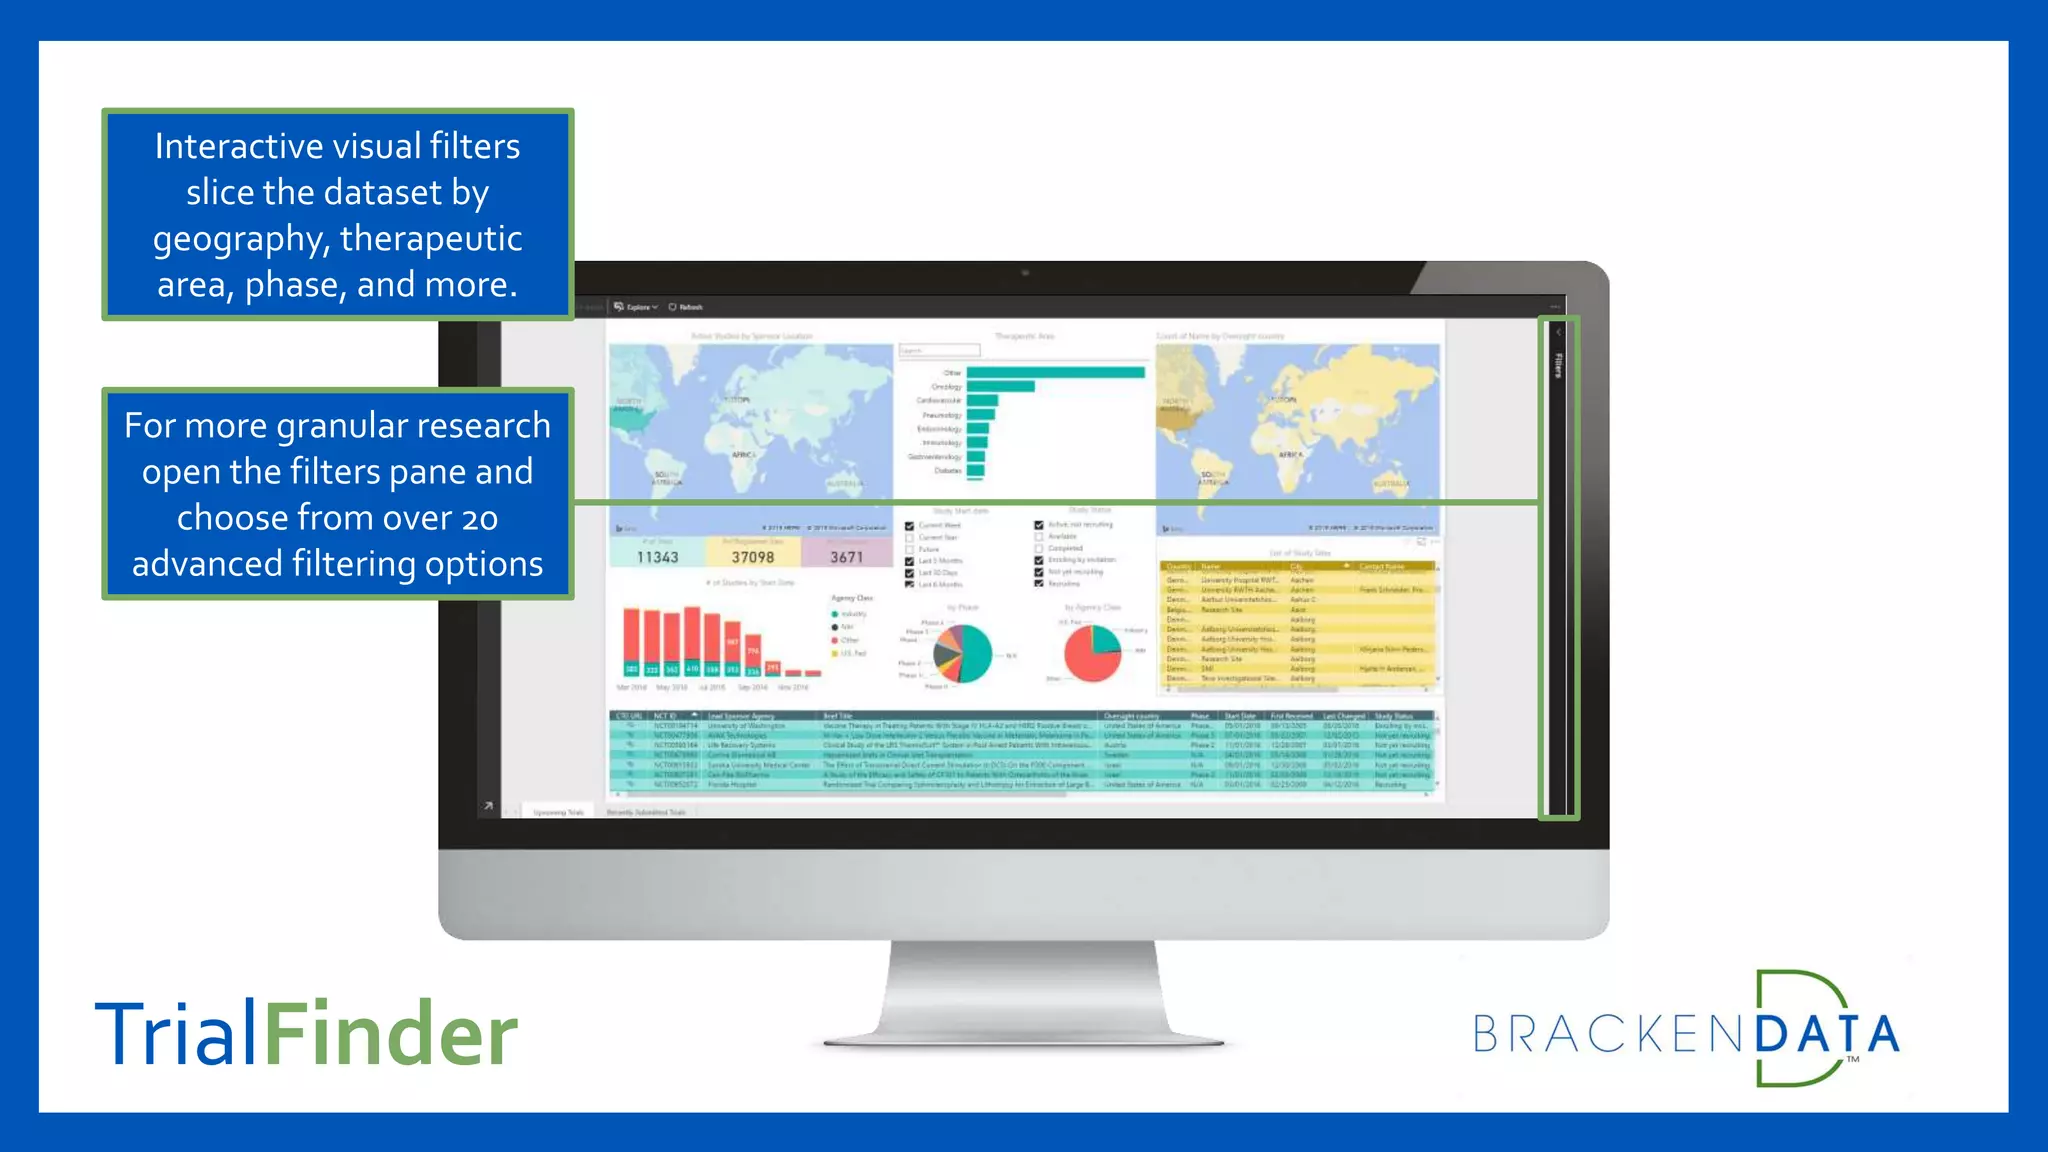
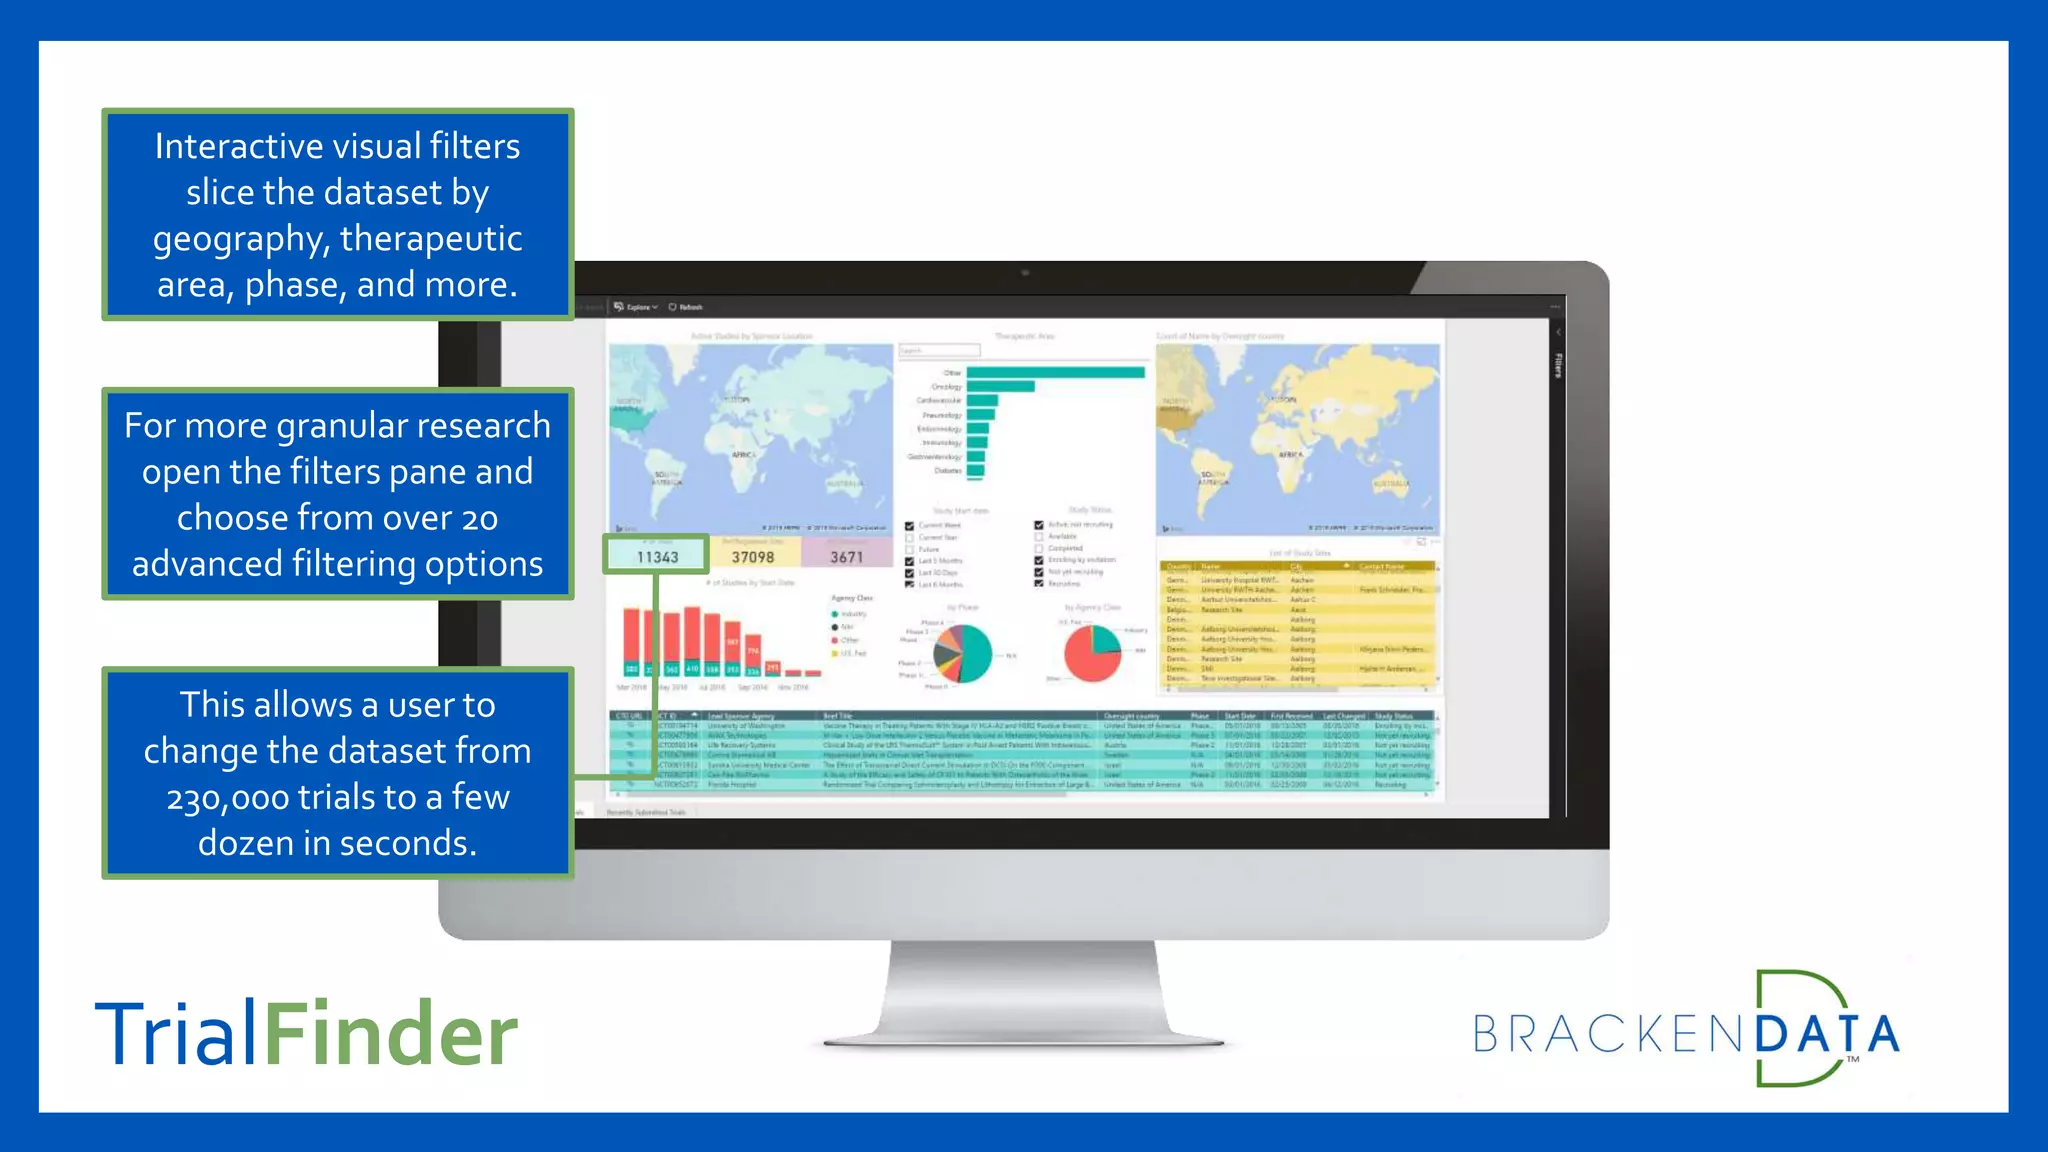
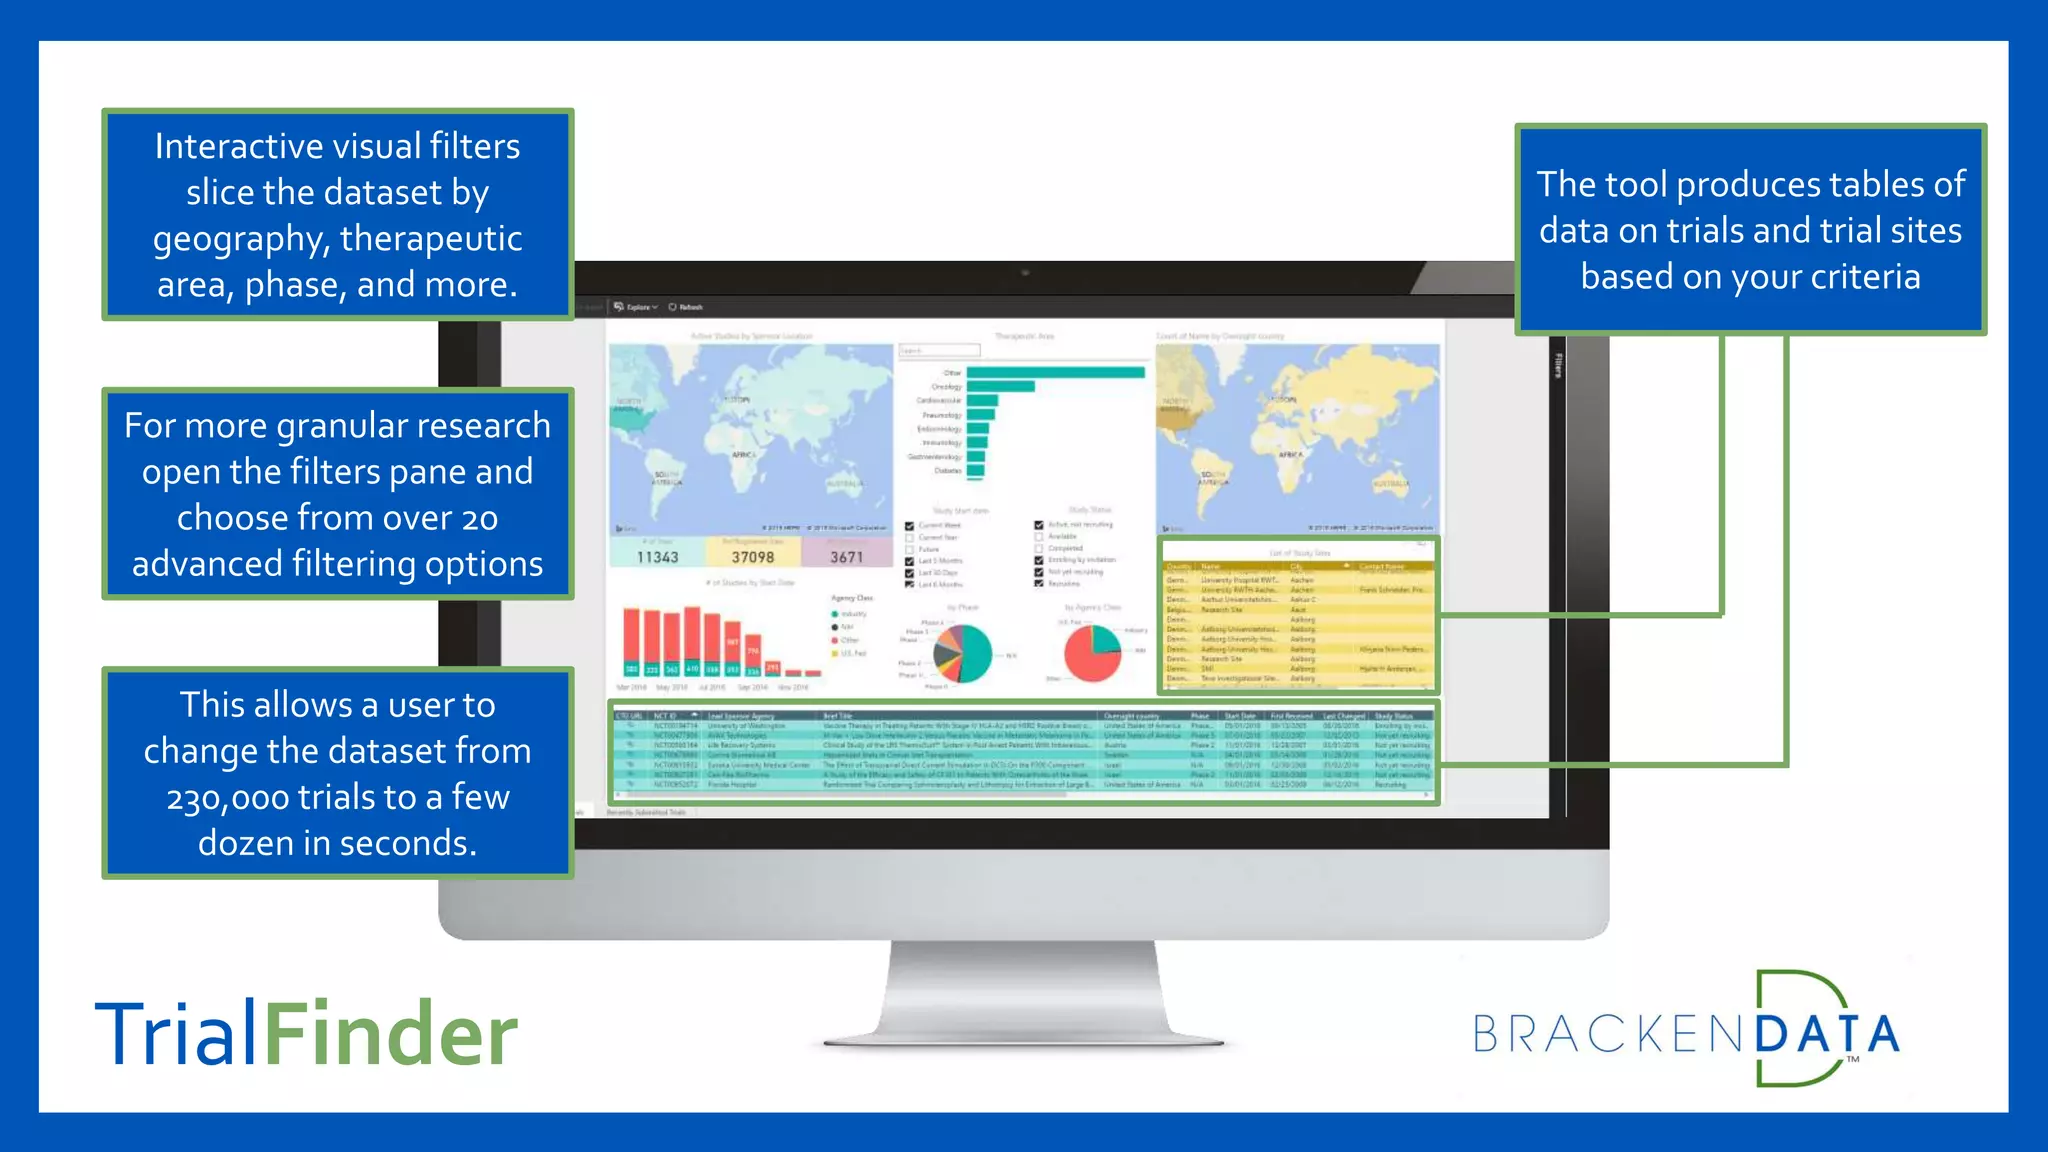
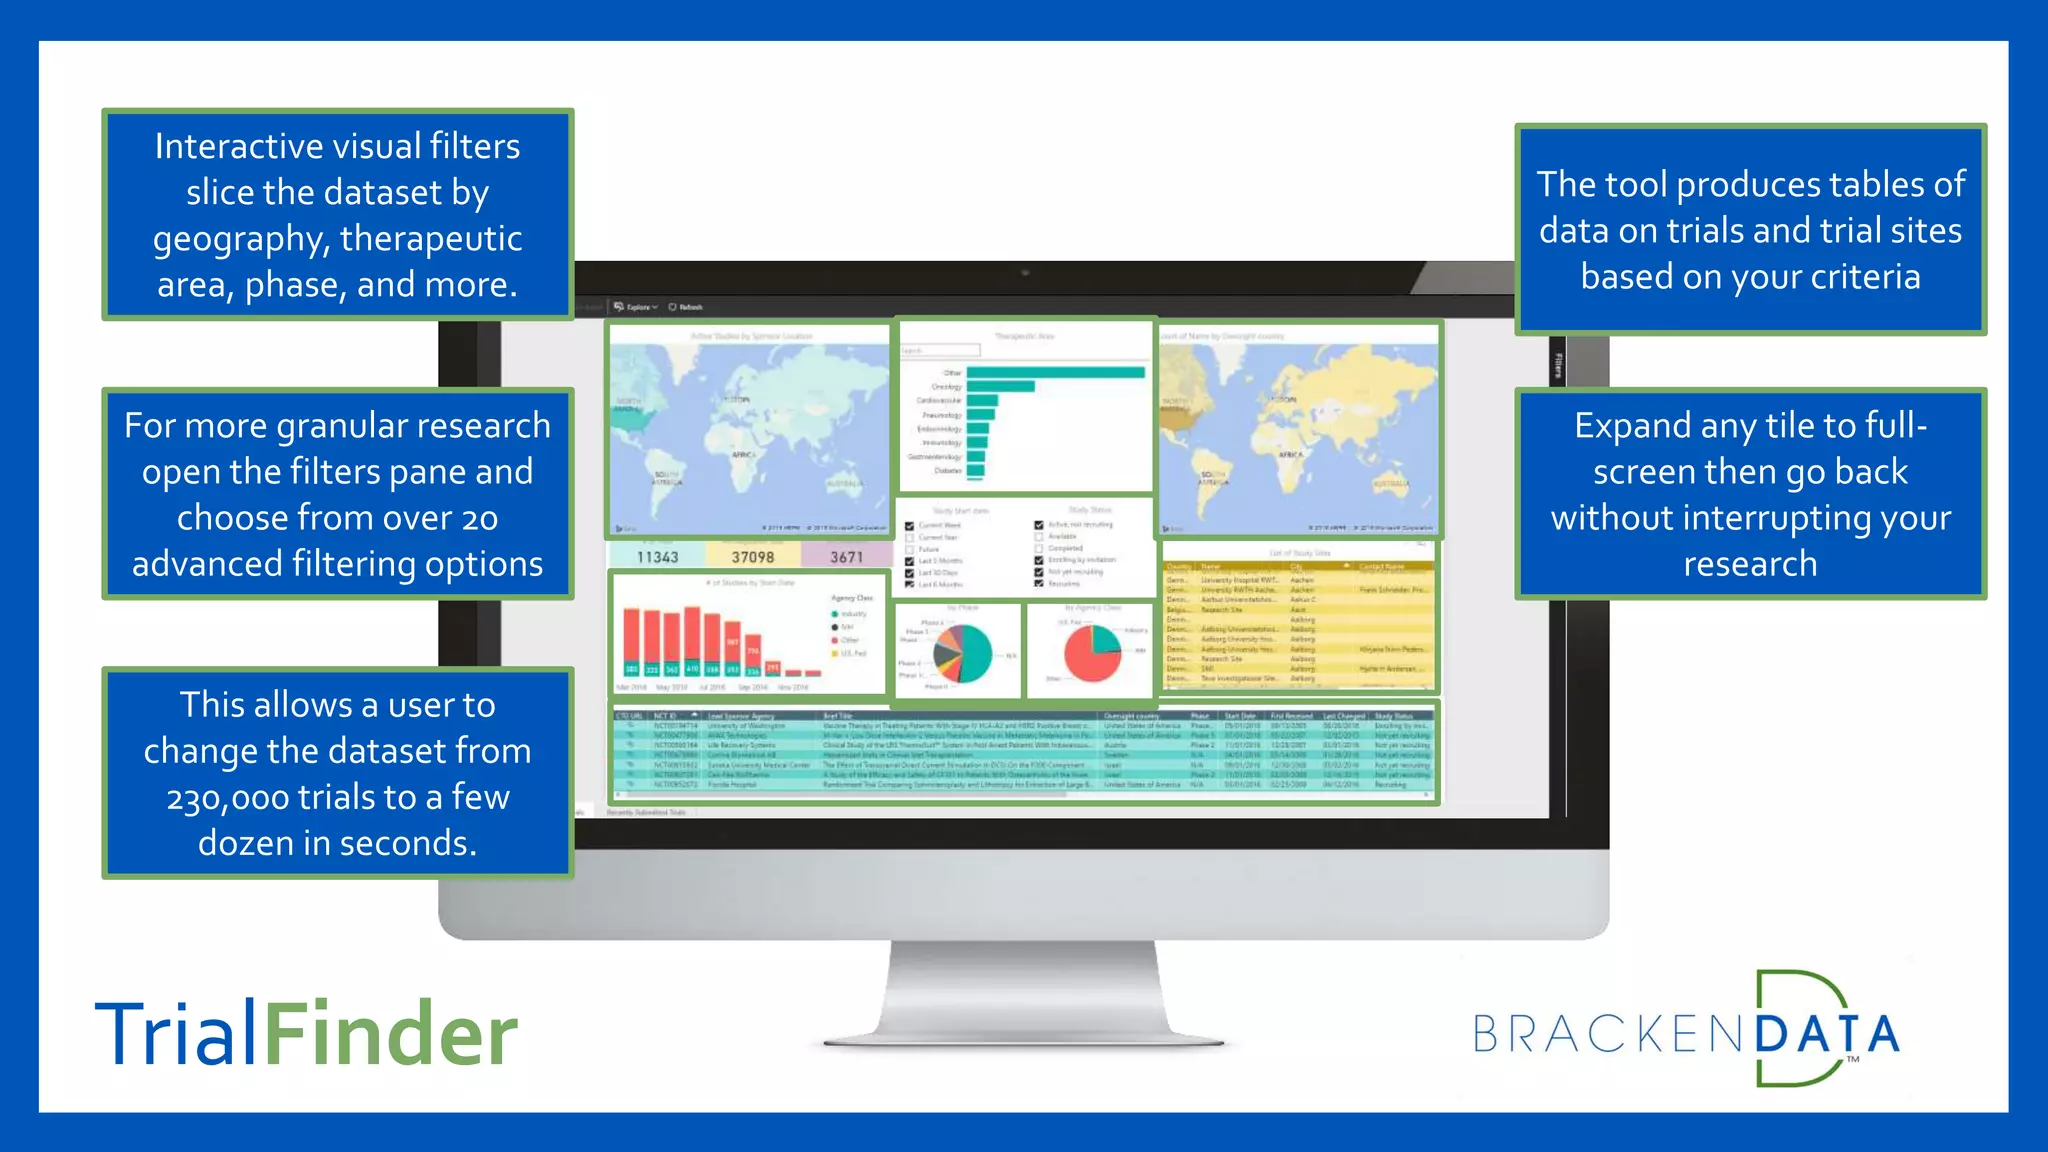
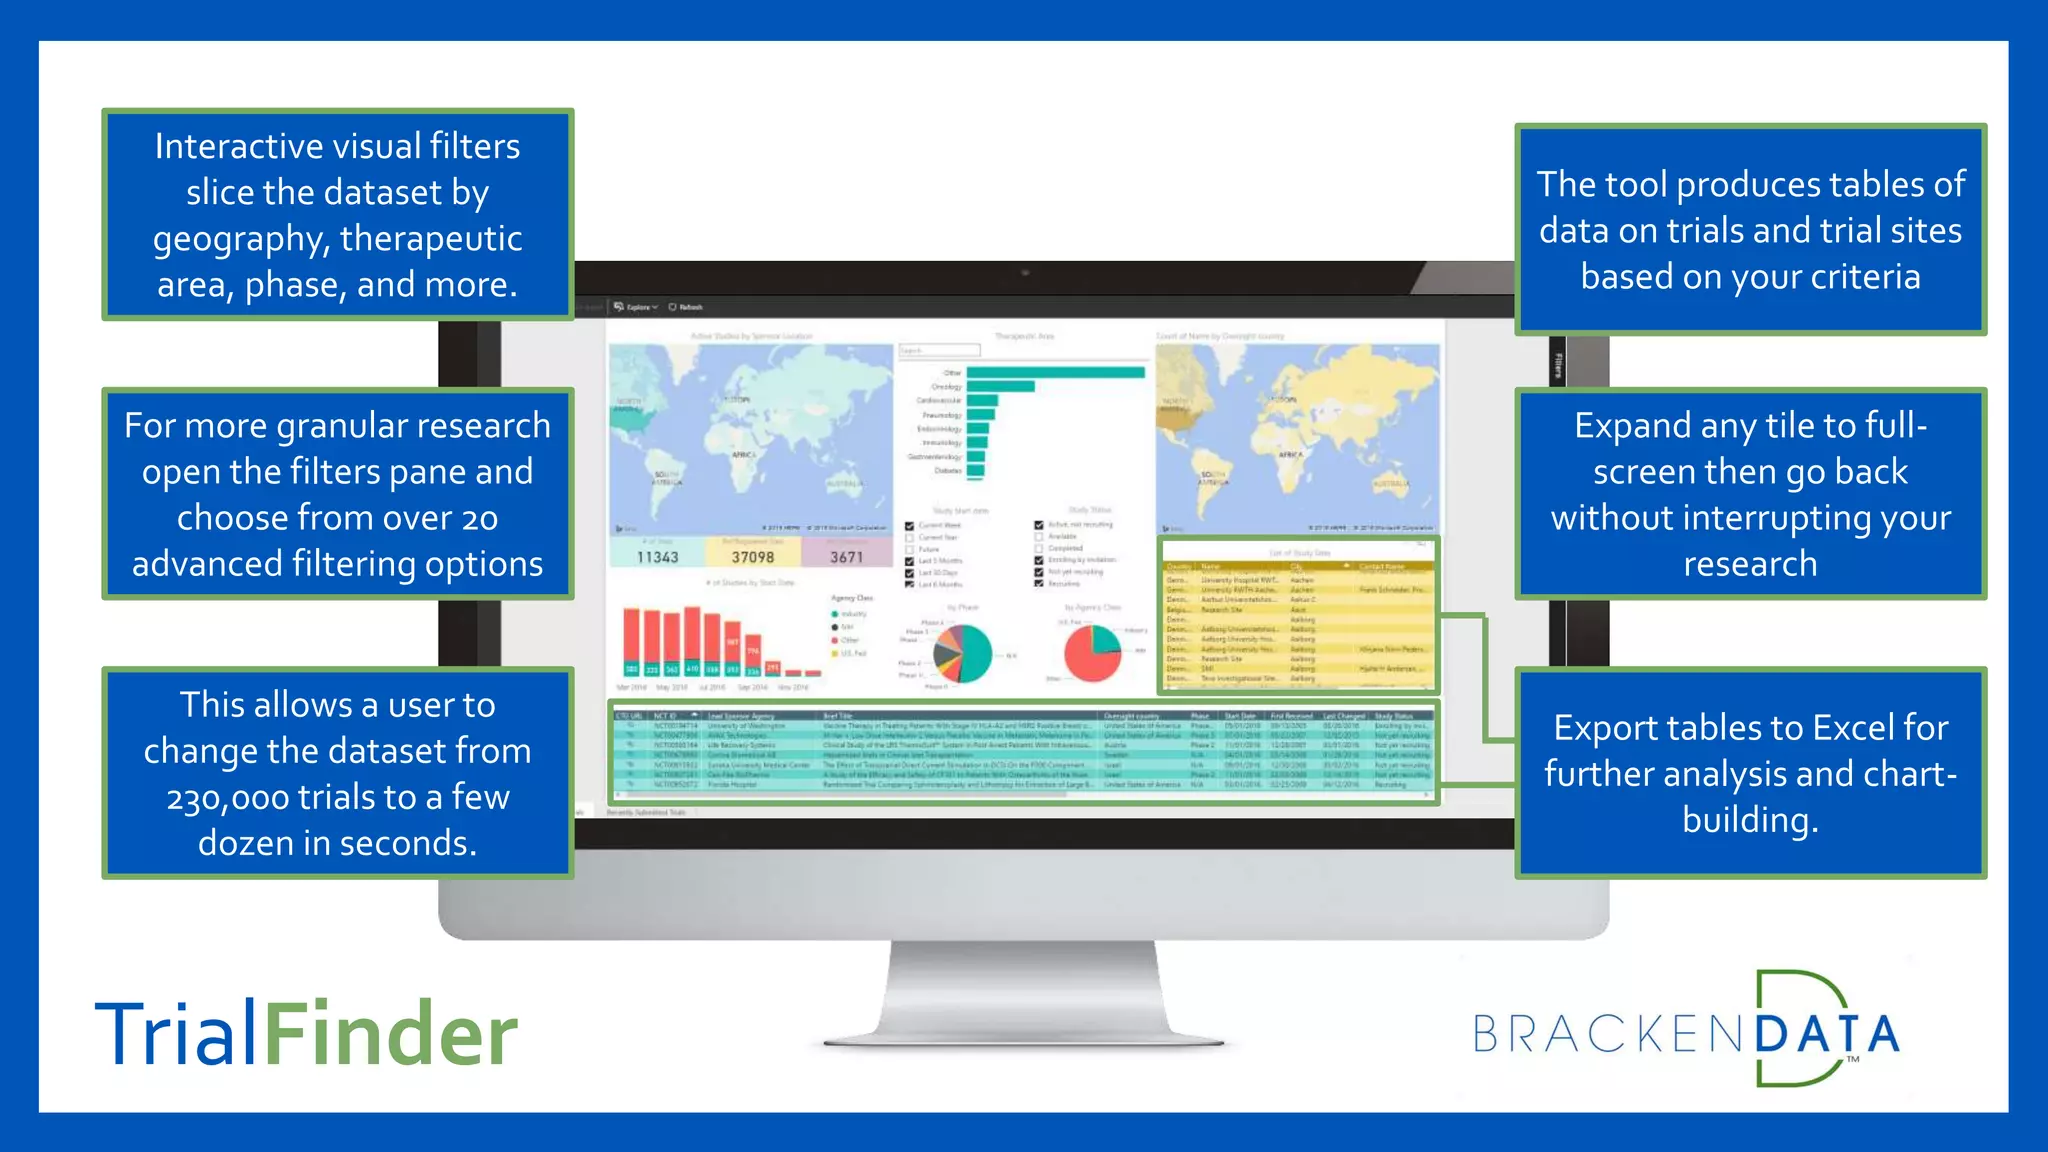
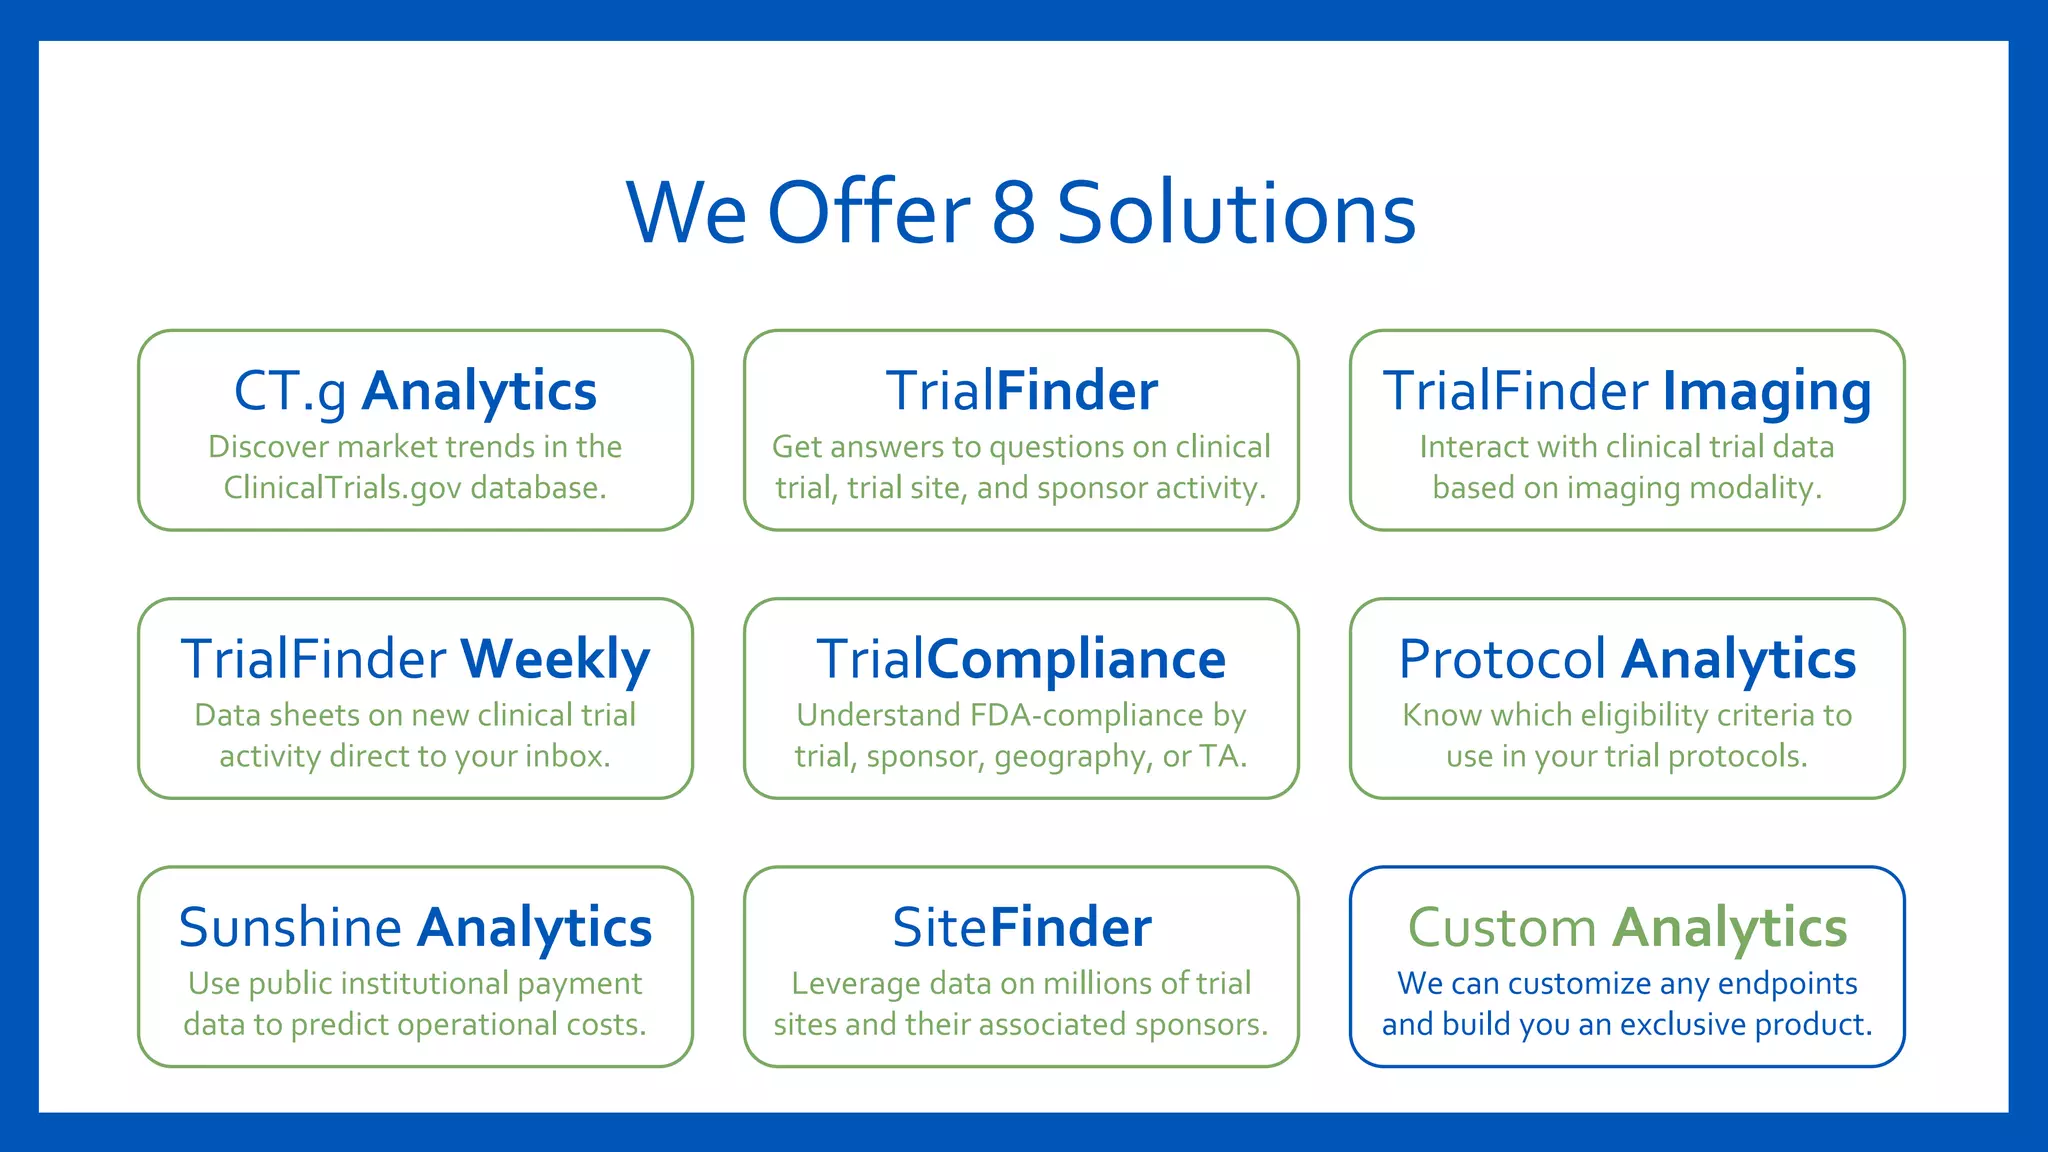
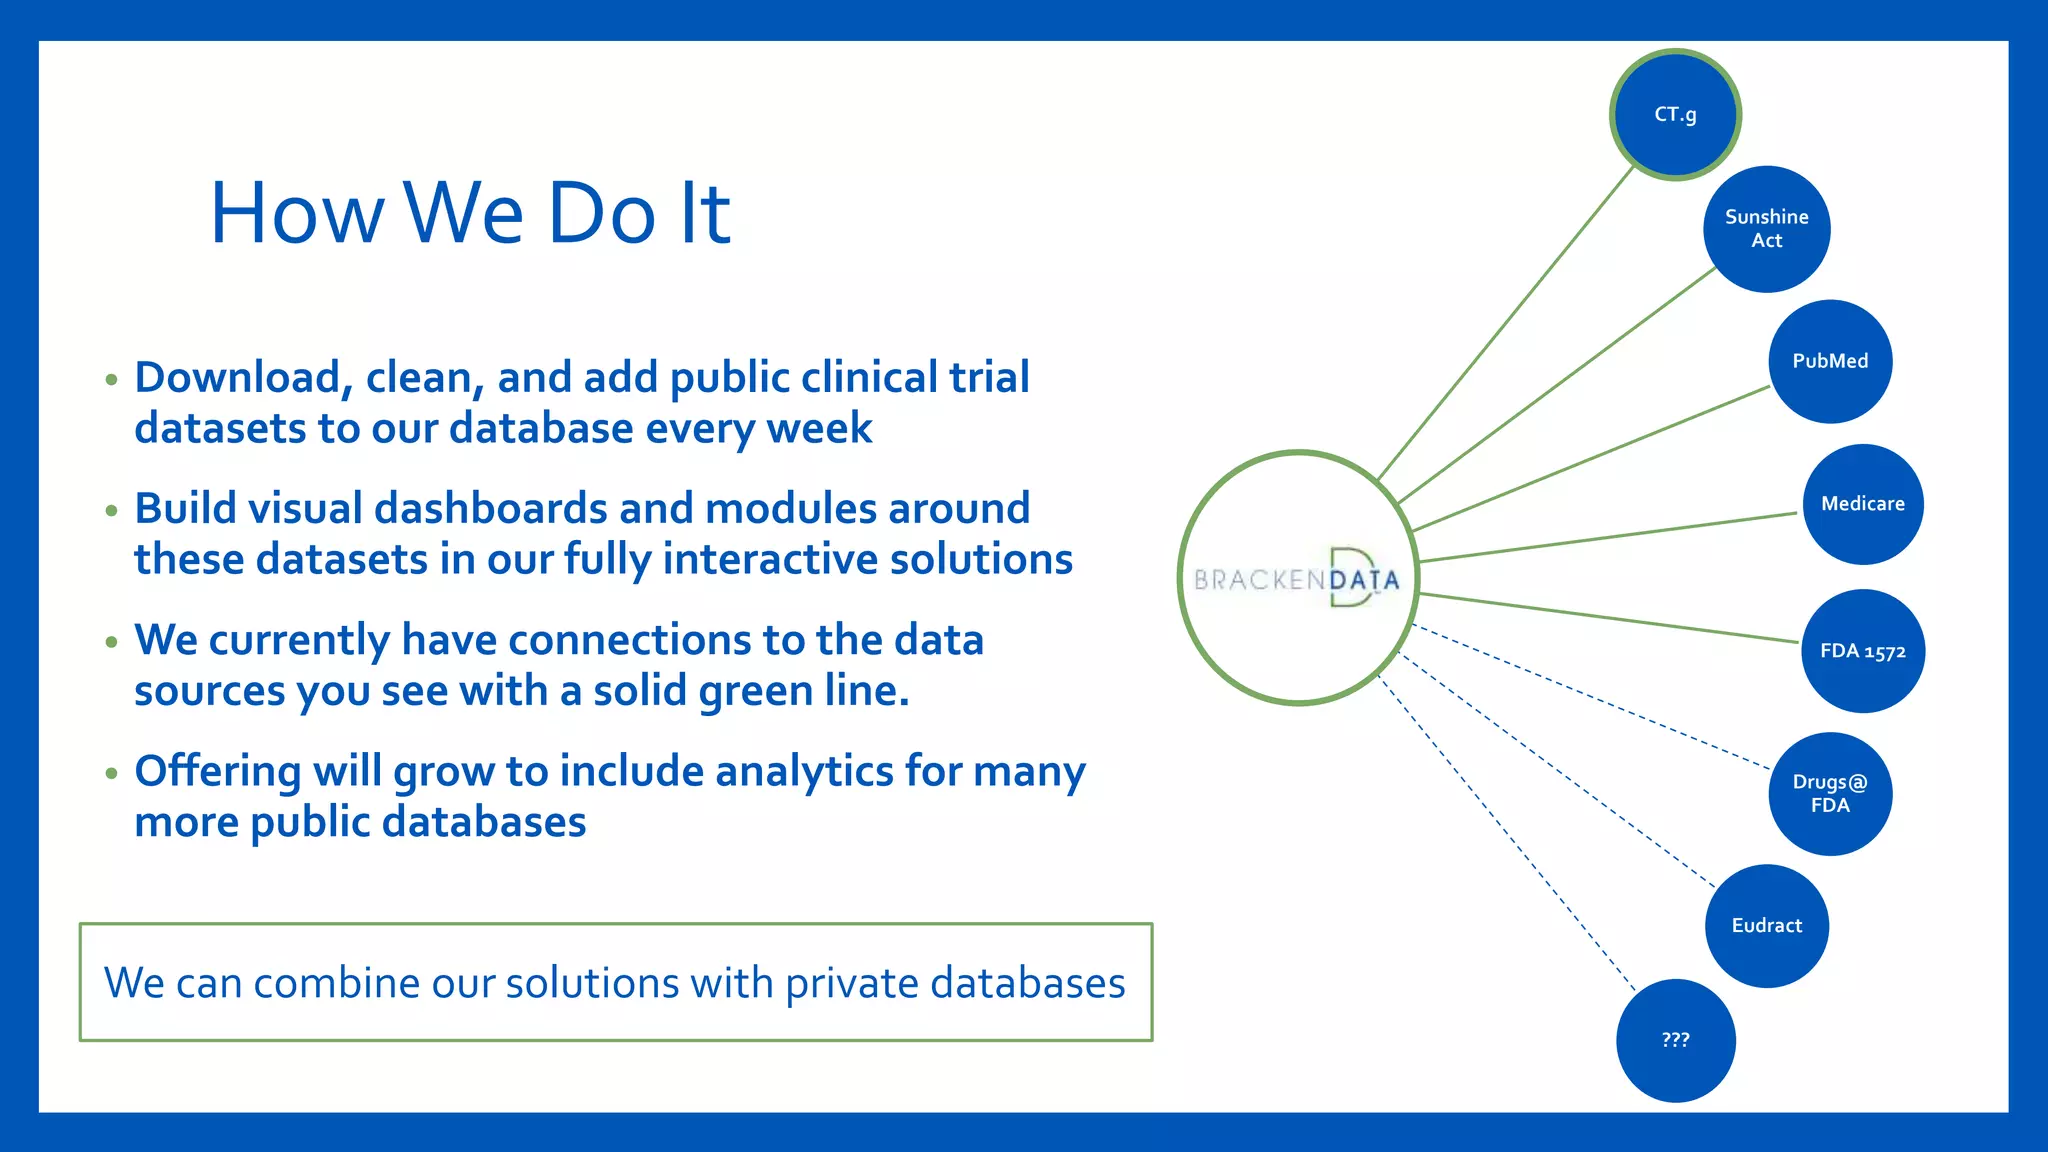
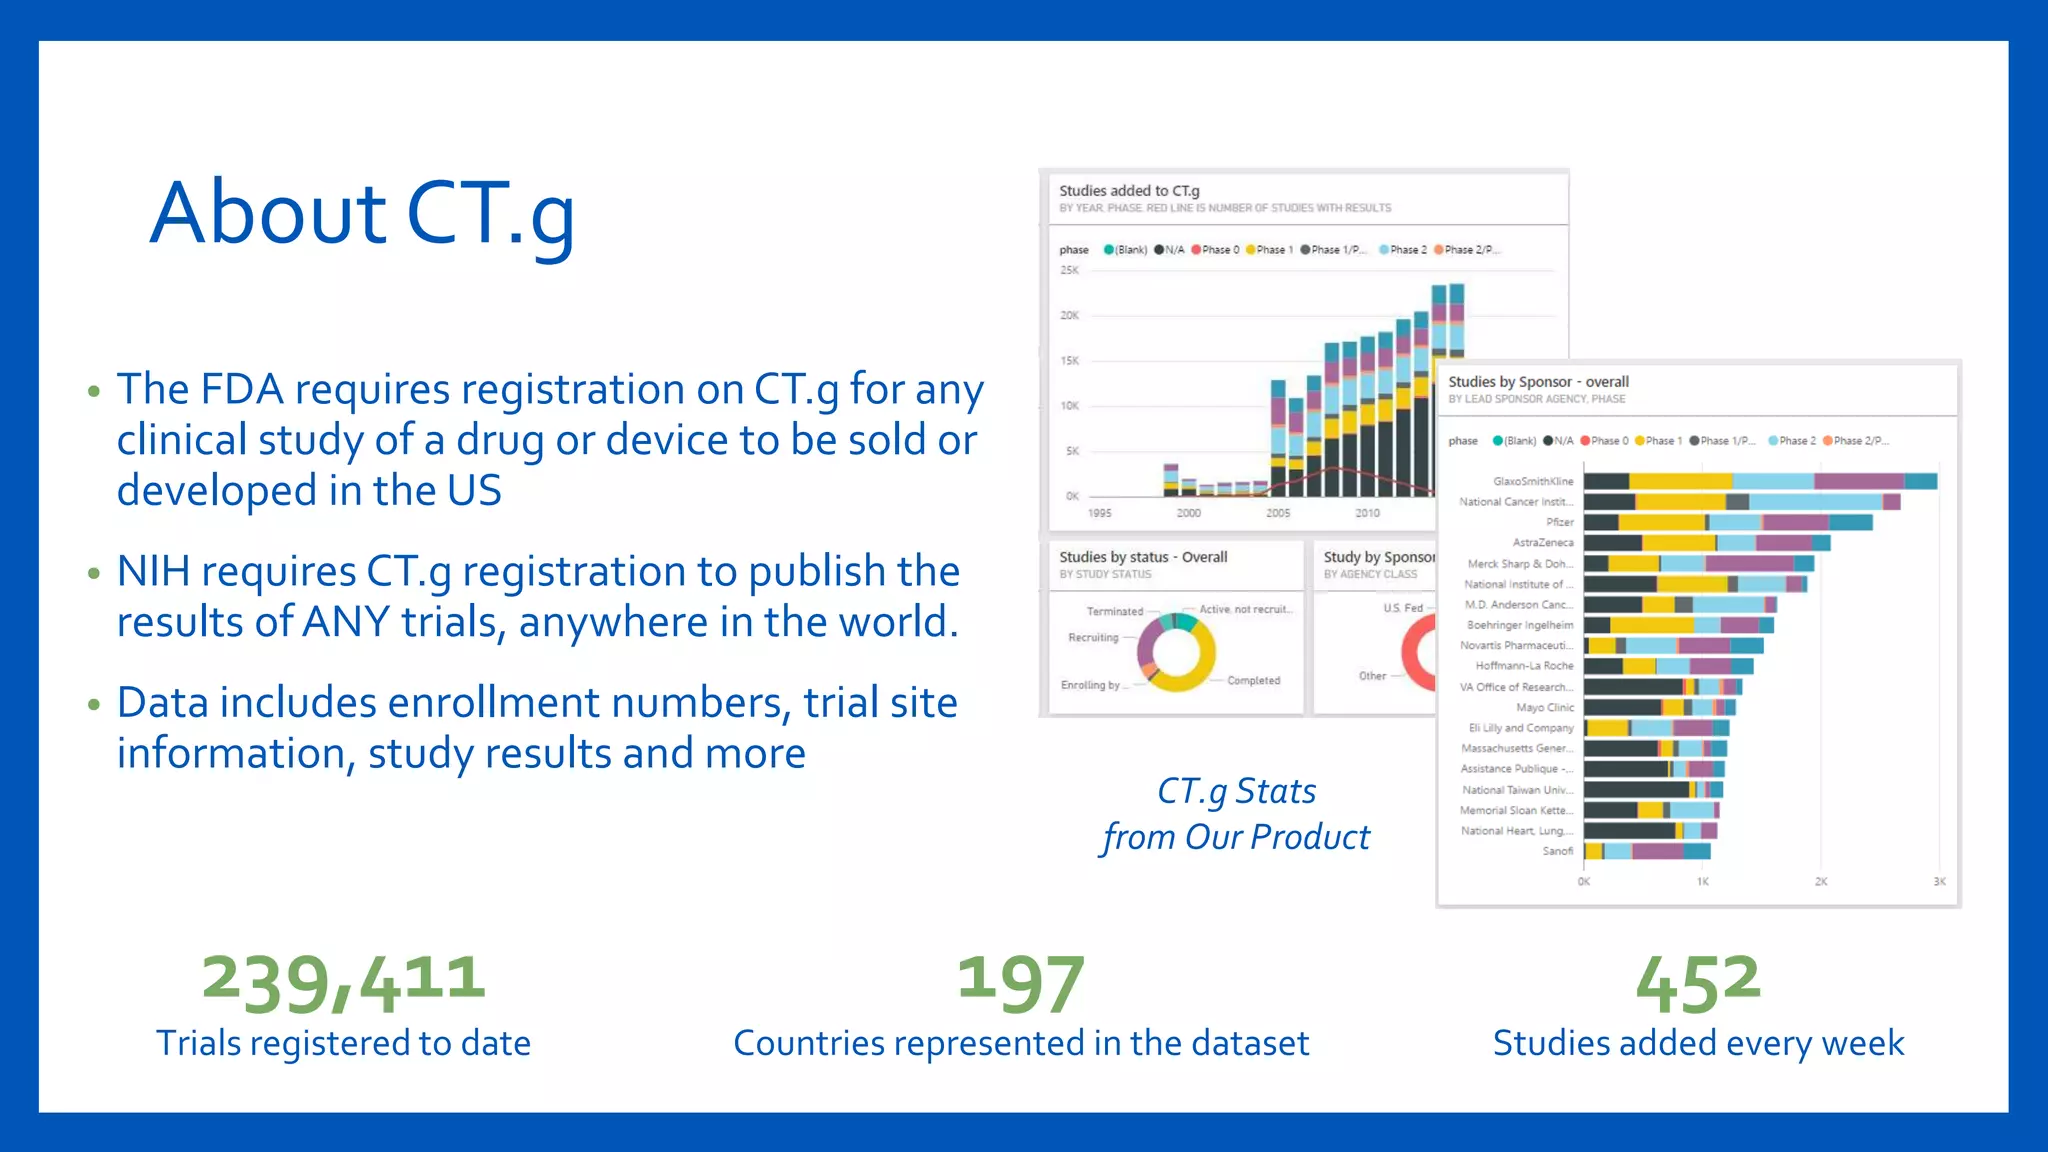
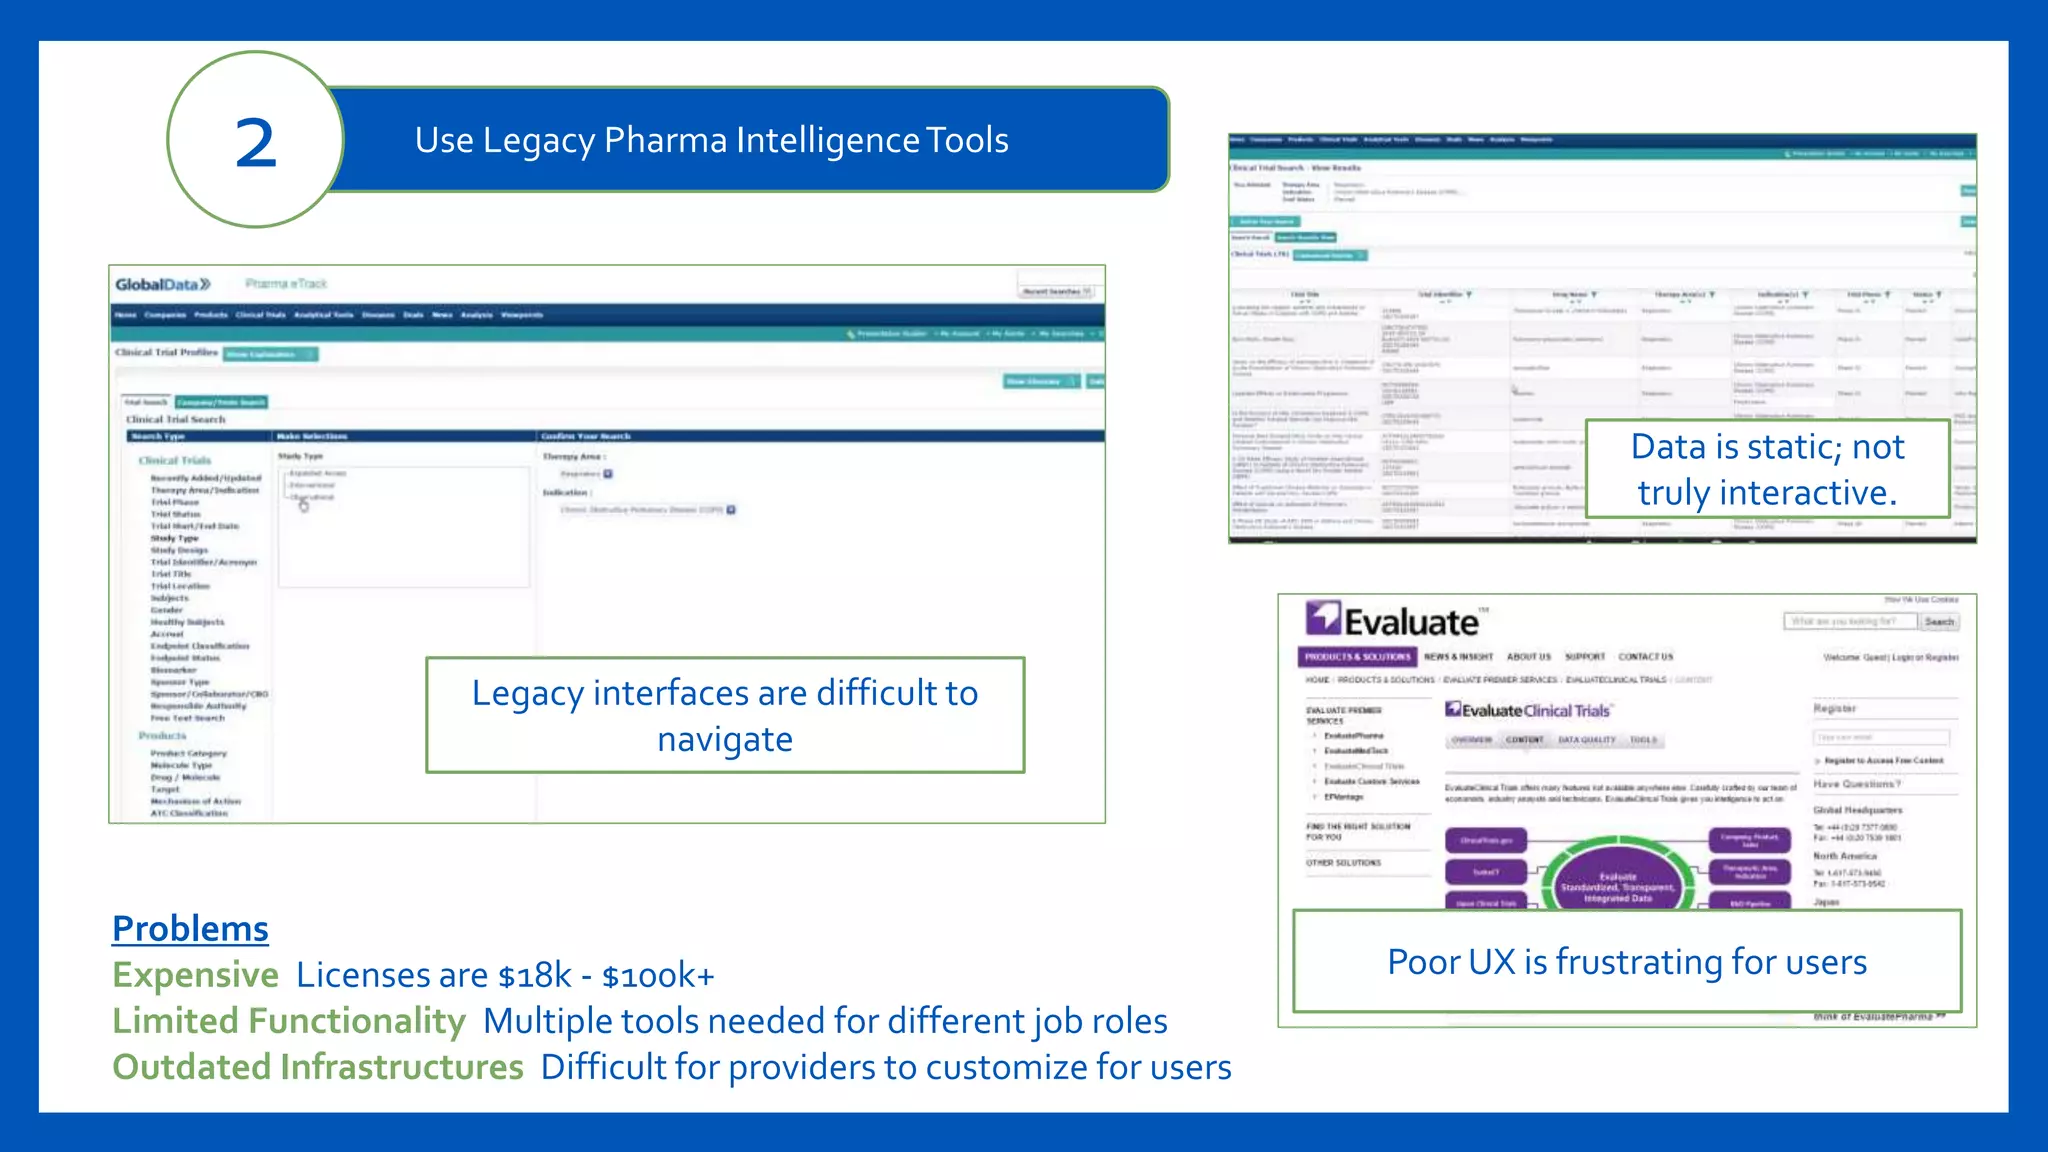
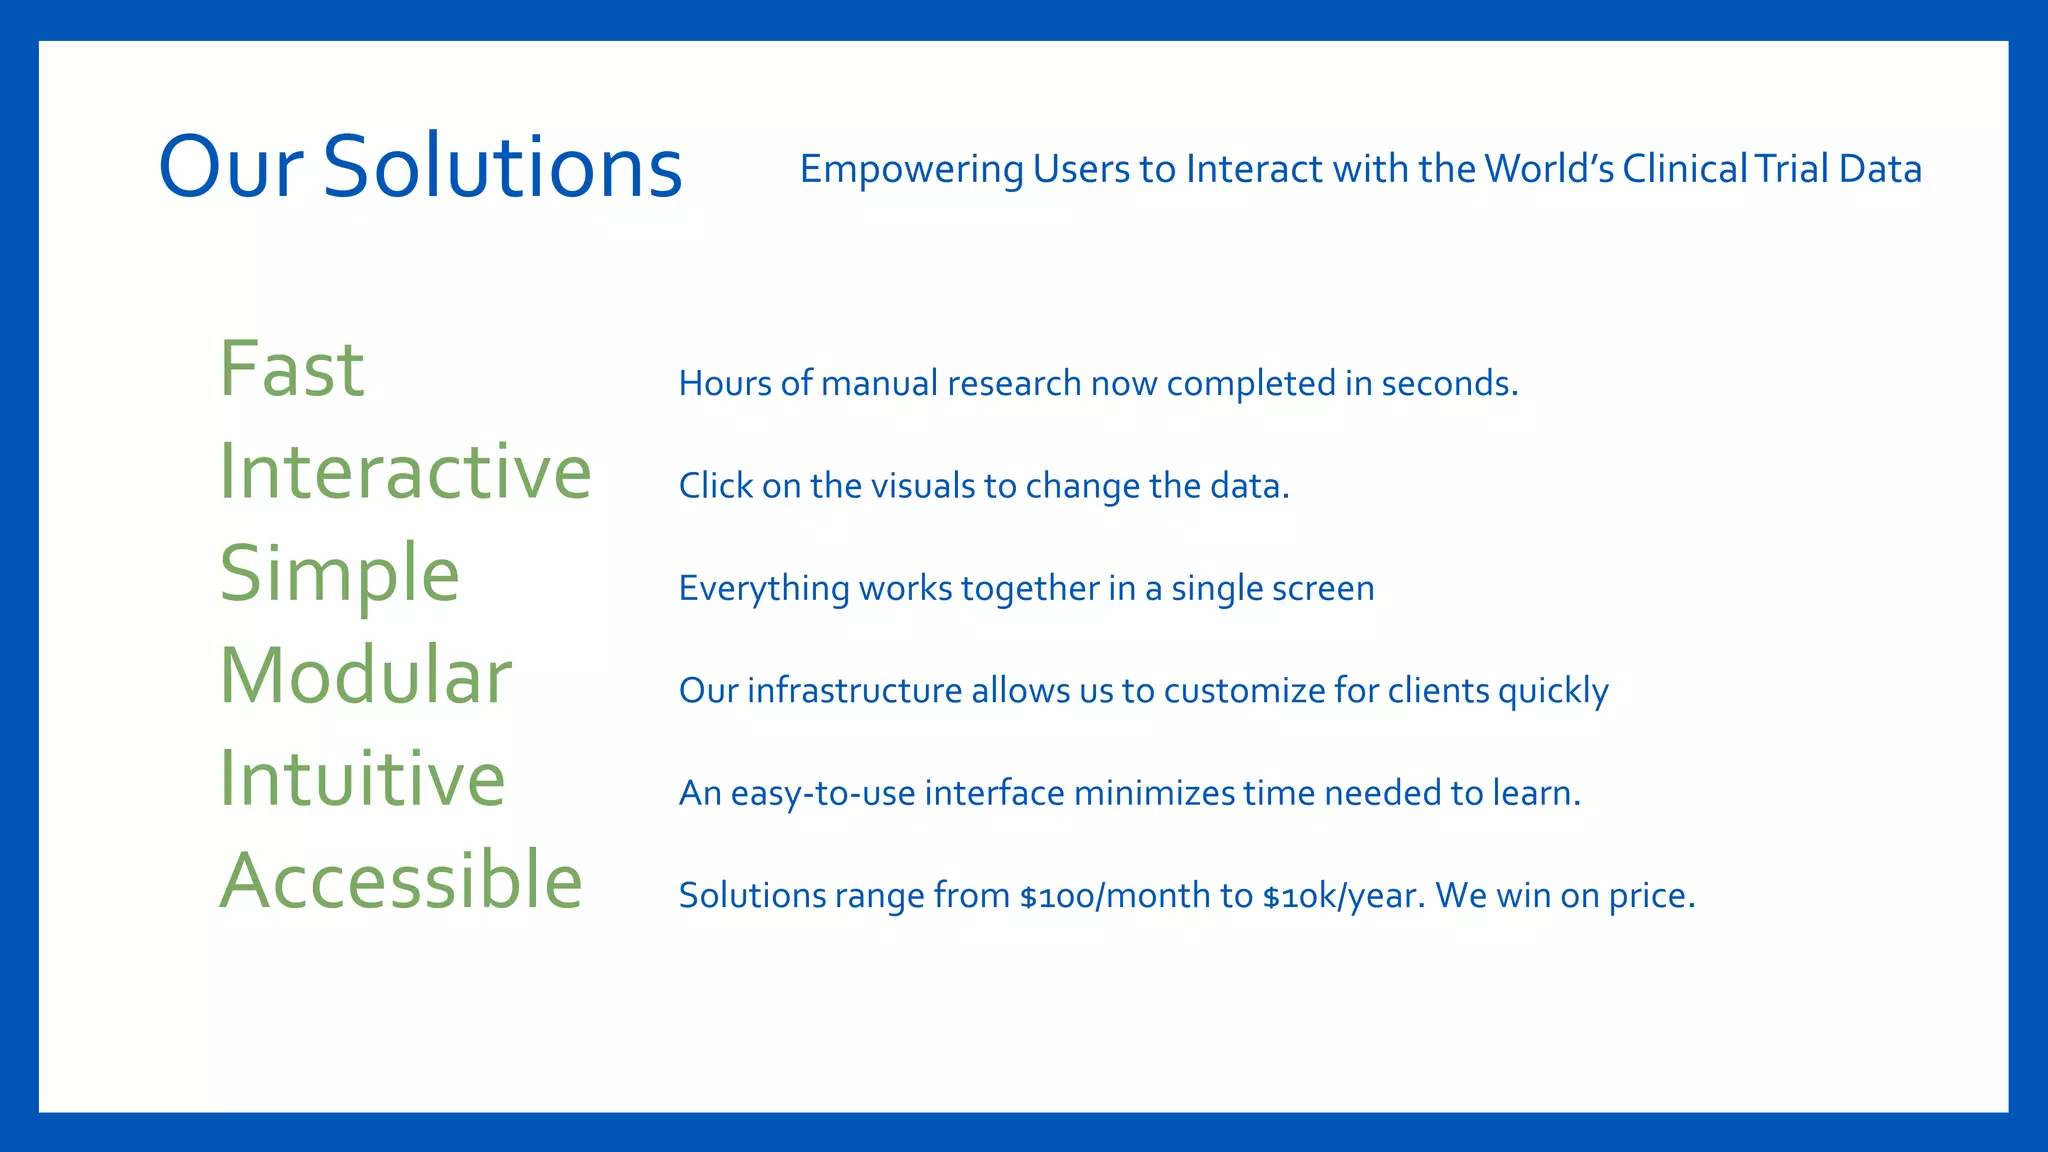
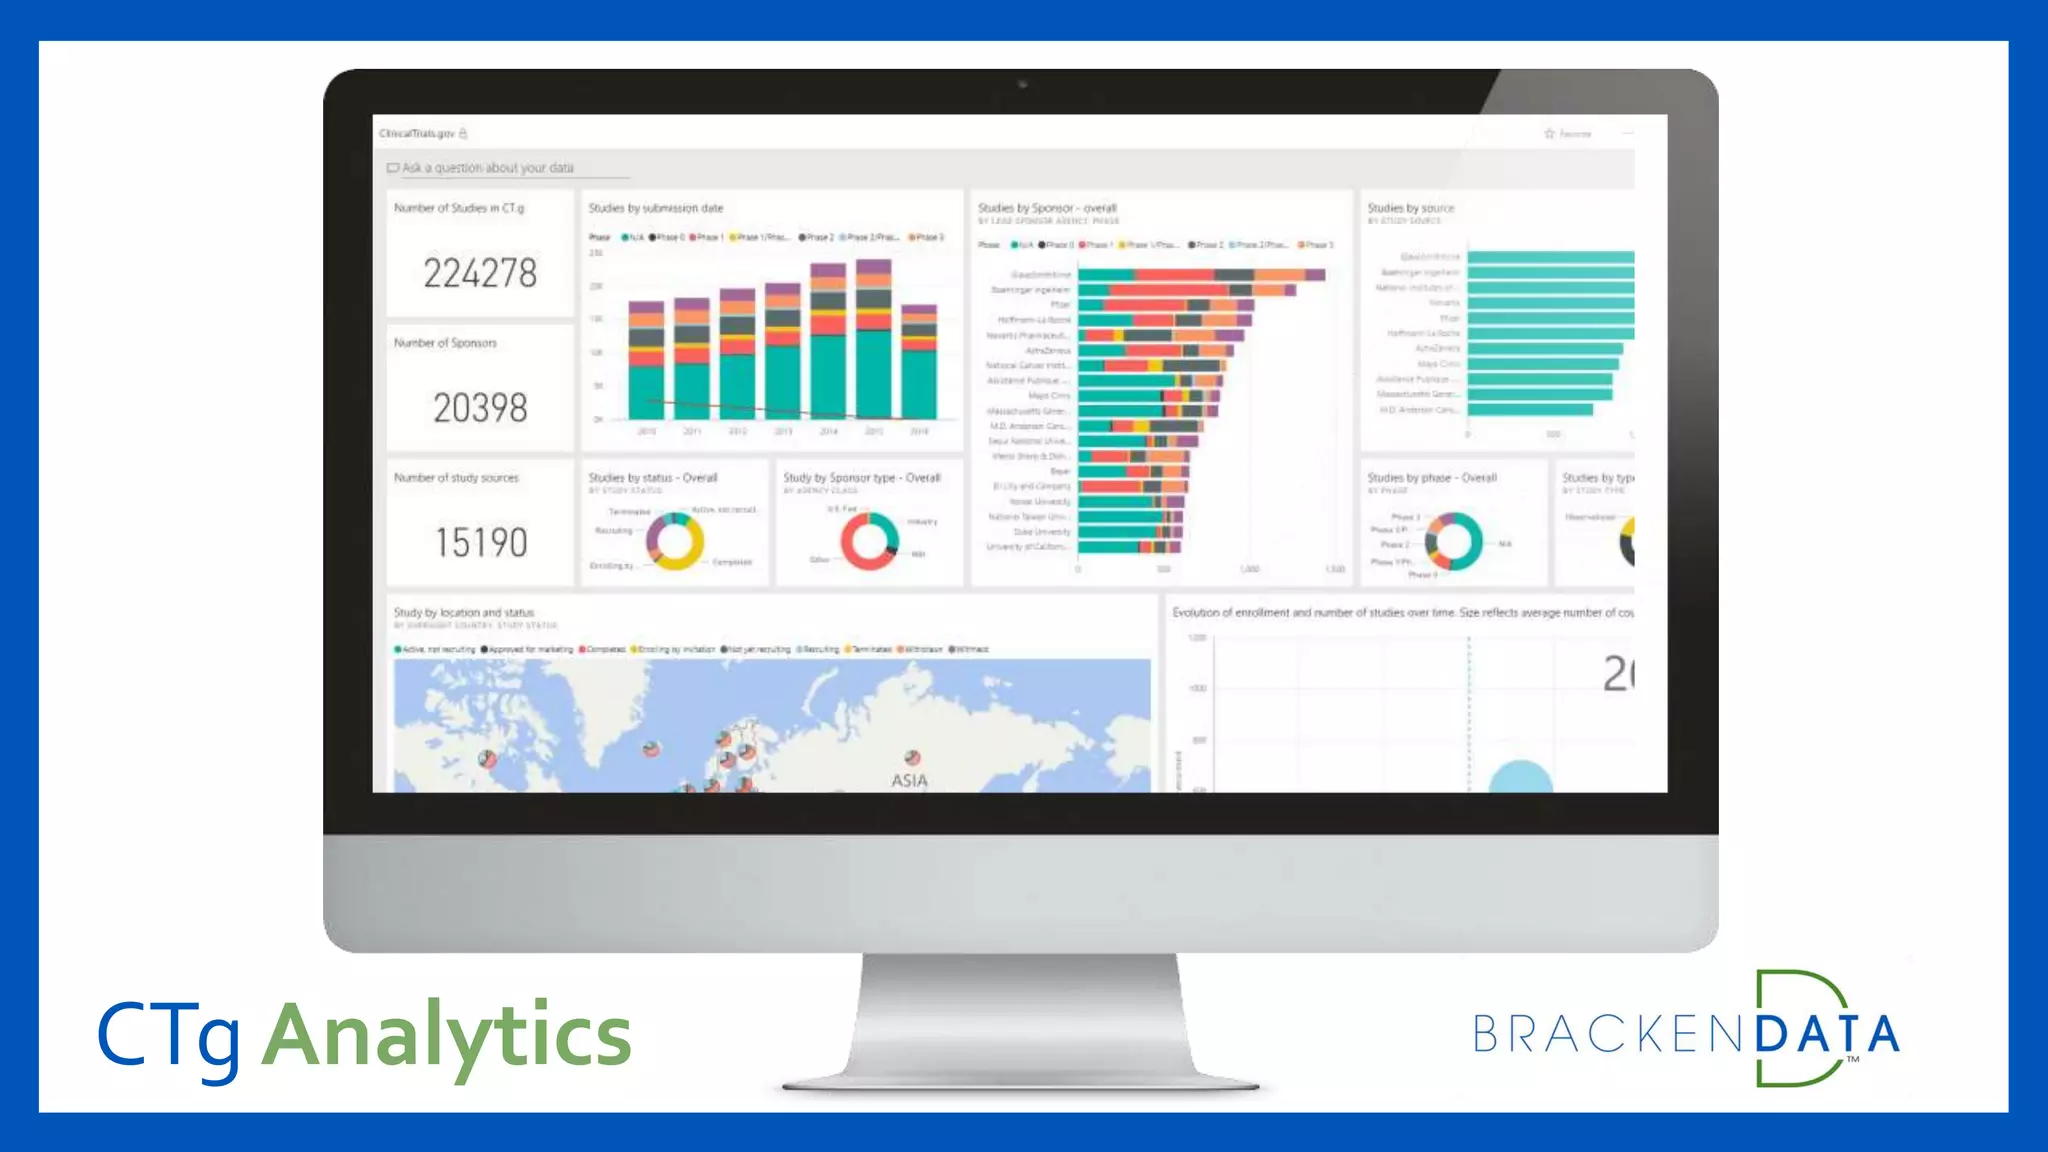
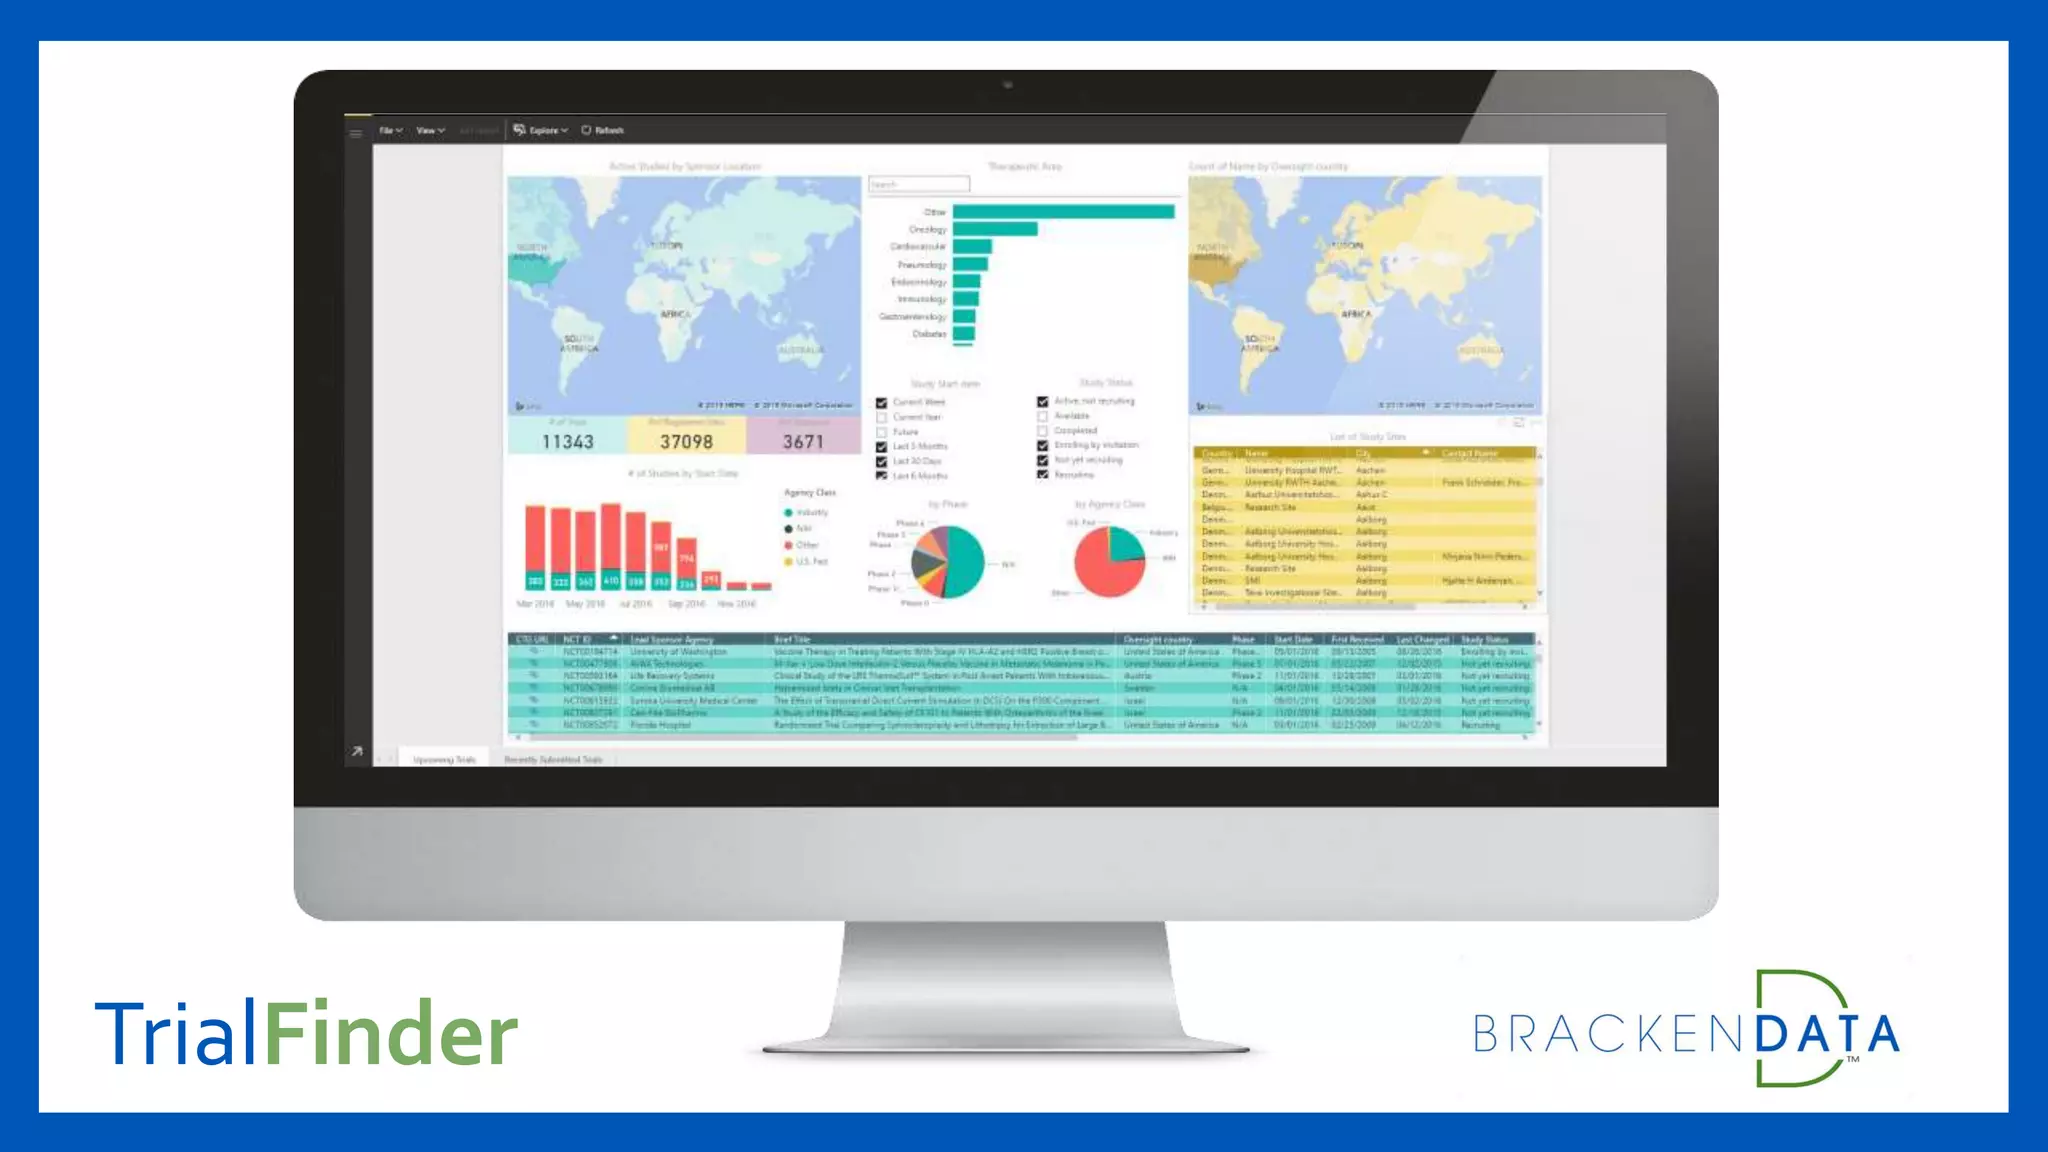
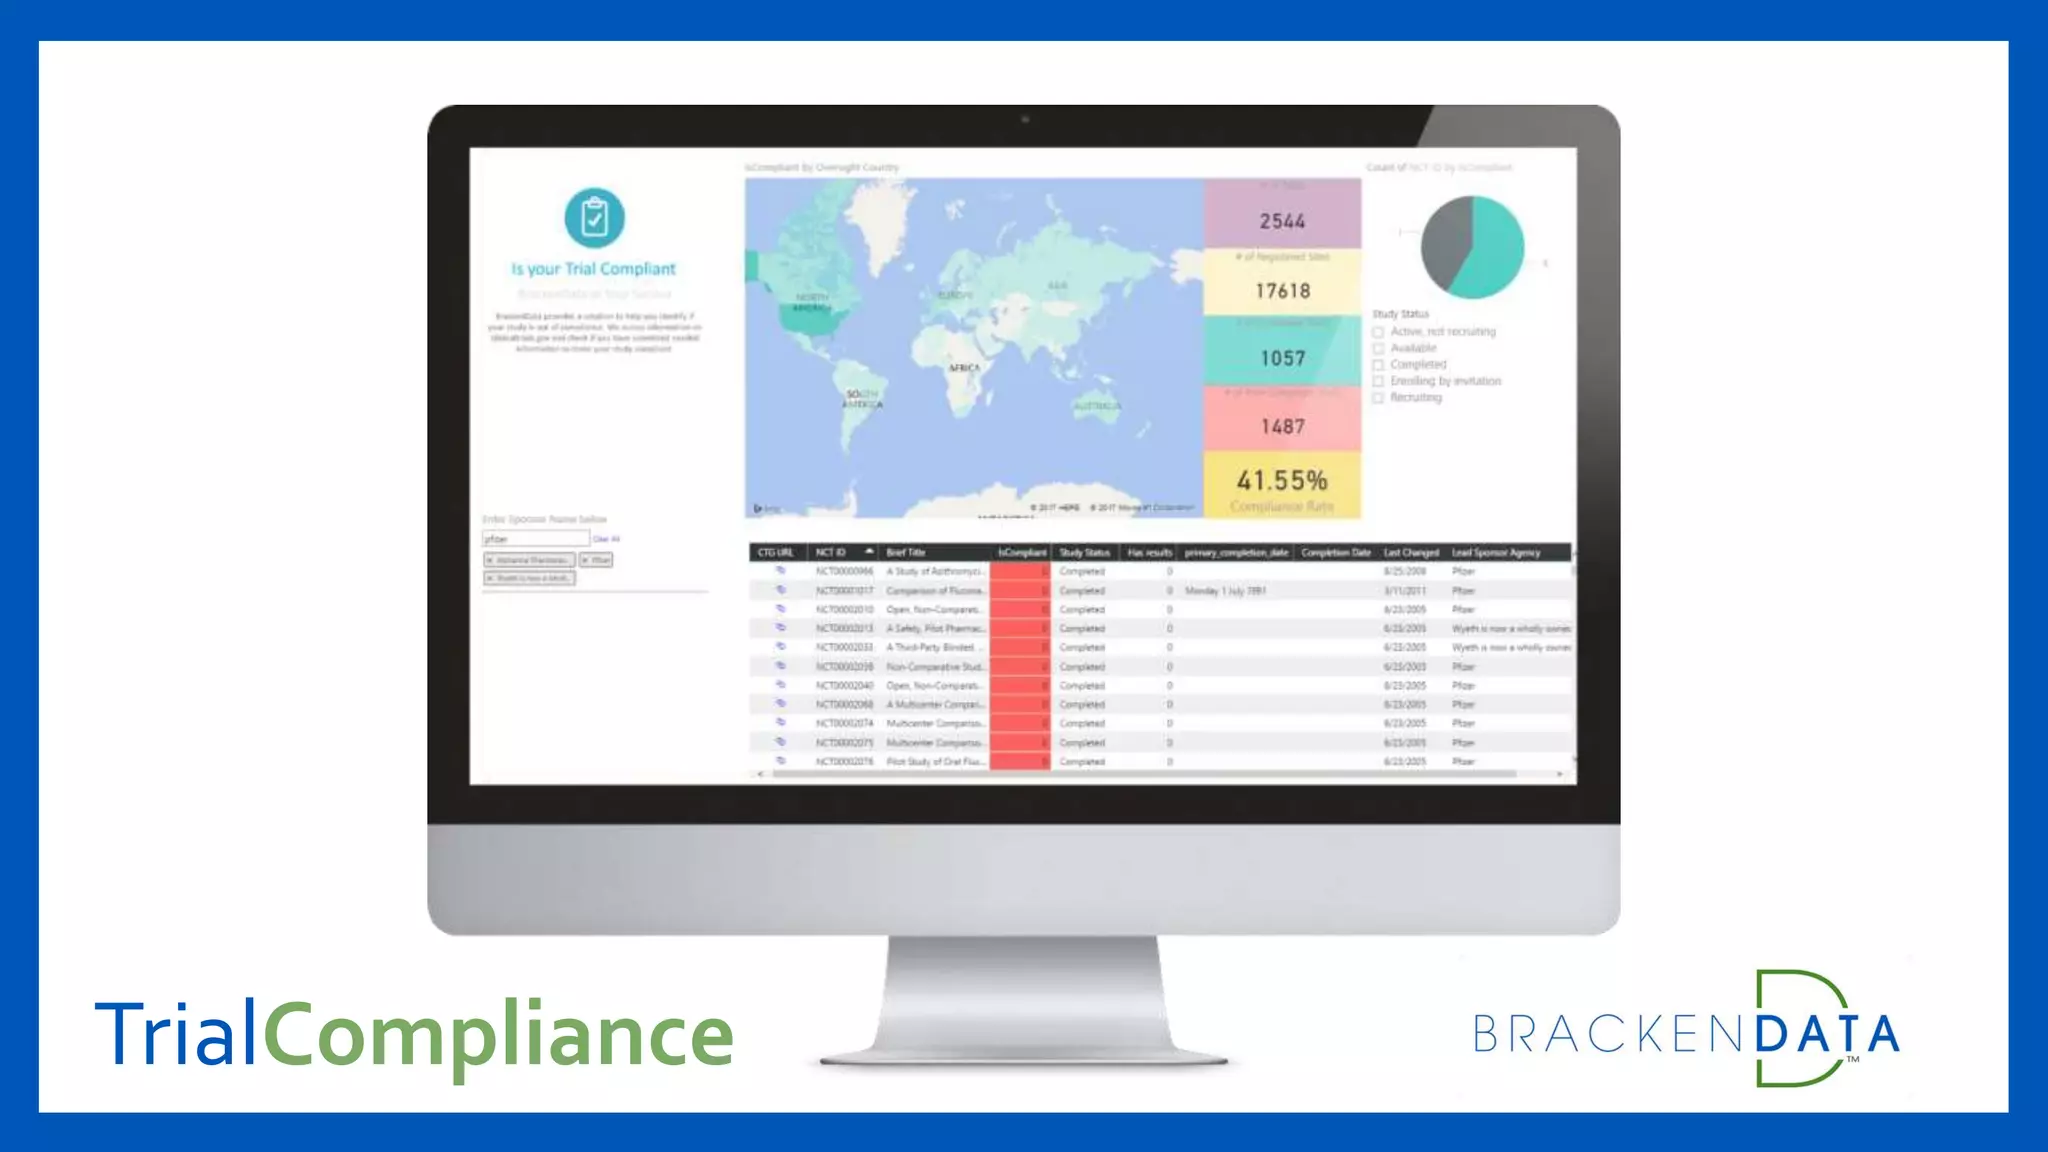
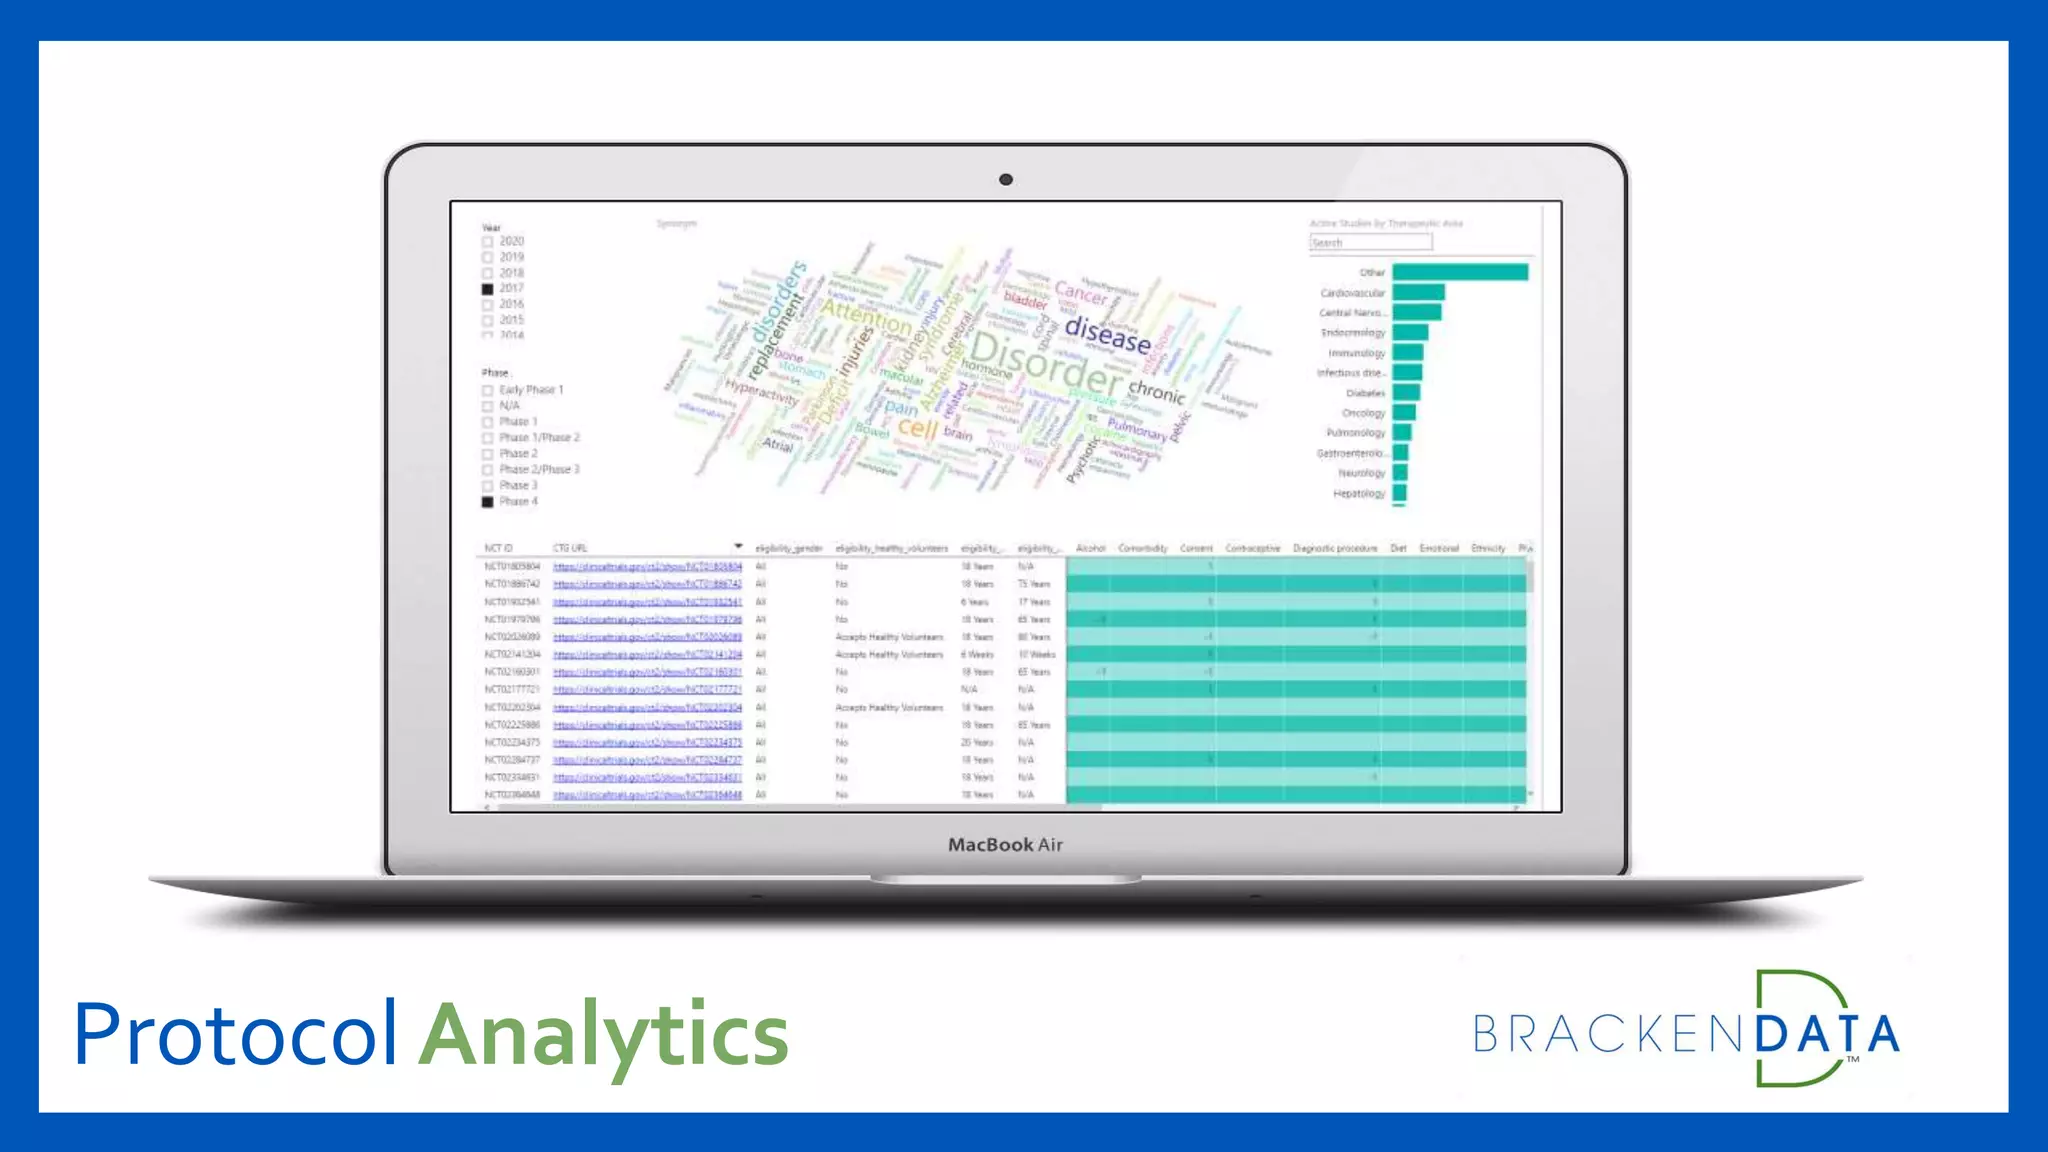
Welcome to the Next Generation of ClinicalTrial Intelligence
Our Mission
To provide the most intuitive and cost-effective tools for
interacting with the world’s clinical trial data
2016 Award Recipient
There are over 10 million
datapoints covering about
250,000 clinical trials
available on the internet
for free.
This is growing at a rate of 450 new clinical trials per week!
There are over 10 million
datapoints covering about
250,000 clinical trials
available on the internet
for free.
Thousands of decisions, predictions,
uninformed sales conversations, and
hours of research could be saved
by providing an interface that allows
teams to intuitively and quickly leverage
this gigantic volume of information.
What DoWe Do?
BrackenData cleans, categorizes, visualizes,
and packages this information into meaningful
analytics solutions.
We call it
ClinicalTrial Intelligence.
TrialFinder
How It Looks:
TrialFinder
Interactive visual filters
slice the dataset by
geography, therapeutic
area, phase, and more.
TrialFinder
Interactive visual filters
slice the dataset by
geography, therapeutic
area, phase, and more.
For more granular research
open the filters pane and
choose from over 20
advanced filtering options
TrialFinder
Interactive visual filters
slice the dataset by
geography, therapeutic
area, phase, and more.
This allows a user to
change the dataset from
230,000 trials to a few
dozen in seconds.
For more granular research
open the filters pane and
choose from over 20
advanced filtering options
TrialFinder
Interactive visual filters
slice the dataset by
geography, therapeutic
area, phase, and more.
This allows a user to
change the dataset from
230,000 trials to a few
dozen in seconds.
The tool produces tables of
data on trials and trial sites
based on your criteria
For more granular research
open the filters pane and
choose from over 20
advanced filtering options
Expand any tile to full-
screen then go back
without interrupting your
research
Export tables to Excel for
further analysis and chart-
building.
This ExampleWasTrialFinder
Available Filters Include:
• Sponsor or trial site geography
• Therapeutic area (TA)
• Study start date
• Study status
• Phase
• Sponsor type
• Condition
Output Data Includes:
• BriefTitle
• Lead sponsor agency
• Available contact information
• Key dates
• Phase
• Anticipated enrollment
• A link to the trial record on
ClinicalTrials.gov
We Offer 8 Solutions
CT.g Analytics
Discover market trends in the
ClinicalTrials.gov database.
TrialFinder
Get answers to questions on clinical
trial, trial site, and sponsor activity.
TrialFinder Imaging
Interact with clinical trial data
based on imaging modality.
TrialFinder Weekly
Data sheets on new clinical trial
activity direct to your inbox.
TrialCompliance
Understand FDA-compliance by
trial, sponsor, geography, or TA.
Protocol Analytics
Know which eligibility criteria to
use in your trial protocols.
Sunshine Analytics
Use public institutional payment
data to predict operational costs.
SiteFinder
Leverage data on millions of trial
sites and their associated sponsors.
Custom Analytics
We can customize any endpoints
and build you an exclusive product.
Examples of Our Users
Job Role Application
Executives Analyzing market landscape
Monitoring competitor activity
Medical affairs Protocol development planning
Business development Identifying new business or partnership prospects
Exporting lists of sponsor and contact information
Clinical Operations Directors Analyzing patient recruitment factors
Comparing enrollment rates by therapeutic areas and sponsors
Identifying sites associated with trial criteria
Marketing Commercial planning
Market and competitive intelligence
HowWe Do It
• Download, clean, and add public clinical trial
datasets to our database every week
• Build visual dashboards and modules around
these datasets in our fully interactive solutions
• We currently have connections to the data
sources you see with a solid green line.
• Offering will grow to include analytics for many
more public databases
We can combine our solutions with private databases
CT.g
Sunshine
Act
PubMed
Medicare
FDA 1572
Drugs@
FDA
Eudract
???
About CT.g
• The FDA requires registration on CT.g for any
clinical study of a drug or device to be sold or
developed in the US
• NIH requires CT.g registration to publish the
results of ANY trials, anywhere in the world.
• Data includes enrollment numbers, trial site
information, study results and more
239,411
Trials registered to date
452
Studies added every week
197
Countries represented in the dataset
CT.g Stats
from Our Product
Before BrackenData
professionals had 2 options when they needed to:
Discover market trends in clinical trials
Research contact information and trial site activity
Collect intelligence on competing pharma sponsors
Manually Research on CT.g1
Use Legacy Pharma IntelligenceTools2
Problems:
Expensive High cost of labor to execute meaningful research
Time consuming Unable to collect data in short period of time
Uncertainty Never sure if research is exhaustive; prone to human error;
CT.g dataset contains large volume of errors that should be cleaned before being used.
User needs to conduct searches
one-by-one
Insights are limited,
not interactive.
Simple hypertext search results make
research process long and tedious
Manually Research on CT.g1
Problems
Expensive Licenses are $18k - $100k+
Limited Functionality Multiple tools needed for different job roles
Outdated Infrastructures Difficult for providers to customize for users
Legacy interfaces are difficult to
navigate
Data is static; not
truly interactive.
Poor UX is frustrating for users
Use Legacy Pharma IntelligenceTools2
Empowering Users to Interact with theWorld’s ClinicalTrial Data
Fast Hours of manual research now completed in seconds.
Interactive Click on the visuals to change the data.
Simple Everything works together in a single screen
Modular Our infrastructure allows us to customize for clients quickly
Intuitive An easy-to-use interface minimizes time needed to learn.
Accessible Solutions range from $100/month to $10k/year. We win on price.
Our Solutions
CTg Analytics
TrialFinder
TrialCompliance
Protocol Analytics
Sunshine Analytics
We Also Offer a FreeTool:TrialTrends
Use it to analyze historical clinical trial
volumes by phase and trial type.
See into the future with our forecasts for trial
activity into 2018.
Create a Free TrialTrends Account
ConnectWith Us
Signup for a Personal Demonstration of TrialFinder
BrackenData.com |Twitter | Linkedin
Contact: info@BrackenData.com
Or Read Our Blog for Insights and Stories Related to
ClinicalTrial Data
Popular Posts:
• Where In theWorld Is ClinicalTrialActivity Decreasing?
• Interesting Stats from Over 215,000 ClinicalTrials
• Academia vs the Industry:Who Enrolls More Subjects?

How BrackenData Leverages Data on Over 250,000 Clinical Trials

  • 1.
    Welcome to theNext Generation of ClinicalTrial Intelligence
  • 2.
    Our Mission To providethe most intuitive and cost-effective tools for interacting with the world’s clinical trial data 2016 Award Recipient
  • 3.
    There are over10 million datapoints covering about 250,000 clinical trials available on the internet for free.
  • 4.
    This is growingat a rate of 450 new clinical trials per week! There are over 10 million datapoints covering about 250,000 clinical trials available on the internet for free.
  • 5.
    Thousands of decisions,predictions, uninformed sales conversations, and hours of research could be saved by providing an interface that allows teams to intuitively and quickly leverage this gigantic volume of information.
  • 6.
    What DoWe Do? BrackenDatacleans, categorizes, visualizes, and packages this information into meaningful analytics solutions. We call it ClinicalTrial Intelligence.
  • 7.
  • 8.
    TrialFinder Interactive visual filters slicethe dataset by geography, therapeutic area, phase, and more.
  • 9.
    TrialFinder Interactive visual filters slicethe dataset by geography, therapeutic area, phase, and more. For more granular research open the filters pane and choose from over 20 advanced filtering options
  • 10.
    TrialFinder Interactive visual filters slicethe dataset by geography, therapeutic area, phase, and more. This allows a user to change the dataset from 230,000 trials to a few dozen in seconds. For more granular research open the filters pane and choose from over 20 advanced filtering options
  • 11.
    TrialFinder Interactive visual filters slicethe dataset by geography, therapeutic area, phase, and more. This allows a user to change the dataset from 230,000 trials to a few dozen in seconds. The tool produces tables of data on trials and trial sites based on your criteria For more granular research open the filters pane and choose from over 20 advanced filtering options
  • 12.
    TrialFinder Interactive visual filters slicethe dataset by geography, therapeutic area, phase, and more. This allows a user to change the dataset from 230,000 trials to a few dozen in seconds. The tool produces tables of data on trials and trial sites based on your criteria For more granular research open the filters pane and choose from over 20 advanced filtering options Expand any tile to full- screen then go back without interrupting your research
  • 13.
    TrialFinder Interactive visual filters slicethe dataset by geography, therapeutic area, phase, and more. This allows a user to change the dataset from 230,000 trials to a few dozen in seconds. The tool produces tables of data on trials and trial sites based on your criteria For more granular research open the filters pane and choose from over 20 advanced filtering options Expand any tile to full- screen then go back without interrupting your research Export tables to Excel for further analysis and chart- building.
  • 14.
    This ExampleWasTrialFinder Available FiltersInclude: • Sponsor or trial site geography • Therapeutic area (TA) • Study start date • Study status • Phase • Sponsor type • Condition Output Data Includes: • BriefTitle • Lead sponsor agency • Available contact information • Key dates • Phase • Anticipated enrollment • A link to the trial record on ClinicalTrials.gov
  • 15.
    We Offer 8Solutions CT.g Analytics Discover market trends in the ClinicalTrials.gov database. TrialFinder Get answers to questions on clinical trial, trial site, and sponsor activity. TrialFinder Imaging Interact with clinical trial data based on imaging modality. TrialFinder Weekly Data sheets on new clinical trial activity direct to your inbox. TrialCompliance Understand FDA-compliance by trial, sponsor, geography, or TA. Protocol Analytics Know which eligibility criteria to use in your trial protocols. Sunshine Analytics Use public institutional payment data to predict operational costs. SiteFinder Leverage data on millions of trial sites and their associated sponsors. Custom Analytics We can customize any endpoints and build you an exclusive product.
  • 16.
    Examples of OurUsers Job Role Application Executives Analyzing market landscape Monitoring competitor activity Medical affairs Protocol development planning Business development Identifying new business or partnership prospects Exporting lists of sponsor and contact information Clinical Operations Directors Analyzing patient recruitment factors Comparing enrollment rates by therapeutic areas and sponsors Identifying sites associated with trial criteria Marketing Commercial planning Market and competitive intelligence
  • 17.
    HowWe Do It •Download, clean, and add public clinical trial datasets to our database every week • Build visual dashboards and modules around these datasets in our fully interactive solutions • We currently have connections to the data sources you see with a solid green line. • Offering will grow to include analytics for many more public databases We can combine our solutions with private databases CT.g Sunshine Act PubMed Medicare FDA 1572 Drugs@ FDA Eudract ???
  • 18.
    About CT.g • TheFDA requires registration on CT.g for any clinical study of a drug or device to be sold or developed in the US • NIH requires CT.g registration to publish the results of ANY trials, anywhere in the world. • Data includes enrollment numbers, trial site information, study results and more 239,411 Trials registered to date 452 Studies added every week 197 Countries represented in the dataset CT.g Stats from Our Product
  • 19.
    Before BrackenData professionals had2 options when they needed to: Discover market trends in clinical trials Research contact information and trial site activity Collect intelligence on competing pharma sponsors Manually Research on CT.g1 Use Legacy Pharma IntelligenceTools2
  • 20.
    Problems: Expensive High costof labor to execute meaningful research Time consuming Unable to collect data in short period of time Uncertainty Never sure if research is exhaustive; prone to human error; CT.g dataset contains large volume of errors that should be cleaned before being used. User needs to conduct searches one-by-one Insights are limited, not interactive. Simple hypertext search results make research process long and tedious Manually Research on CT.g1
  • 21.
    Problems Expensive Licenses are$18k - $100k+ Limited Functionality Multiple tools needed for different job roles Outdated Infrastructures Difficult for providers to customize for users Legacy interfaces are difficult to navigate Data is static; not truly interactive. Poor UX is frustrating for users Use Legacy Pharma IntelligenceTools2
  • 22.
    Empowering Users toInteract with theWorld’s ClinicalTrial Data Fast Hours of manual research now completed in seconds. Interactive Click on the visuals to change the data. Simple Everything works together in a single screen Modular Our infrastructure allows us to customize for clients quickly Intuitive An easy-to-use interface minimizes time needed to learn. Accessible Solutions range from $100/month to $10k/year. We win on price. Our Solutions
  • 23.
  • 24.
  • 25.
  • 26.
  • 27.
  • 28.
    We Also Offera FreeTool:TrialTrends Use it to analyze historical clinical trial volumes by phase and trial type. See into the future with our forecasts for trial activity into 2018. Create a Free TrialTrends Account
  • 29.
    ConnectWith Us Signup fora Personal Demonstration of TrialFinder BrackenData.com |Twitter | Linkedin Contact: info@BrackenData.com Or Read Our Blog for Insights and Stories Related to ClinicalTrial Data Popular Posts: • Where In theWorld Is ClinicalTrialActivity Decreasing? • Interesting Stats from Over 215,000 ClinicalTrials • Academia vs the Industry:Who Enrolls More Subjects?