Download to read offline

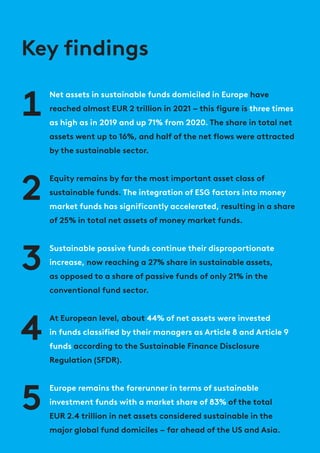
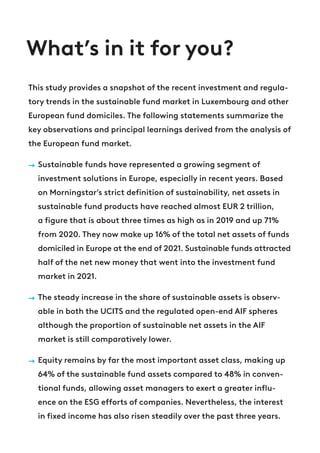
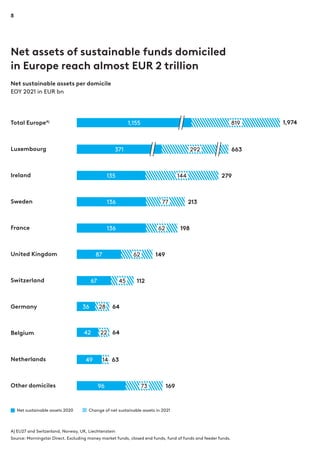
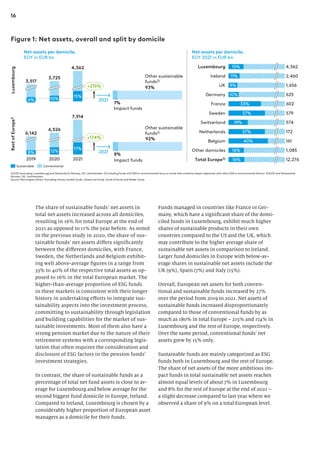
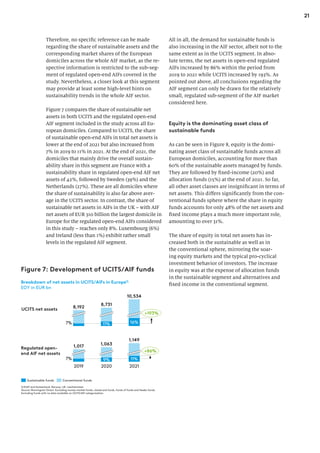
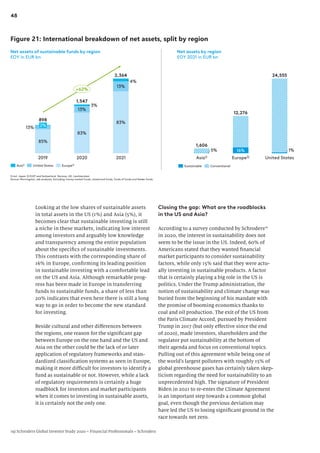


The 2022 study commissioned by ALFI highlights that European sustainable investment funds have surged to nearly EUR 2 trillion, reflecting a 71% increase from 2020 and accounting for 16% of total net assets. Europe dominates global sustainable investments, holding 83% of the market share, with passive sustainable funds seeing remarkable growth. The report indicates an ongoing transition towards sustainability in the investment sector, emphasizing the integration of ESG factors across various fund types.


