hitejinro holdings 000140 Algorithm Investment Report
•
0 likes•6 views

This document provides a summary of a company's financial performance and stock analysis over several periods. It includes key metrics like sales, operating profit, net income, debt ratios, and stock prices. The analysis assigns the company a score of 53.6 for stock price rise probability and recommends a purchase amount. It also provides charts showing the company's stock price probability scores over time compared to industry averages.
![[Price for scheduled purchasing]
Arbitrarily made
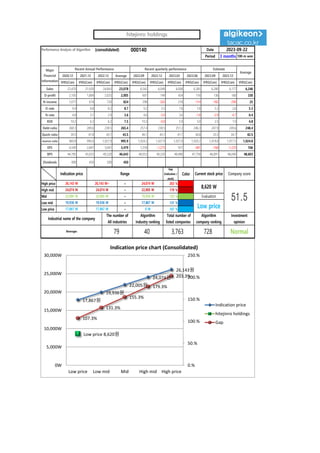
Algorithm stocks Trading Strategies (consolidated) 000140 Date
Period
Gap
(Indication /
stock)
Color
2023-09-22
3 months
Current stock price Evaluation
Stock price rise
probability score
Investment opinion Prospective purchase amount
8,620 W Low price 53.6 Normal 9,000,000 W
Suggested Purchase
Amount 4,331,787 W
Number of stocks
purchased 503
Indication price Range Buying / Selling Buying / Selling [Stocks]
High price 26,143 W 26,143 W~ ~ 24,074 W 203 % -8,805,582 W All selling
High mid 24,074 W 24,074 W ~ 22,005 W 179 % -7,765,852 W All selling
Mid 22,005 W 22,005 W ~ 19,936 W 155 % -6,726,123 W All selling
Low mid 19,936 W 19,936 W ~ 17,867 W 131 % -5,686,393 W All selling
low price 17,867 W 17,867 W ~ 0 W 107 % -4,646,664 W All selling
Stock price rise
probability score
A Sector 40.6 45.8 46.2 44.8 48.2 49.8
53.6
B Sector 28.8 29.6 45.0 44.8 37.5 30.4
Total average
2023.04.27 2023.05.30 2023.06.28 2023.07.26 2023.08.24 2023.09.21
34.7 37.7 45.6 32.5 42.8 40.1
24 % -7 %
2023.05.30 2023.06.28 2023.07.26 2023.08.24 2023.09.21
Total of
increase rate
Total score
A Sector 11 % 1 % -3 % 7 % 3 %
0 % 48.7
B Sector 3 % 34 % -0 % -20 % -23 %
Total average 8 % 17 % -40 %
41
46 46 45
48 50
29 30
45 45
38
30
35
38
46
33
43
40
0
10
20
30
40
50
60
2023.04.27 2023.05.30 2023.06.28 2023.07.26 2023.08.24 2023.09.21
Stock price rise probability score
A sector
B sector
Total average
11%
1%
-3%
7% 3%
3%
34%
-0%
-20% -23%
8%
17%
-40%
24%
-7%
-60%
-40%
-20%
0%
20%
40%
2023.05.30 2023.06.28 2023.07.26 2023.08.24 2023.09.21
Increase rate of stock price rise
A sector
B sector
Total average
hitejinro holdings](data:image/gif;base64,R0lGODlhAQABAIAAAAAAAP///yH5BAEAAAAALAAAAAABAAEAAAIBRAA7)
Recommended
Recommended
More Related Content
Similar to hitejinro holdings 000140 Algorithm Investment Report
Similar to hitejinro holdings 000140 Algorithm Investment Report (20)
More from 알고리즘 기업분석 컨설팅-알기컨,algikeon
More from 알고리즘 기업분석 컨설팅-알기컨,algikeon (20)
Recently uploaded
Recently uploaded (8)
hitejinro holdings 000140 Algorithm Investment Report
- 1. Performance Analysis of Algorithm (consolidated) 000140 Date Period 3 months 100-m won 2020.12 2021.12 2022.12 Average 2022.09 2022.12 2023.03 2023.06 2023.09 2023.12 IFRS(Con) IFRS(Con) IFRS(Con) IFRS(Con) IFRS(Con) IFRS(Con) IFRS(Con) IFRS(Con) IFRS(Con) IFRS(Con) IFRS(Con) Sales 22,470 21,920 24,843 23,078 6,542 6,049 6,008 6,385 6,280 6,177 6,246 O-profit 2,105 1,884 2,025 2,005 601 149 454 116 136 160 330 N-income 1,077 674 720 824 298 -302 218 -114 -182 -290 25 O-rate 9.4 8.6 8.2 8.7 9.2 2.5 7.6 1.8 2.2 2.6 5.3 N-rate 4.8 3.1 2.9 3.6 4.6 -5.0 3.6 -1.8 -2.9 -4.7 0.4 ROE 10.2 6.2 6.2 7.5 10.3 -0.0 5.9 3.0 2.5 1.9 4.8 Debt-ratio 268.3 289.6 238.5 265.4 257.4 238.5 251.3 246.3 247.9 249.6 248.4 Quick-ratio 39.5 47.8 43.1 43.5 49.1 43.1 41.1 36.8 35.5 34.7 42.5 reserve-ratio 969.8 990.0 1,027.9 995.9 1,024.2 1,027.9 1,027.0 1,020.2 1,018.8 1,017.5 1,024.8 EPS 4,549 2,847 3,041 3,479 1,259 -1,275 921 -481 -768 -1,225 106 BPS 44,785 45,925 49,220 46,643 48,953 49,220 48,480 47,758 46,891 46,040 48,603 Dividends 400 450 500 450 2023-09-22 Major Financial Information Recent Annual Performance Recent quarterly performance Estimate Average Gap (Indication / stock) Color High price ~ 203 % High mid ~ 179 % Mid ~ 155 % Low mid ~ 131 % Low price ~ 107 % Indication price Range Current stock price Company score 24,074 W 24,074 W 22,005 W 22,005 W 22,005 W 19,936 W Evaluation 26,143 W 26,143 W~ 24,074 W 8,620 W 51.5 19,936 W 19,936 W 17,867 W Low price Normal 17,867 W 17,867 W 0 W Industrial name of the company The number of All industries Algorithm Industry ranking Total number of listed companies Algorithm company ranking Investment opinion Beverages 79 40 3,763 728 17,867원 19,936원 22,005원 24,074원 26,143원 Low price 8,620원 107.3% 131.3% 155.3% 179.3% 203.3% 0.% 50.% 100.% 150.% 200.% 250.% 0W 5,000W 10,000W 15,000W 20,000W 25,000W 30,000W Low price Low mid Mid High mid High price Indication price chart (Consolidated) Indication price hitejinro holdings Gap hitejinro holdings
- 2. [Price for scheduled purchasing] Arbitrarily made Algorithm stocks Trading Strategies (consolidated) 000140 Date Period Gap (Indication / stock) Color 2023-09-22 3 months Current stock price Evaluation Stock price rise probability score Investment opinion Prospective purchase amount 8,620 W Low price 53.6 Normal 9,000,000 W Suggested Purchase Amount 4,331,787 W Number of stocks purchased 503 Indication price Range Buying / Selling Buying / Selling [Stocks] High price 26,143 W 26,143 W~ ~ 24,074 W 203 % -8,805,582 W All selling High mid 24,074 W 24,074 W ~ 22,005 W 179 % -7,765,852 W All selling Mid 22,005 W 22,005 W ~ 19,936 W 155 % -6,726,123 W All selling Low mid 19,936 W 19,936 W ~ 17,867 W 131 % -5,686,393 W All selling low price 17,867 W 17,867 W ~ 0 W 107 % -4,646,664 W All selling Stock price rise probability score A Sector 40.6 45.8 46.2 44.8 48.2 49.8 53.6 B Sector 28.8 29.6 45.0 44.8 37.5 30.4 Total average 2023.04.27 2023.05.30 2023.06.28 2023.07.26 2023.08.24 2023.09.21 34.7 37.7 45.6 32.5 42.8 40.1 24 % -7 % 2023.05.30 2023.06.28 2023.07.26 2023.08.24 2023.09.21 Total of increase rate Total score A Sector 11 % 1 % -3 % 7 % 3 % 0 % 48.7 B Sector 3 % 34 % -0 % -20 % -23 % Total average 8 % 17 % -40 % 41 46 46 45 48 50 29 30 45 45 38 30 35 38 46 33 43 40 0 10 20 30 40 50 60 2023.04.27 2023.05.30 2023.06.28 2023.07.26 2023.08.24 2023.09.21 Stock price rise probability score A sector B sector Total average 11% 1% -3% 7% 3% 3% 34% -0% -20% -23% 8% 17% -40% 24% -7% -60% -40% -20% 0% 20% 40% 2023.05.30 2023.06.28 2023.07.26 2023.08.24 2023.09.21 Increase rate of stock price rise A sector B sector Total average hitejinro holdings
- 3. 정보와 완전 정보 결 투자판단 있습니 위배 무단으 숙지하 Compliance notice ① The information provided by The Algorithm Company Analysis Consulting is obtained through reliable data and information and The Algorithm Company Analysis Program (TACAP), but its accuracy or completeness are not guaranteed. Furthermore, it may change over time.Therefore, we are not legally responsible for the results of the data provided by The Algorithm Company Analysis Consulting because of information errors or omissions. ② The Algorithm Company Analysis Consulting and all the information provided on it site are reference materials for investment decisions and the final responsibility of investment is up to users utilizing this information. ③ The Algorithm Company Analysis Consulting and its site do not do anything that violates the related laws such as discretionary transaction. ④ Users can not reallocate and recycle the information provided by The Algorithm Company Analysis Consulting firm let alone the information provided by its Site. ⑤ Be sure to know about application period of this algorithm analysis report in order to improve its accuracy. Tel : 070 - 4667 - 5009 Email : tacac@tacac.co.kr Homepage : tacac.co.kr Blog : tacac.blog.me SERVICES M&A, IPO, RECOVER, CORPORATE RESTRUCTURING, MANAGEMENT OF TECHNOLOGY, BUSINESS STRATEGY, FAMILY BUSINESS Request : http://tacac.co.kr/?page_id=1374 ① Consulting is o The Algorithm accuracy or com change over tim results of the d Consulting bec ② information pr investment dec up ③ do anything th transaction. ④ The Algorithm information pr ⑤ analysis report