
Download to read offline

![Motivation
Tax to GDP ratio increases as GDP increases
[ Besley and Persson, 2014].
3 / 80](https://image.slidesharecdn.com/3-171116091339/75/Hide-and-Seek-Taxpayers-responses-to-increased-enforcement-through-ICTs-Evidence-from-Natural-and-Field-Experiments-in-Ethiopia-3-2048.jpg)
![Motivation
Tax to GDP ratio increases as GDP increases
[ Besley and Persson, 2014].
Why?
4 / 80](https://image.slidesharecdn.com/3-171116091339/75/Hide-and-Seek-Taxpayers-responses-to-increased-enforcement-through-ICTs-Evidence-from-Natural-and-Field-Experiments-in-Ethiopia-4-2048.jpg)
![Motivation
Tax to GDP ratio increases as GDP increases
[ Besley and Persson, 2014].
Why?
Extensive Margin: Inclusion of previously missing firms in to
the tax system
Less informality because of the need to work with in the
increasingly important formal financial markets
5 / 80](https://image.slidesharecdn.com/3-171116091339/75/Hide-and-Seek-Taxpayers-responses-to-increased-enforcement-through-ICTs-Evidence-from-Natural-and-Field-Experiments-in-Ethiopia-5-2048.jpg)
![Intensive Margin
Intensive Margin: Higher taxes from firms already in the tax
system (i.e higher tax compliance)
1. partly to do trust and norm [Kleven, 2014]
7 / 80](https://image.slidesharecdn.com/3-171116091339/75/Hide-and-Seek-Taxpayers-responses-to-increased-enforcement-through-ICTs-Evidence-from-Natural-and-Field-Experiments-in-Ethiopia-7-2048.jpg)
![Intensive Margin
Intensive Margin: Higher taxes from firms already in the tax
system (i.e higher tax compliance)
1. partly to do trust and norm [Kleven, 2014]
2. Partly due to increased institutional capacity to enforce rules
(such as audit)
8 / 80](https://image.slidesharecdn.com/3-171116091339/75/Hide-and-Seek-Taxpayers-responses-to-increased-enforcement-through-ICTs-Evidence-from-Natural-and-Field-Experiments-in-Ethiopia-8-2048.jpg)
![Intensive Margin
Intensive Margin: Higher taxes from firms already in the tax
system (i.e higher tax compliance)
1. partly to do trust and norm [Kleven, 2014]
2. Partly due to increased institutional capacity to enforce rules
(such as audit)
3. Since audit rates are low, the observed high compliance can
not be explained by higher institutional capacity
9 / 80](https://image.slidesharecdn.com/3-171116091339/75/Hide-and-Seek-Taxpayers-responses-to-increased-enforcement-through-ICTs-Evidence-from-Natural-and-Field-Experiments-in-Ethiopia-9-2048.jpg)
![Intensive Margin
Intensive Margin: Higher taxes from firms already in the tax
system (i.e higher tax compliance)
1. partly to do trust and norm [Kleven, 2014]
2. Partly due to increased institutional capacity to enforce rules
(such as audit)
3. Since audit rates are low, the observed high compliance can
not be explained by higher institutional capacity
4. Mostly explained by increased availability of third party
information [Kleven, et al., 2011] due to the development of
financial markets enabling tracing transactions more easily and
also withholding by firms.
They find negligible evasion on individual income subjected to
third party informaiton whereas self reported income is
subjected to significant evasion. As most individual income is
subjected to third party information in Denmark, the overall
evasion is negligible. 10 / 80](https://image.slidesharecdn.com/3-171116091339/75/Hide-and-Seek-Taxpayers-responses-to-increased-enforcement-through-ICTs-Evidence-from-Natural-and-Field-Experiments-in-Ethiopia-10-2048.jpg)
![Motivation, ctd
The difference in the extensive and intensive margin of
taxation between developed and developing countries implies
optimal tax in developing countries is different from developed
ones [Gordon and Li, 2009]
11 / 80](https://image.slidesharecdn.com/3-171116091339/75/Hide-and-Seek-Taxpayers-responses-to-increased-enforcement-through-ICTs-Evidence-from-Natural-and-Field-Experiments-in-Ethiopia-11-2048.jpg)
![Motivation, ctd
The difference in the extensive and intensive margin of
taxation between developed and developing countries implies
optimal tax in developing countries is different from developed
ones [Gordon and Li, 2009]
Increasing taxation through the extensive margin requires
significance degree of formalization (increased share of firms
in the formal sector) which requires , among other things,
significant development of the financial system.
12 / 80](https://image.slidesharecdn.com/3-171116091339/75/Hide-and-Seek-Taxpayers-responses-to-increased-enforcement-through-ICTs-Evidence-from-Natural-and-Field-Experiments-in-Ethiopia-12-2048.jpg)
![Motivation: IT and public service
[Lewis-Faupel, et al., 2016]The introduction of e-procurement
improves road quality but not speed of completion (India) and
reduced delays in project completion (Indonesia)
15 / 80](https://image.slidesharecdn.com/3-171116091339/75/Hide-and-Seek-Taxpayers-responses-to-increased-enforcement-through-ICTs-Evidence-from-Natural-and-Field-Experiments-in-Ethiopia-15-2048.jpg)
![Motivation: IT and public service
[Lewis-Faupel, et al., 2016]The introduction of e-procurement
improves road quality but not speed of completion (India) and
reduced delays in project completion (Indonesia)
[Muralidharan, et al., 2016] find that the introduction of
biometrically authenticated payments infrastructure
(”Smartcards”) in India leads to a faster, more predictable,
and less corrupt NREGS payments process without adversely
affecting program access. It is also cost effective and
beneficiaries overwhelmingly preferred it.
16 / 80](https://image.slidesharecdn.com/3-171116091339/75/Hide-and-Seek-Taxpayers-responses-to-increased-enforcement-through-ICTs-Evidence-from-Natural-and-Field-Experiments-in-Ethiopia-16-2048.jpg)
![Motivation: Shifting evasion
Another strand of the literature shows that there may be a
limit to how much tax compliance may be achieved through
the introduction of ICT.
Recent literature shows that when third party information is
not complete, shifting of evasion to the area not covered by
third party information (for instance by increasing costs when
third party information is used for verifying sales
[Carrillo, et al. , fortcoming])
18 / 80](https://image.slidesharecdn.com/3-171116091339/75/Hide-and-Seek-Taxpayers-responses-to-increased-enforcement-through-ICTs-Evidence-from-Natural-and-Field-Experiments-in-Ethiopia-18-2048.jpg)
![Existing study on Ethiopia
[Ali, et al., 2015] investigates whether there is an increase in
VAT declaration due to the introduction of the electonic sales
registration machine
19 / 80](https://image.slidesharecdn.com/3-171116091339/75/Hide-and-Seek-Taxpayers-responses-to-increased-enforcement-through-ICTs-Evidence-from-Natural-and-Field-Experiments-in-Ethiopia-19-2048.jpg)
![Existing study on Ethiopia
[Ali, et al., 2015] investigates whether there is an increase in
VAT declaration due to the introduction of the electonic sales
registration machine
This paper, however, has several limitations.
20 / 80](https://image.slidesharecdn.com/3-171116091339/75/Hide-and-Seek-Taxpayers-responses-to-increased-enforcement-through-ICTs-Evidence-from-Natural-and-Field-Experiments-in-Ethiopia-20-2048.jpg)
![Existing study on Ethiopia
[Ali, et al., 2015] investigates whether there is an increase in
VAT declaration due to the introduction of the electonic sales
registration machine
This paper, however, has several limitations.
1. Uses data only on those firms declaring VAT
21 / 80](https://image.slidesharecdn.com/3-171116091339/75/Hide-and-Seek-Taxpayers-responses-to-increased-enforcement-through-ICTs-Evidence-from-Natural-and-Field-Experiments-in-Ethiopia-21-2048.jpg)
![Existing study on Ethiopia
[Ali, et al., 2015] investigates whether there is an increase in
VAT declaration due to the introduction of the electonic sales
registration machine
This paper, however, has several limitations.
1. Uses data only on those firms declaring VAT
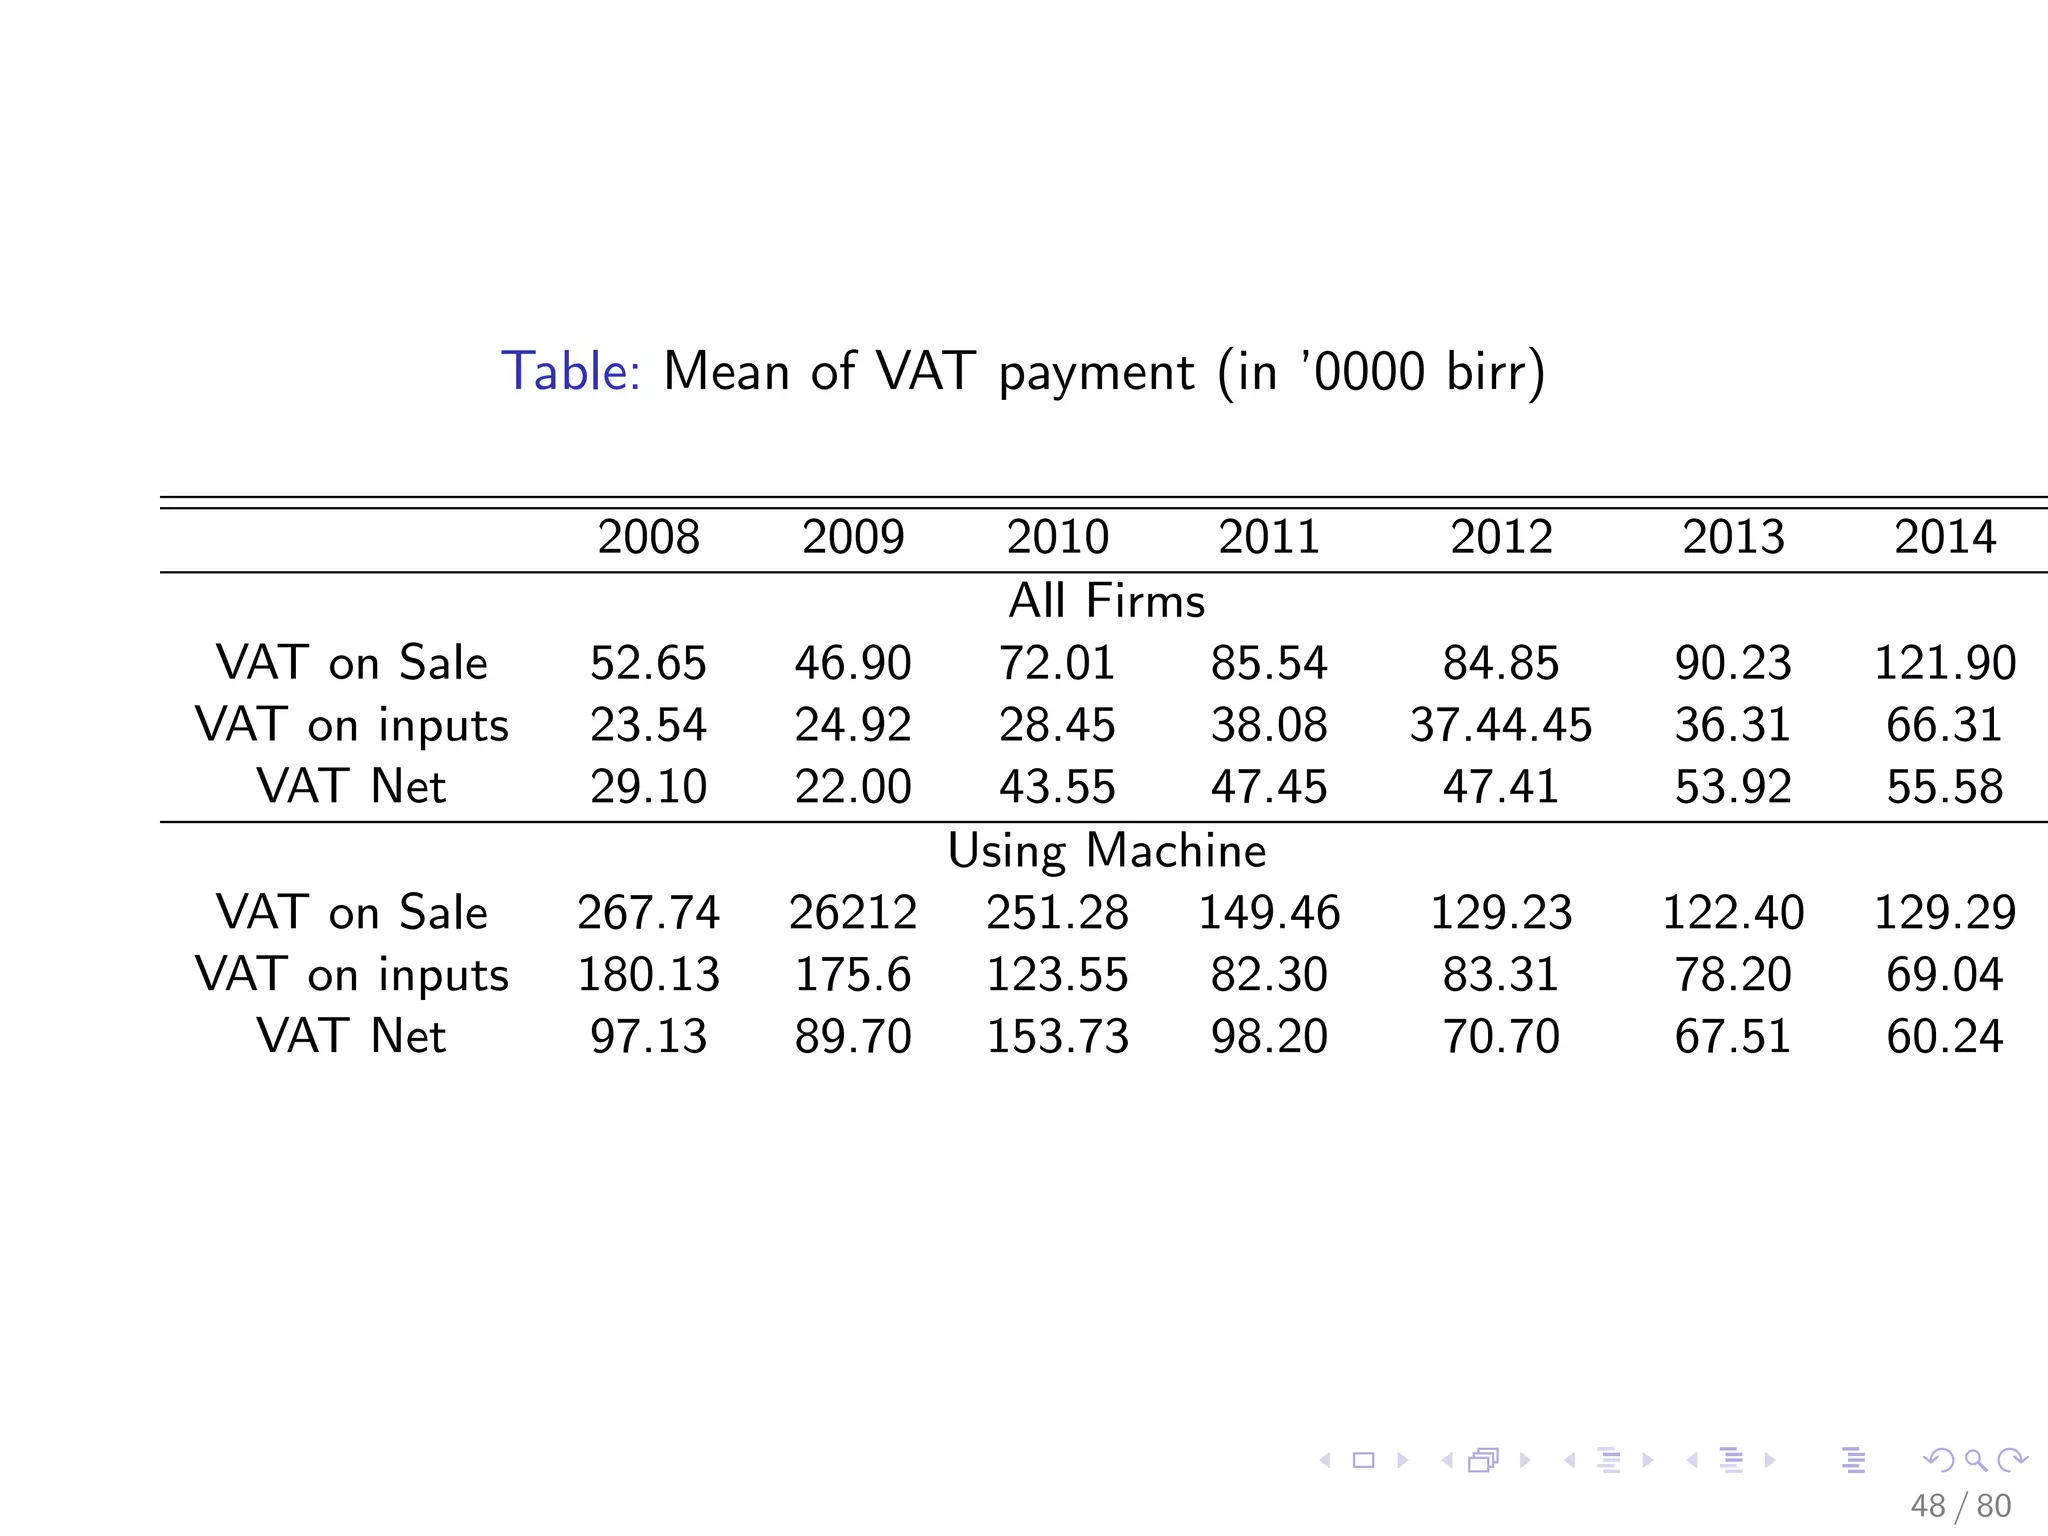
2. Doesn’t ditinguish between gross VAT declaration and net VAT
decalration (firms could increase VAT declaration from sale but
compensate it by increasing VAT they paid for inputs)
22 / 80](https://image.slidesharecdn.com/3-171116091339/75/Hide-and-Seek-Taxpayers-responses-to-increased-enforcement-through-ICTs-Evidence-from-Natural-and-Field-Experiments-in-Ethiopia-22-2048.jpg)
![Existing study on Ethiopia
[Ali, et al., 2015] investigates whether there is an increase in
VAT declaration due to the introduction of the electonic sales
registration machine
This paper, however, has several limitations.
1. Uses data only on those firms declaring VAT
2. Doesn’t ditinguish between gross VAT declaration and net VAT
decalration (firms could increase VAT declaration from sale but
compensate it by increasing VAT they paid for inputs)
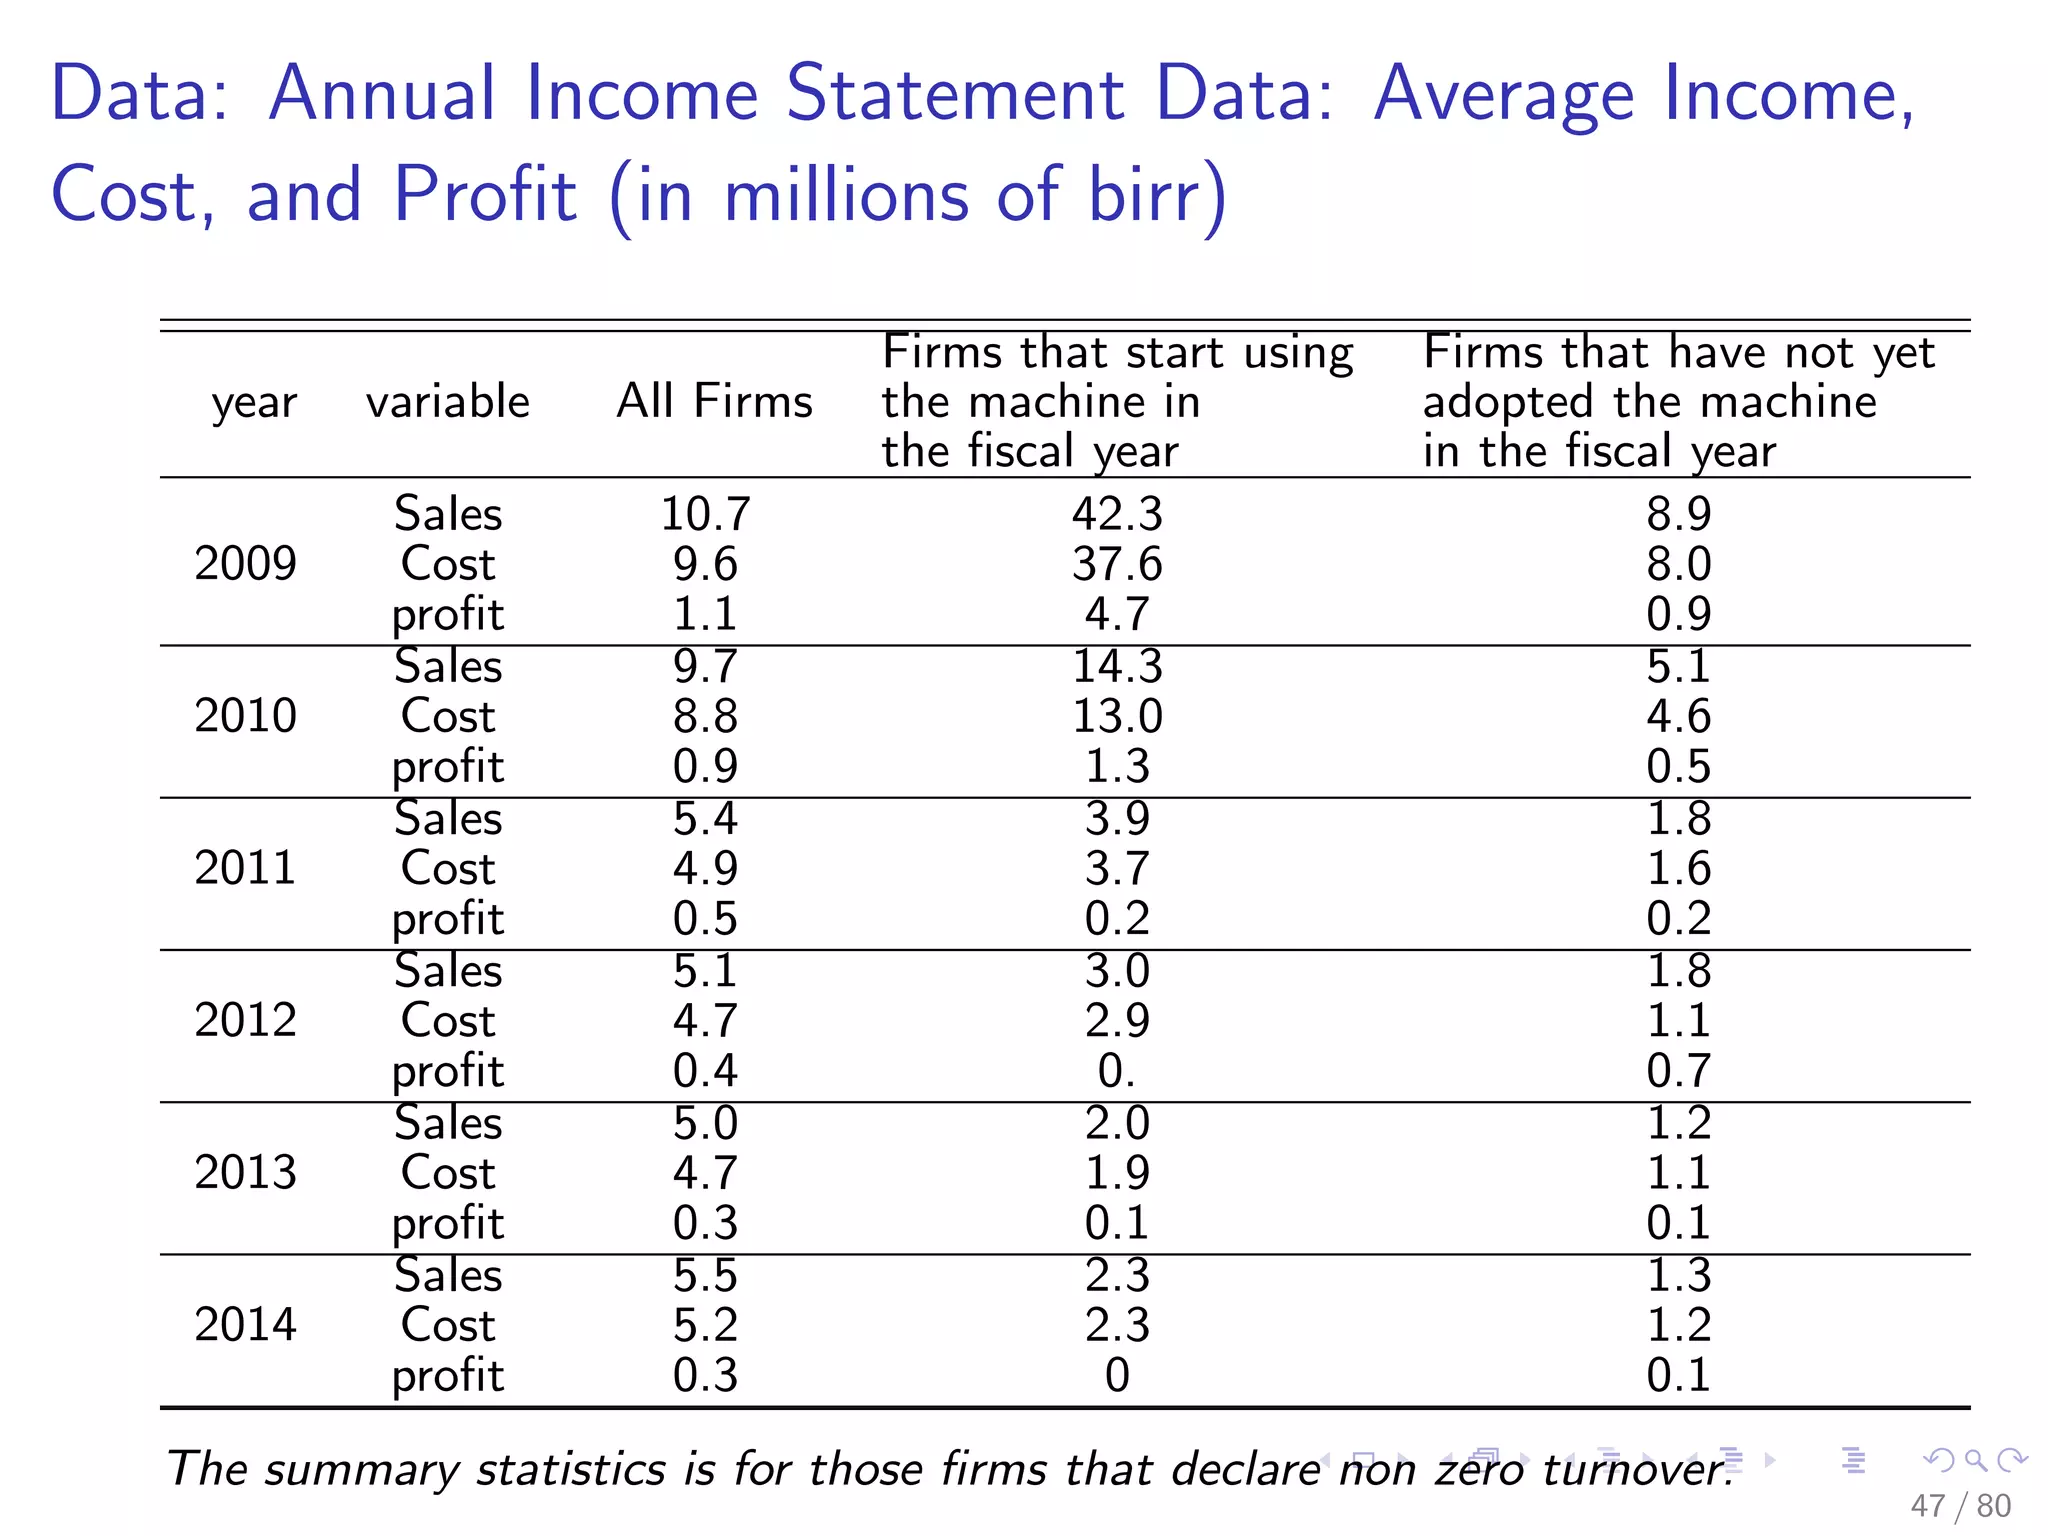
3. Doesn’t investigate the response of firms in terms of
declarations for income tax purposes (i.e., sales, cost, profit)
23 / 80](https://image.slidesharecdn.com/3-171116091339/75/Hide-and-Seek-Taxpayers-responses-to-increased-enforcement-through-ICTs-Evidence-from-Natural-and-Field-Experiments-in-Ethiopia-23-2048.jpg)
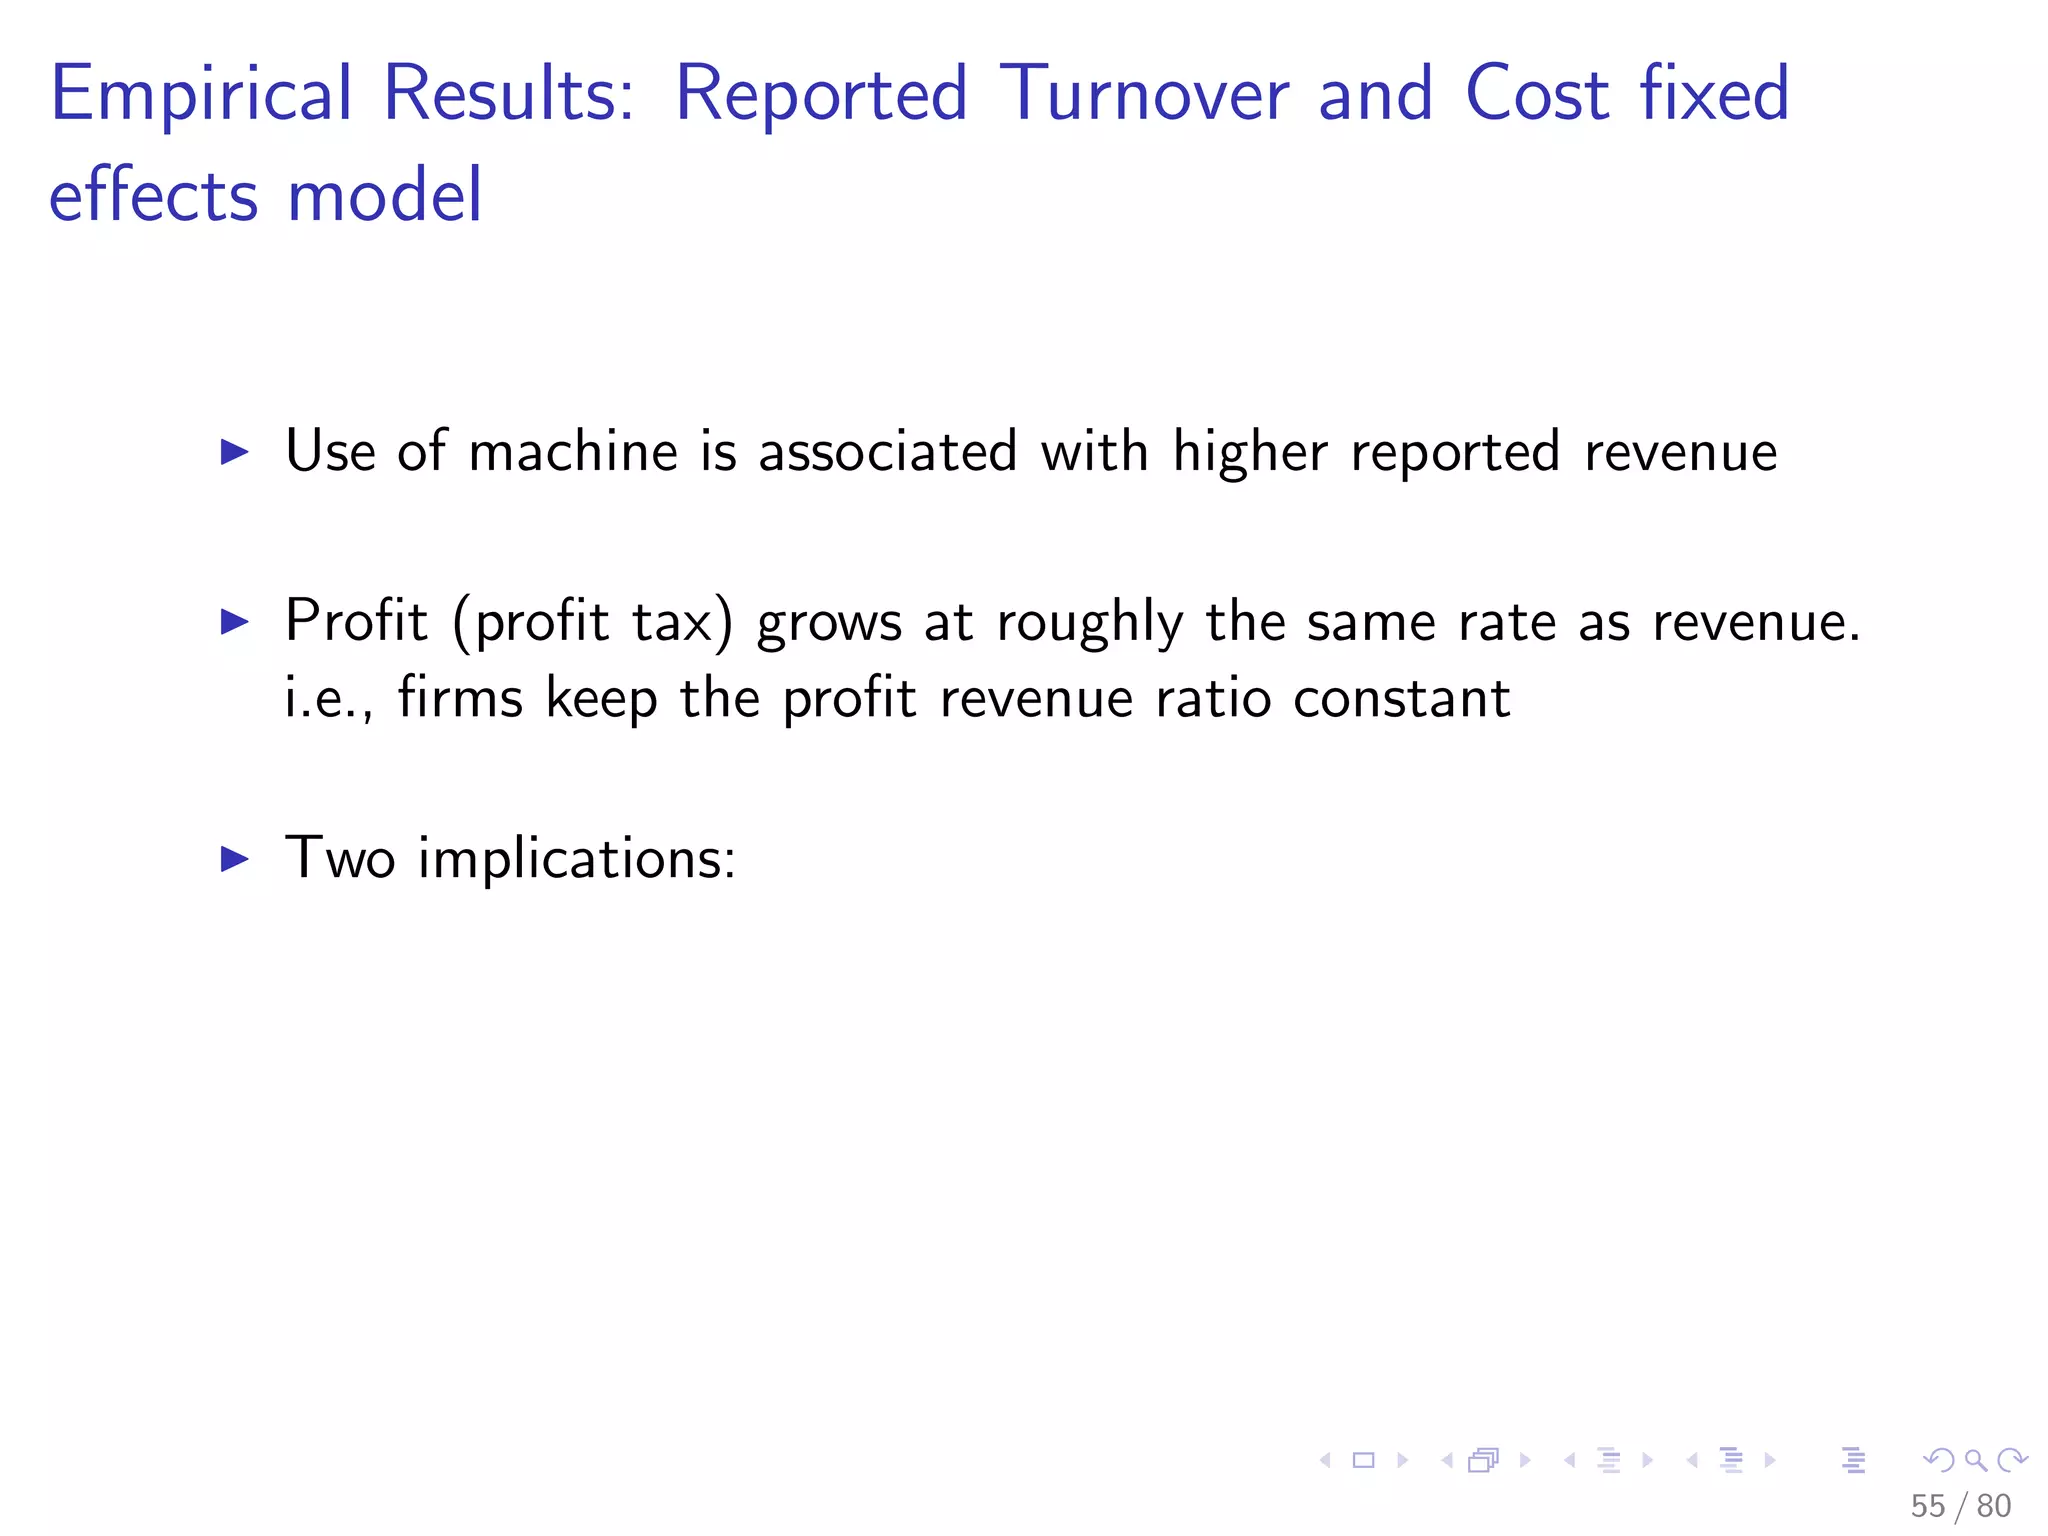
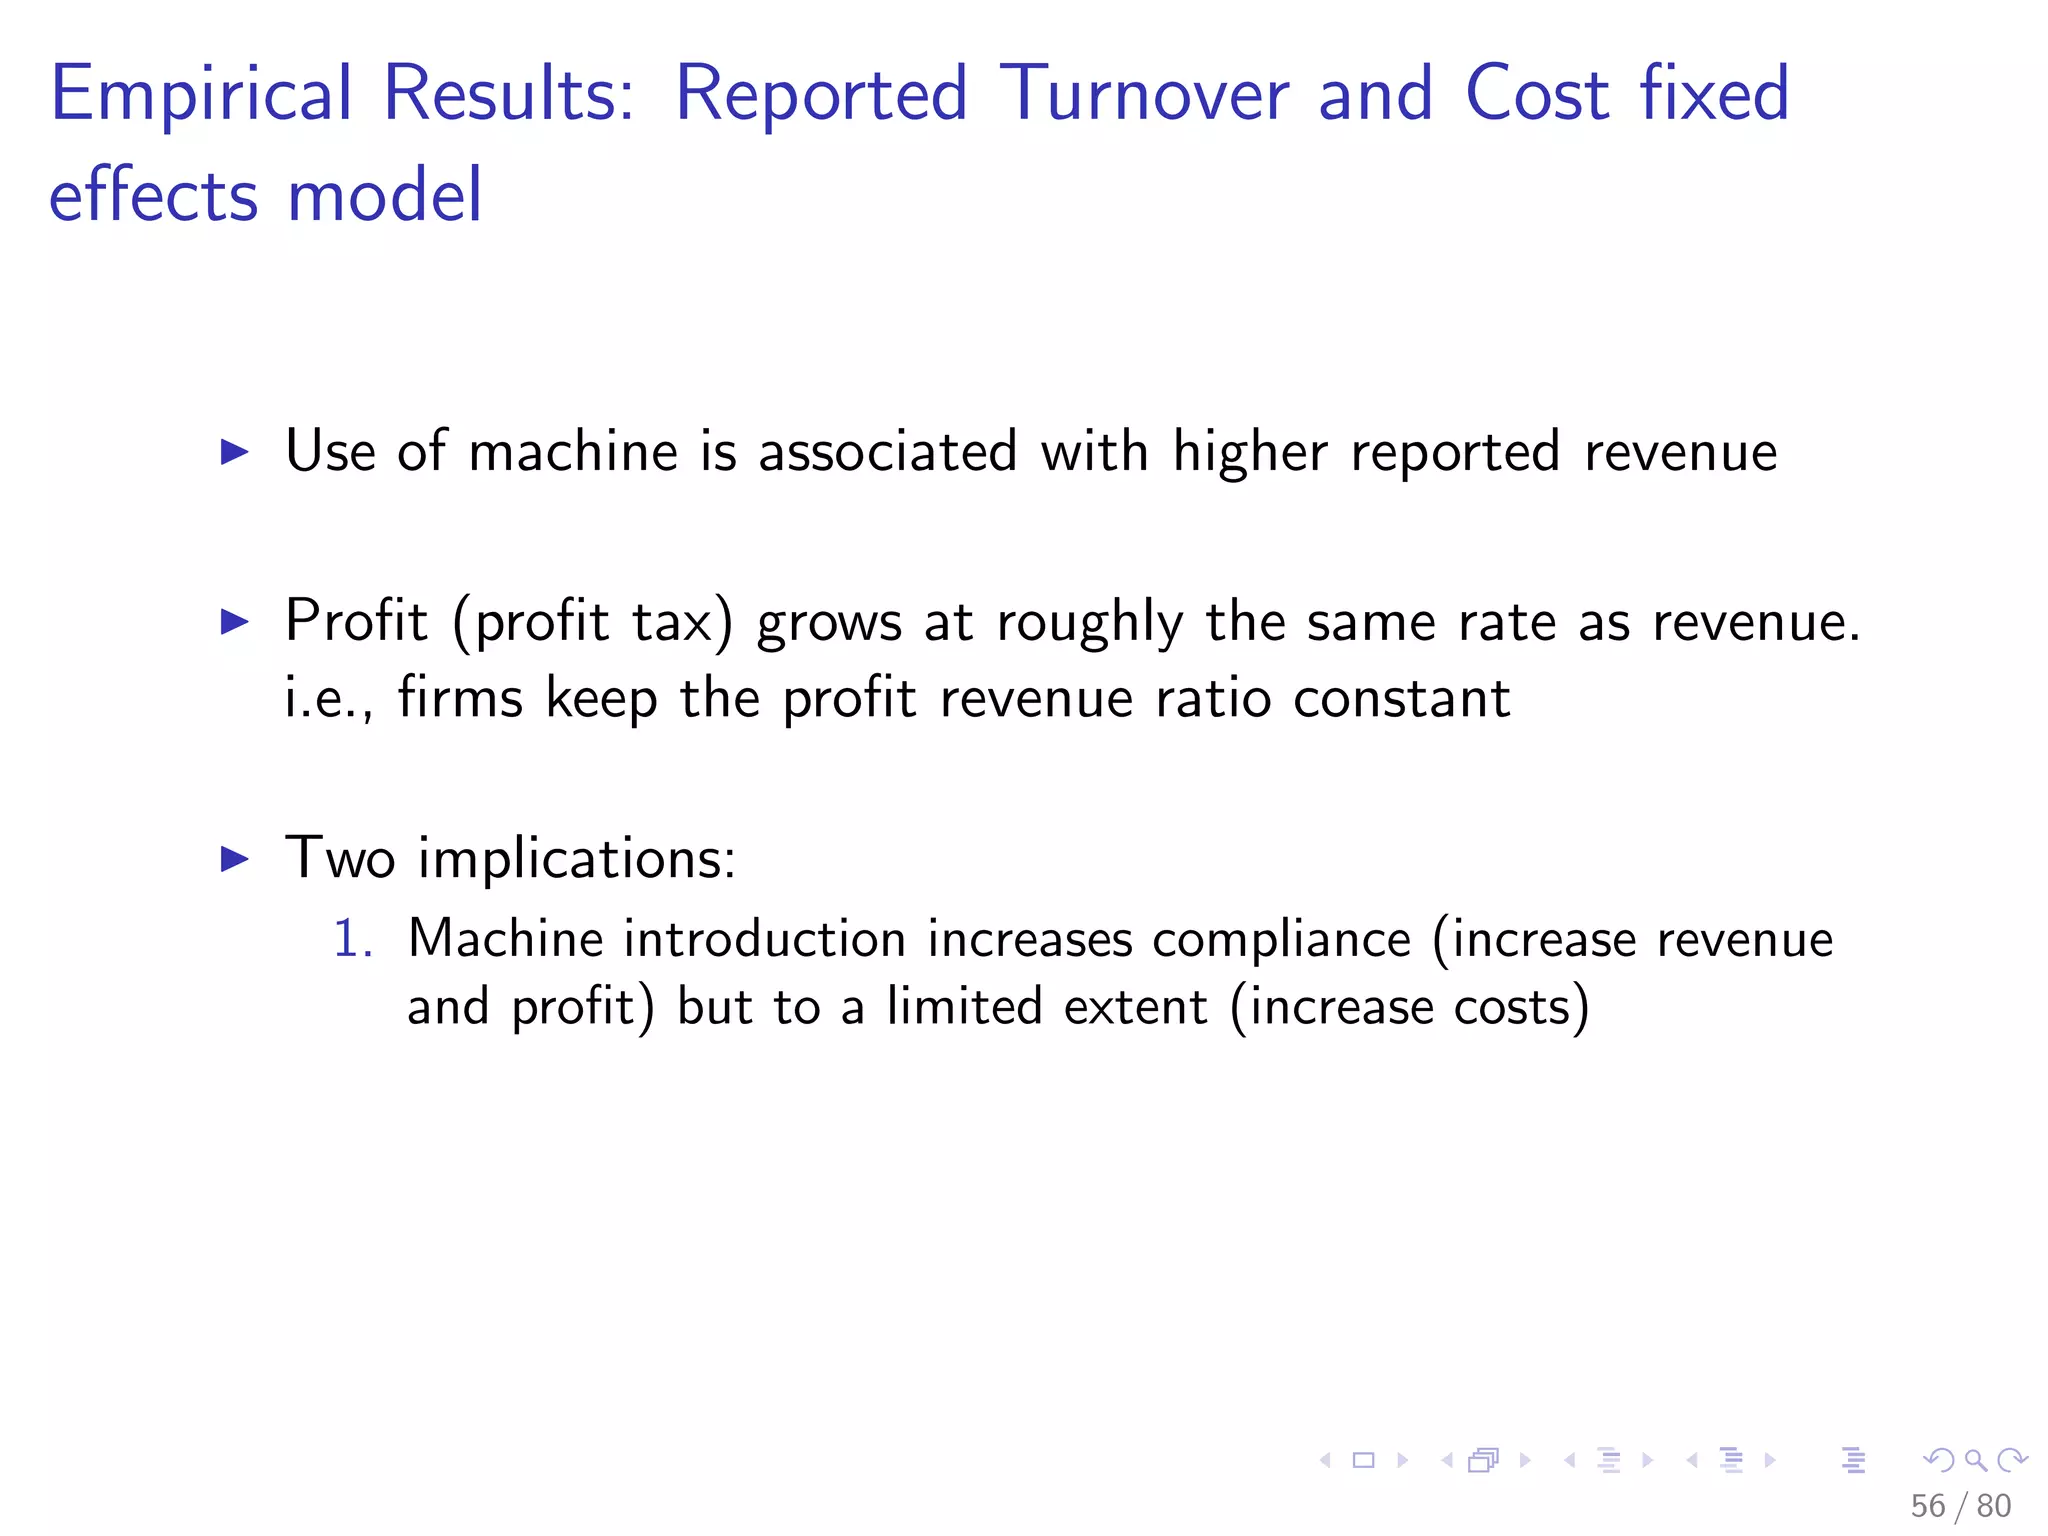
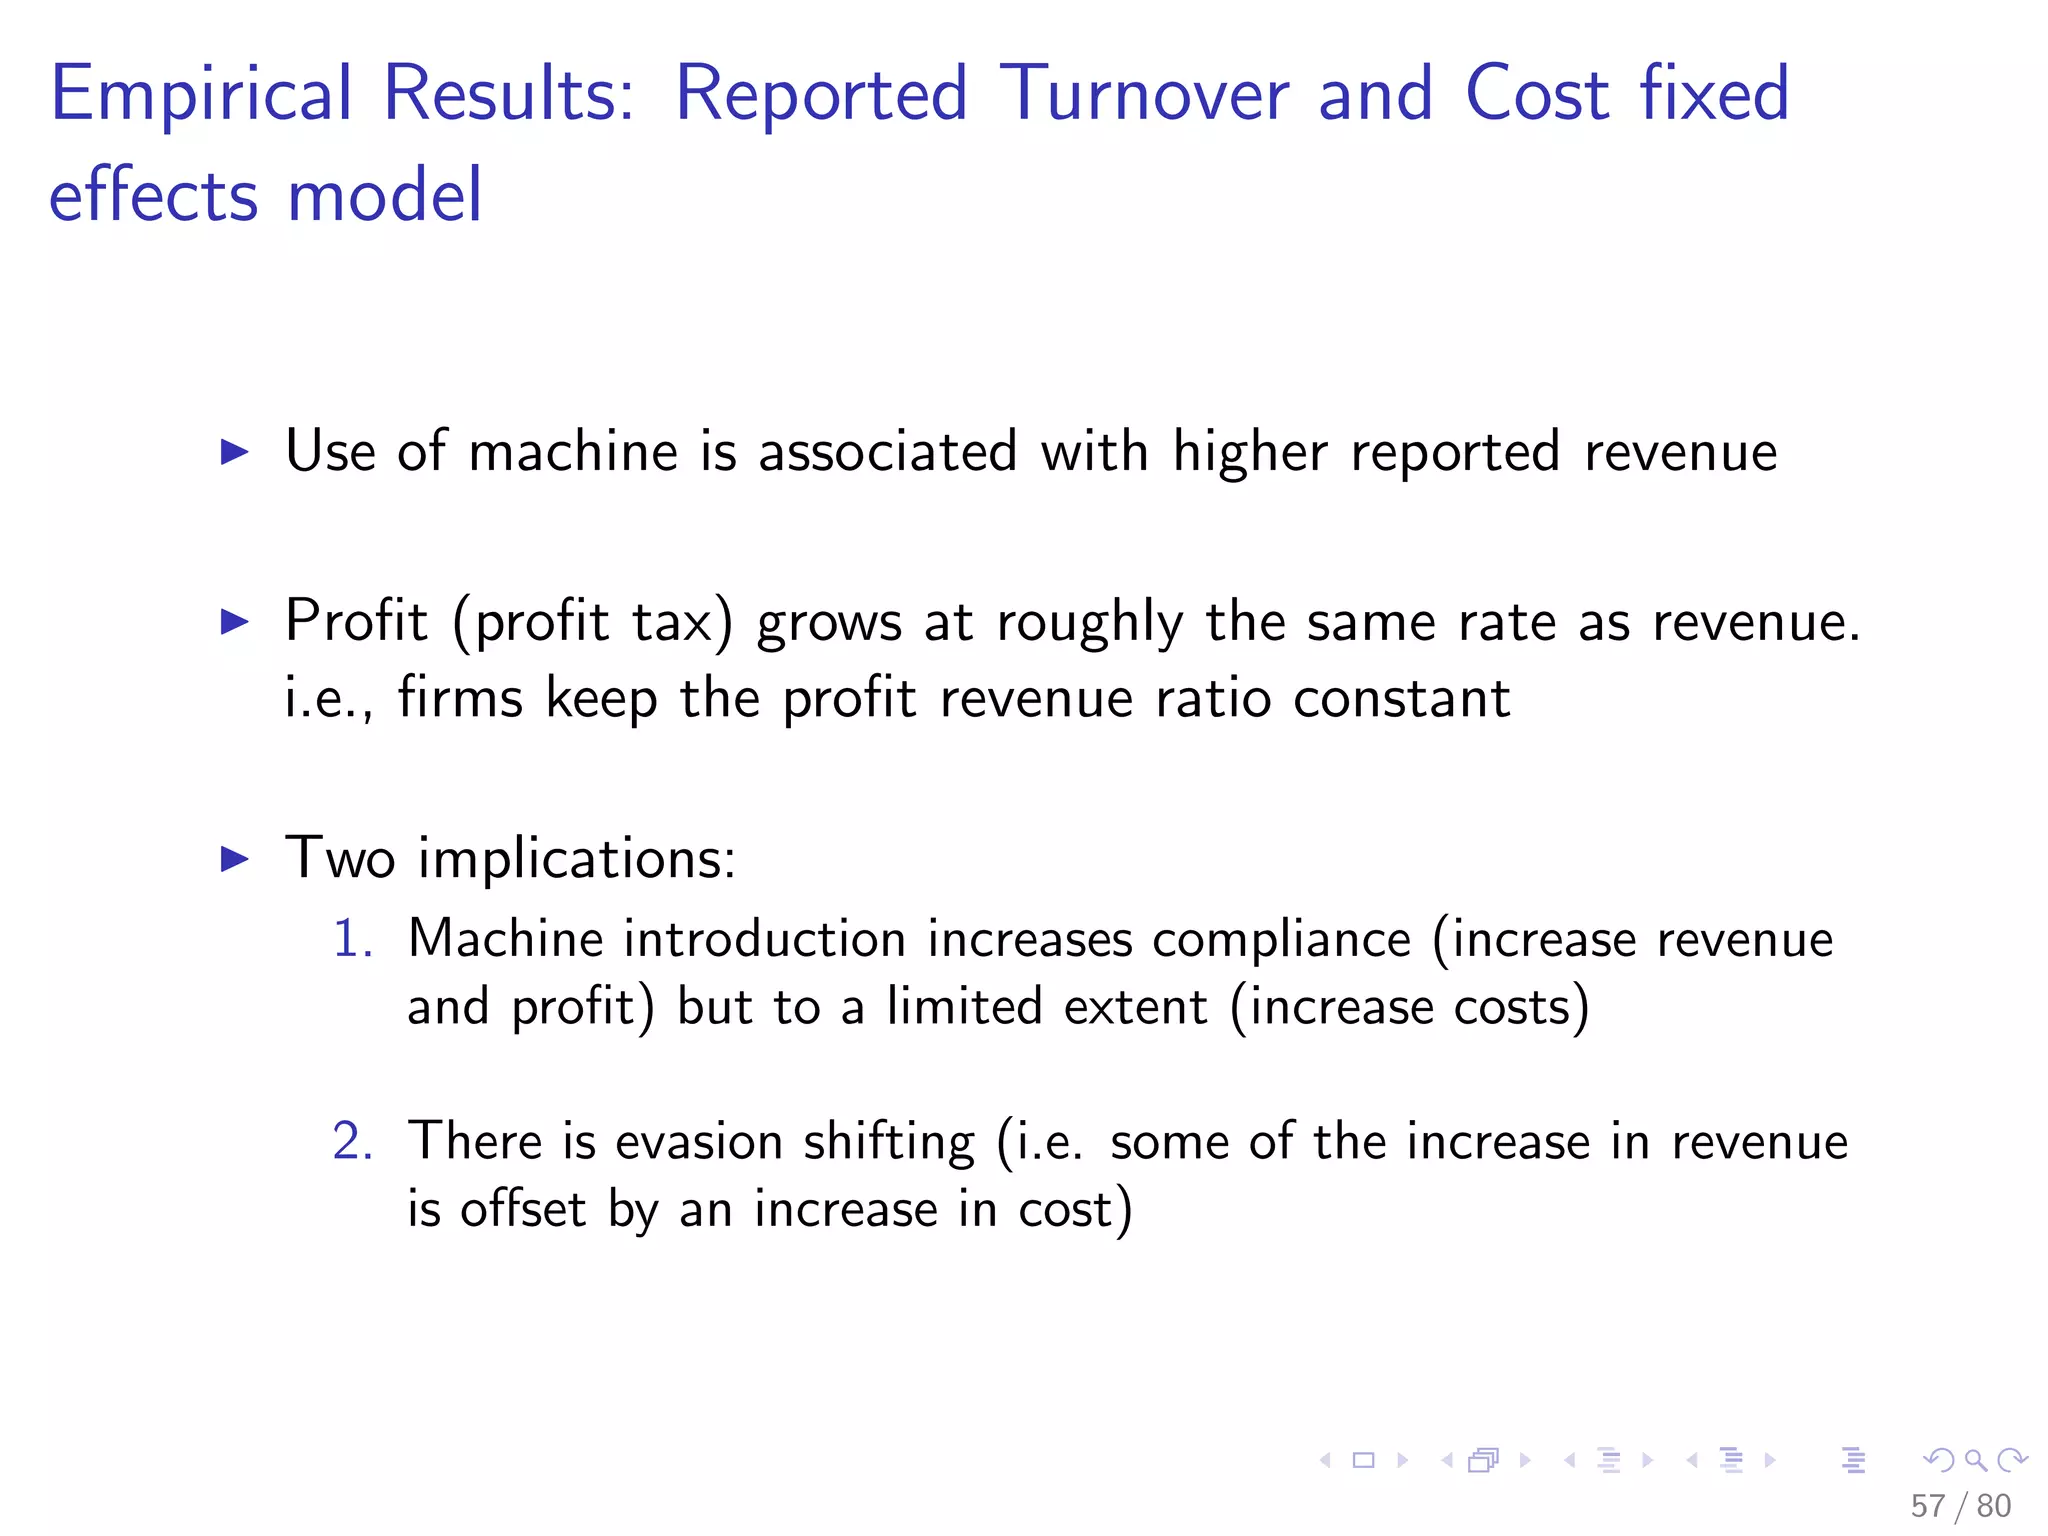
![Empirical Results: Reported Turnover and Costs fixed
effects model
Table: The response of firms to machine Introducton: declaration of
turnover and cost and profit tax (all cohorts)
All firms profit declaring firms
Turnover Cost Turnover Cost profit
post 0.51∗∗∗
0.49∗∗∗
0.40∗∗∗
0.44∗∗∗
0.28∗∗∗
[0.01] [0.01] [0.01] [0.01] [0.01]
time fixed effect Yes Yes Yes Yes Yes
R-squared 0.10 0.11 0.12 0.11 0.06
N 212928 212928 187886 187886 187886
Standard errors in brackets
∗
p < 0.1, ∗∗
p < 0.05, ∗∗∗
p < 0.01
Firm and time fixed effect are included in all regressions
58 / 80](https://image.slidesharecdn.com/3-171116091339/75/Hide-and-Seek-Taxpayers-responses-to-increased-enforcement-through-ICTs-Evidence-from-Natural-and-Field-Experiments-in-Ethiopia-58-2048.jpg)
![Empirical Results: Reported Turnover and Costs fixed
effects model 2
Table: The response of firms to machine Introducton: declaration of
turnover and cost and profit tax (all cohorts using firms that adopt the
machine by 2016 as controls)
All firms profit declaring firms
Turnover Cost Turnover Cost profit
post 0.46∗∗∗
0.44∗∗∗
0.34∗∗∗
0.37∗∗∗
0.22∗∗∗
[0.01] [0.01] [0.01] [0.01] [0.01]
time fixed effect Yes Yes Yes Yes Yes
R-squared 0.12 0.13 0.15 0.13 0.07
N 168588 168588 146249 146249 146249
Standard errors in brackets
∗
p < 0.1, ∗∗
p < 0.05, ∗∗∗
p < 0.01
Firm and time fixed effect are included in all regressions
This is a result restrcting the sample to firms that have adopted the machine
by 2016.
59 / 80](https://image.slidesharecdn.com/3-171116091339/75/Hide-and-Seek-Taxpayers-responses-to-increased-enforcement-through-ICTs-Evidence-from-Natural-and-Field-Experiments-in-Ethiopia-59-2048.jpg)
![Empirical Results: Reported Turnover and Costs fixed
effects model 2011 cohort
Table: The response of firms to machine Introducton: declaration of
turnover and cost and profit tax (2011 cohort)
All firms profit declaring firms
Turnover Cost Turnover Cost profit
post 0.28∗∗∗
0.26∗∗∗
0.25∗∗∗
0.28∗∗∗
0.19∗∗∗
[0.03] [0.03] [0.02] [0.02] [0.03]
time fixed effect Yes Yes Yes Yes Yes
R-squared 0.14 0.14 0.18 0.17 0.05
N 47110 47110 30024 30024 30024
Standard errors in brackets
∗
p < 0.1, ∗∗
p < 0.05, ∗∗∗
p < 0.01
Firm and time fixed effect are included in all regressions
This is a result comparing firms that adopt in 2011 with those that adopt in
later years
60 / 80](https://image.slidesharecdn.com/3-171116091339/75/Hide-and-Seek-Taxpayers-responses-to-increased-enforcement-through-ICTs-Evidence-from-Natural-and-Field-Experiments-in-Ethiopia-60-2048.jpg)
![Empirical Results: Reported Turnover and Costs fixed
effects model 2012 cohort
Table: The response of firms to machine Introducton: declaration of
turnover and cost and profit tax (2012 cohort)
All firms profit declaring firms
Turnover Cost Turnover Cost profit
post 0.64∗∗∗
0.61∗∗∗
0.49∗∗∗
0.53∗∗∗
0.36∗∗∗
[0.02] [0.02] [0.02] [0.02] [0.02]
time fixed effect Yes Yes Yes Yes Yes
R-squared 0.09 0.08 0.07 0.06 0.04
N 59977 59977 53790 53790 53790
Standard errors in brackets
∗
p < 0.1, ∗∗
p < 0.05, ∗∗∗
p < 0.01
Firm and time fixed effect are included in all regressions
This is a result comparing firms that adopt in 2012 with those that adopt in
later years
61 / 80](https://image.slidesharecdn.com/3-171116091339/75/Hide-and-Seek-Taxpayers-responses-to-increased-enforcement-through-ICTs-Evidence-from-Natural-and-Field-Experiments-in-Ethiopia-61-2048.jpg)
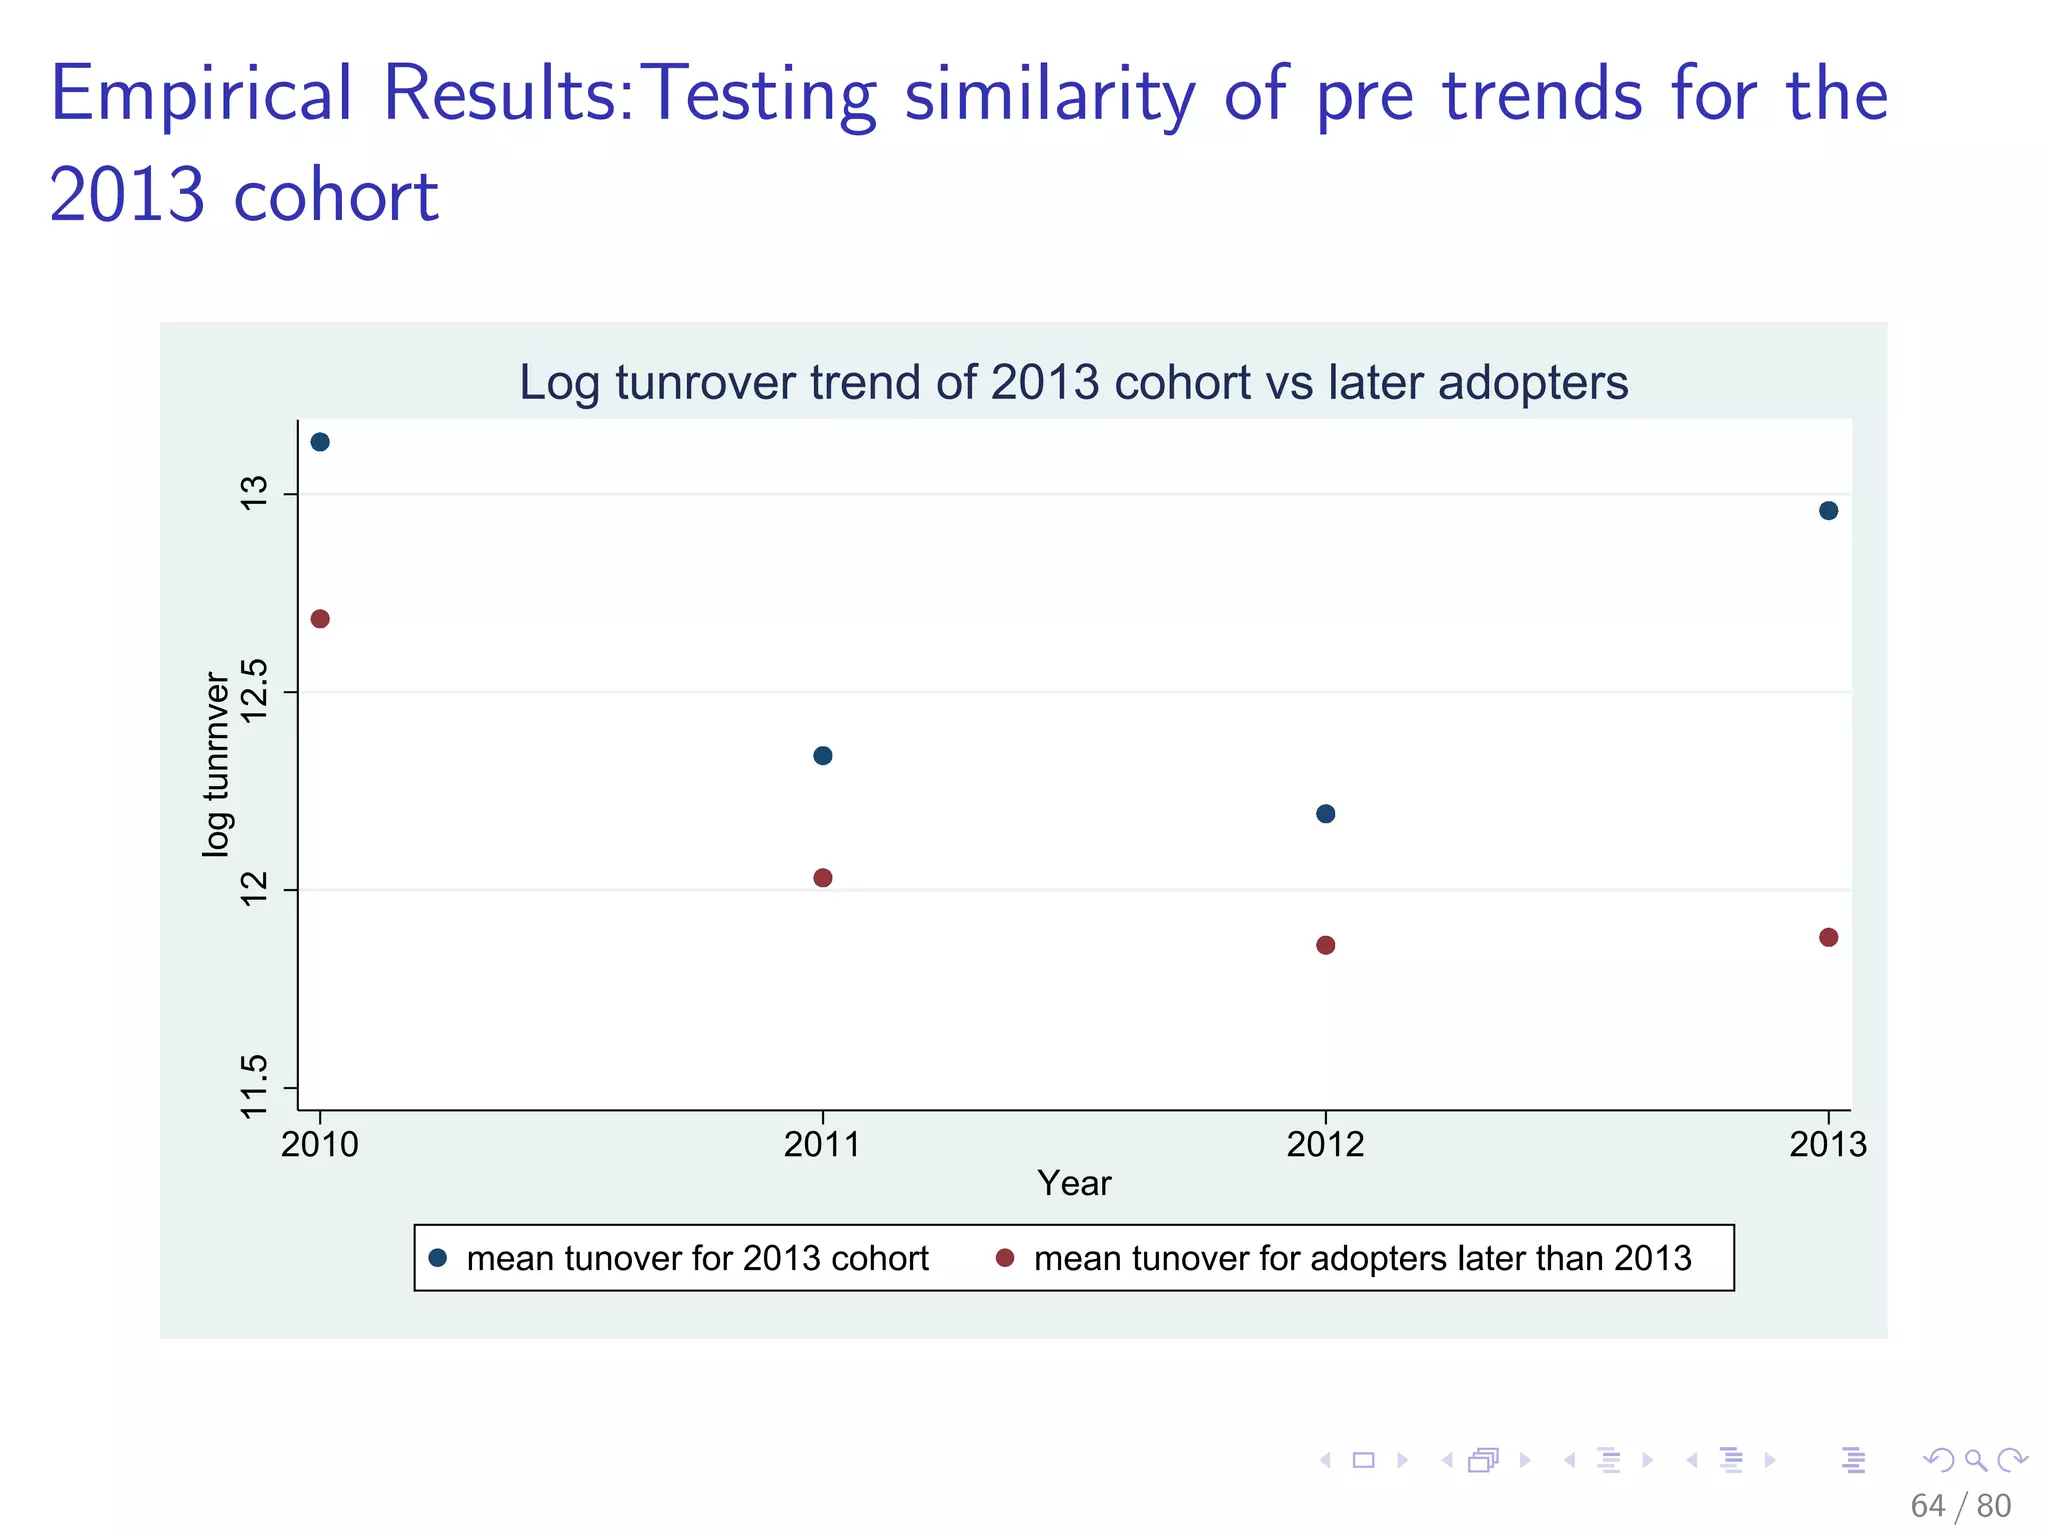
![Empirical Results: Reported Turnover and Costs fixed
effects model 2013 cohort
Table: The response of firms to machine Introducton: declaration of
turnover and cost and profit tax (2013 cohort)
All firms profit declaring firms
Turnover Cost Turnover Cost profit
post 0.56∗∗∗
0.56∗∗∗
0.48∗∗∗
0.54∗∗∗
0.33∗∗∗
[0.02] [0.02] [0.02] [0.02] [0.02]
time fixed effect Yes Yes Yes Yes Yes
R-squared 0.09 0.08 0.08 0.07 0.04
N 74594 74594 67452 67452 67452
Standard errors in brackets
∗
p < 0.1, ∗∗
p < 0.05, ∗∗∗
p < 0.01
Firm and time fixed effect are included in all regressions
This is a result comparing firms that adopt in 2013 with those that adopt in
later years
62 / 80](https://image.slidesharecdn.com/3-171116091339/75/Hide-and-Seek-Taxpayers-responses-to-increased-enforcement-through-ICTs-Evidence-from-Natural-and-Field-Experiments-in-Ethiopia-62-2048.jpg)
![Experiment Design
3120 firms in Addis Ababa (not in category C) were selected
randomly in 2013/14 [Shimeles, et al., 2017]
1000 control firms.
Two kinds of letters are sent to the firms (one cautioning
about audit and the other encouraging compliance).
The letters were sent in June 2014 just before the tax
declaration time (theerfore after all economic activity is done).
The resulting payments of profit tax for the treated group and
the 1000 control group firms are compared to analyze the
impact of treatment and machine use.
68 / 80](https://image.slidesharecdn.com/3-171116091339/75/Hide-and-Seek-Taxpayers-responses-to-increased-enforcement-through-ICTs-Evidence-from-Natural-and-Field-Experiments-in-Ethiopia-68-2048.jpg)
![Hypothesis
There is a finding in the literature that if there is already a
paper trail, increased enforcement through issuance of a letter
doesn’t have an effect [Pomeranz, 2015]
If sales registration machine has increased the paper trail and
thereofre compliance, we expect no or smaller effect of the
letter on these firms.
69 / 80](https://image.slidesharecdn.com/3-171116091339/75/Hide-and-Seek-Taxpayers-responses-to-increased-enforcement-through-ICTs-Evidence-from-Natural-and-Field-Experiments-in-Ethiopia-69-2048.jpg)
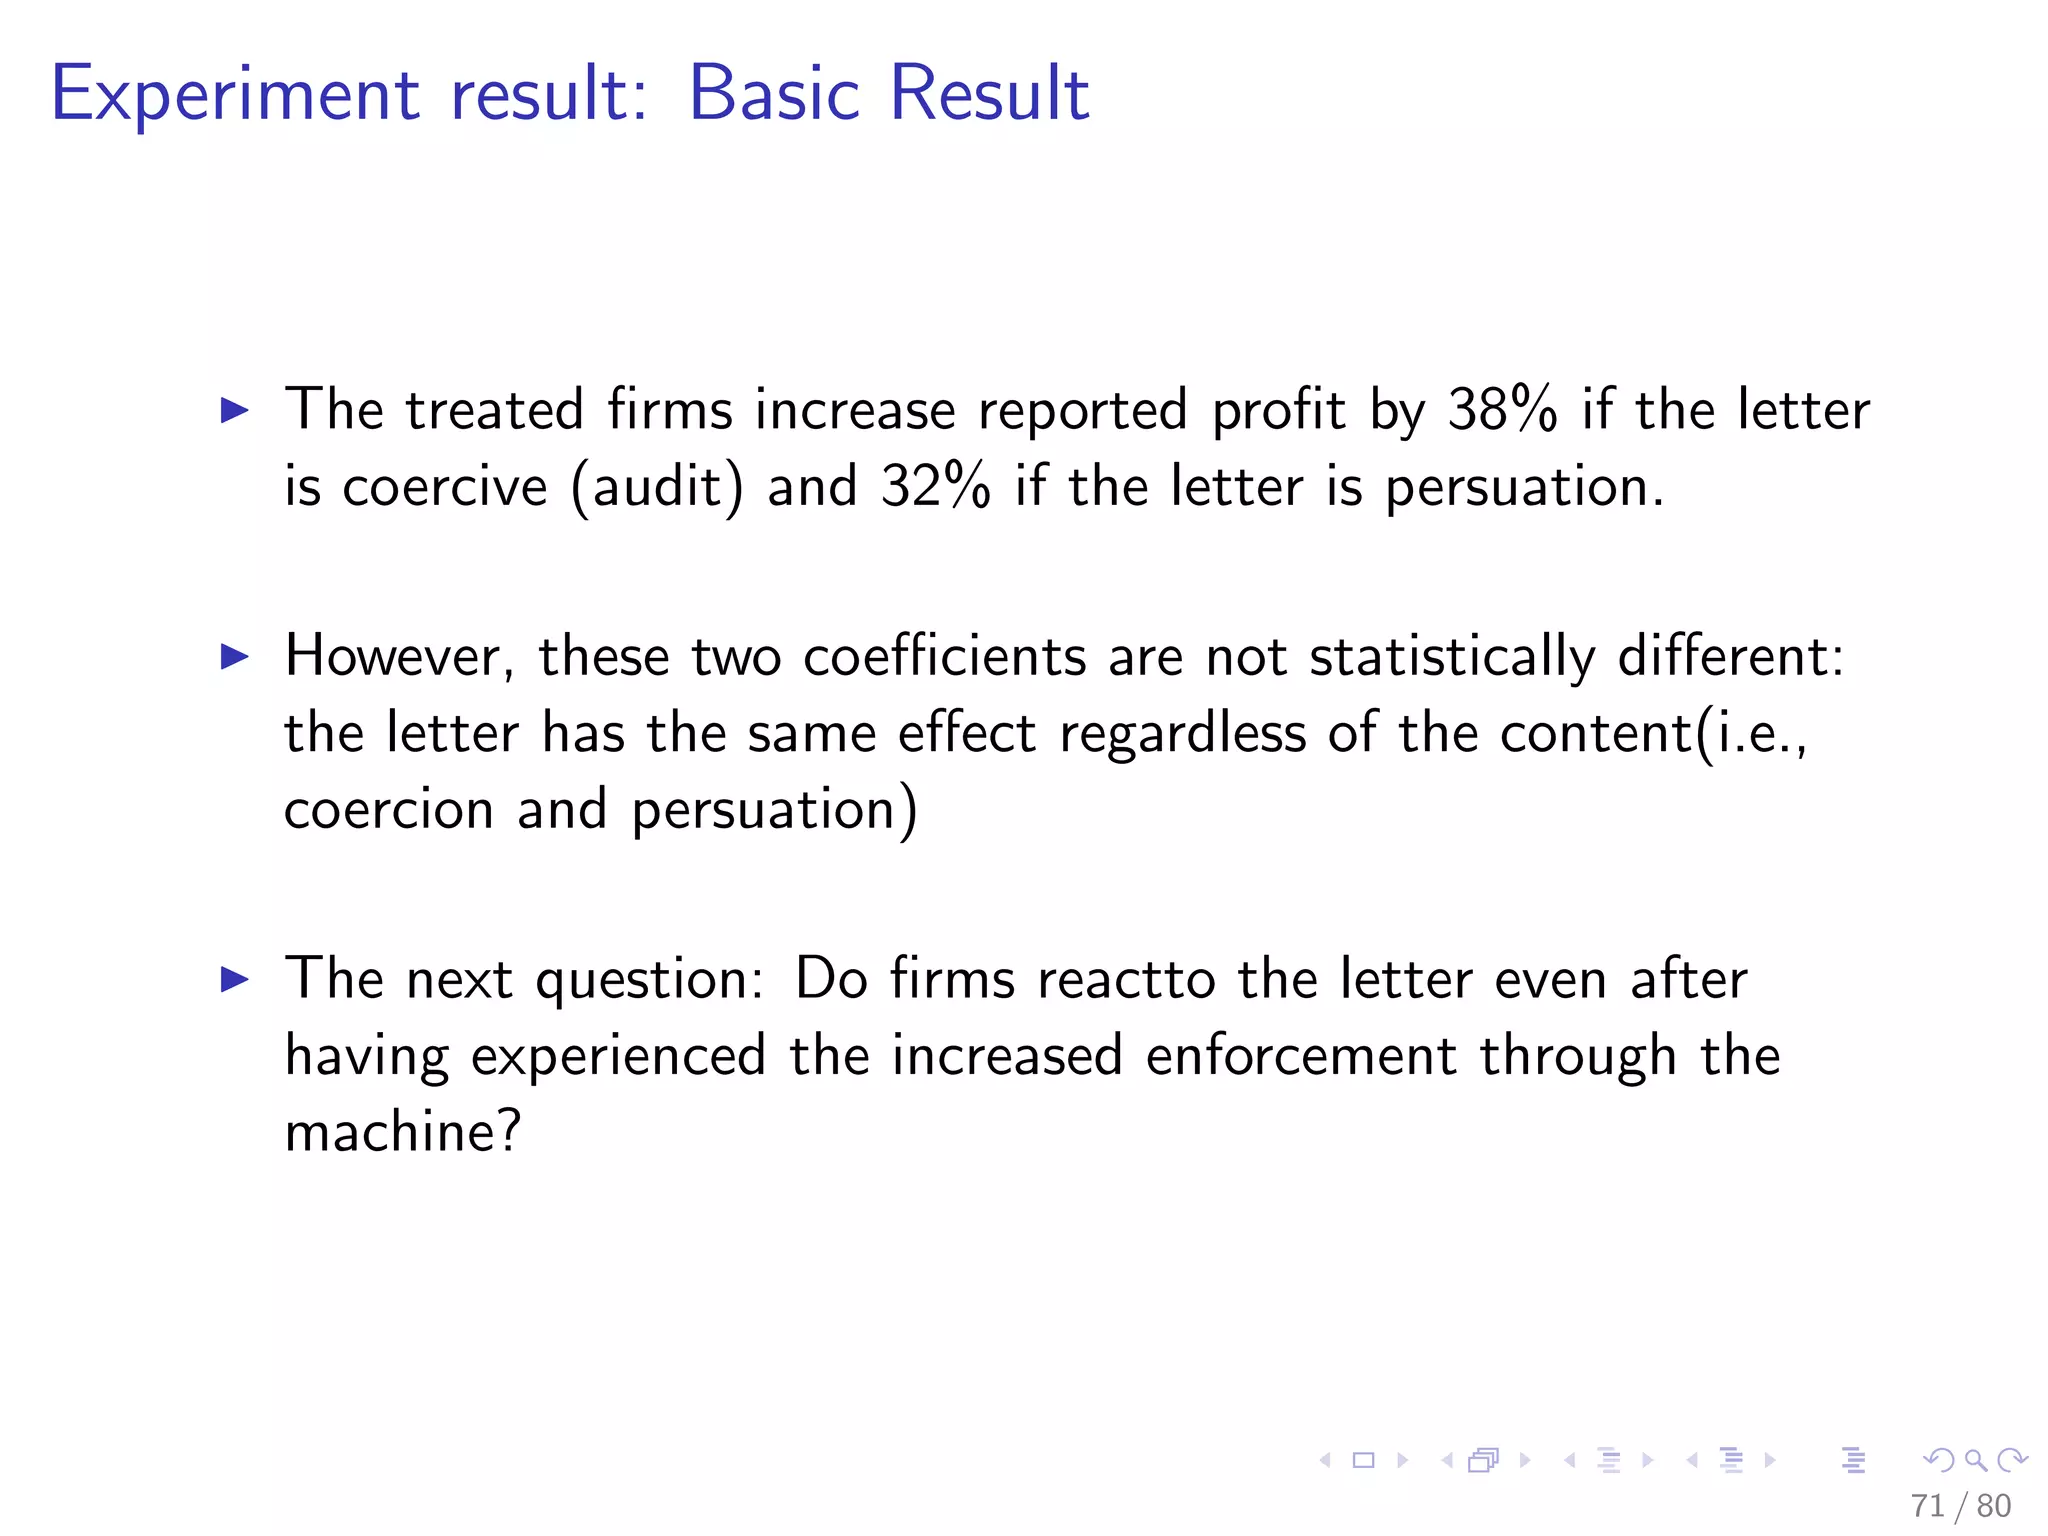
![Experiment result: Basic Result
Table: The response of profit tax to treatment
Persuasion 0.31***
[0.108]
Coercion 0.38***
[0.097]
Constant 8.40***
[0.4]
R-squared 0.237
N 2,255
Standard errors in brackets
*** p < 0.01 , ** p < 0.05 , * p< 0.1
70 / 80](https://image.slidesharecdn.com/3-171116091339/75/Hide-and-Seek-Taxpayers-responses-to-increased-enforcement-through-ICTs-Evidence-from-Natural-and-Field-Experiments-in-Ethiopia-70-2048.jpg)
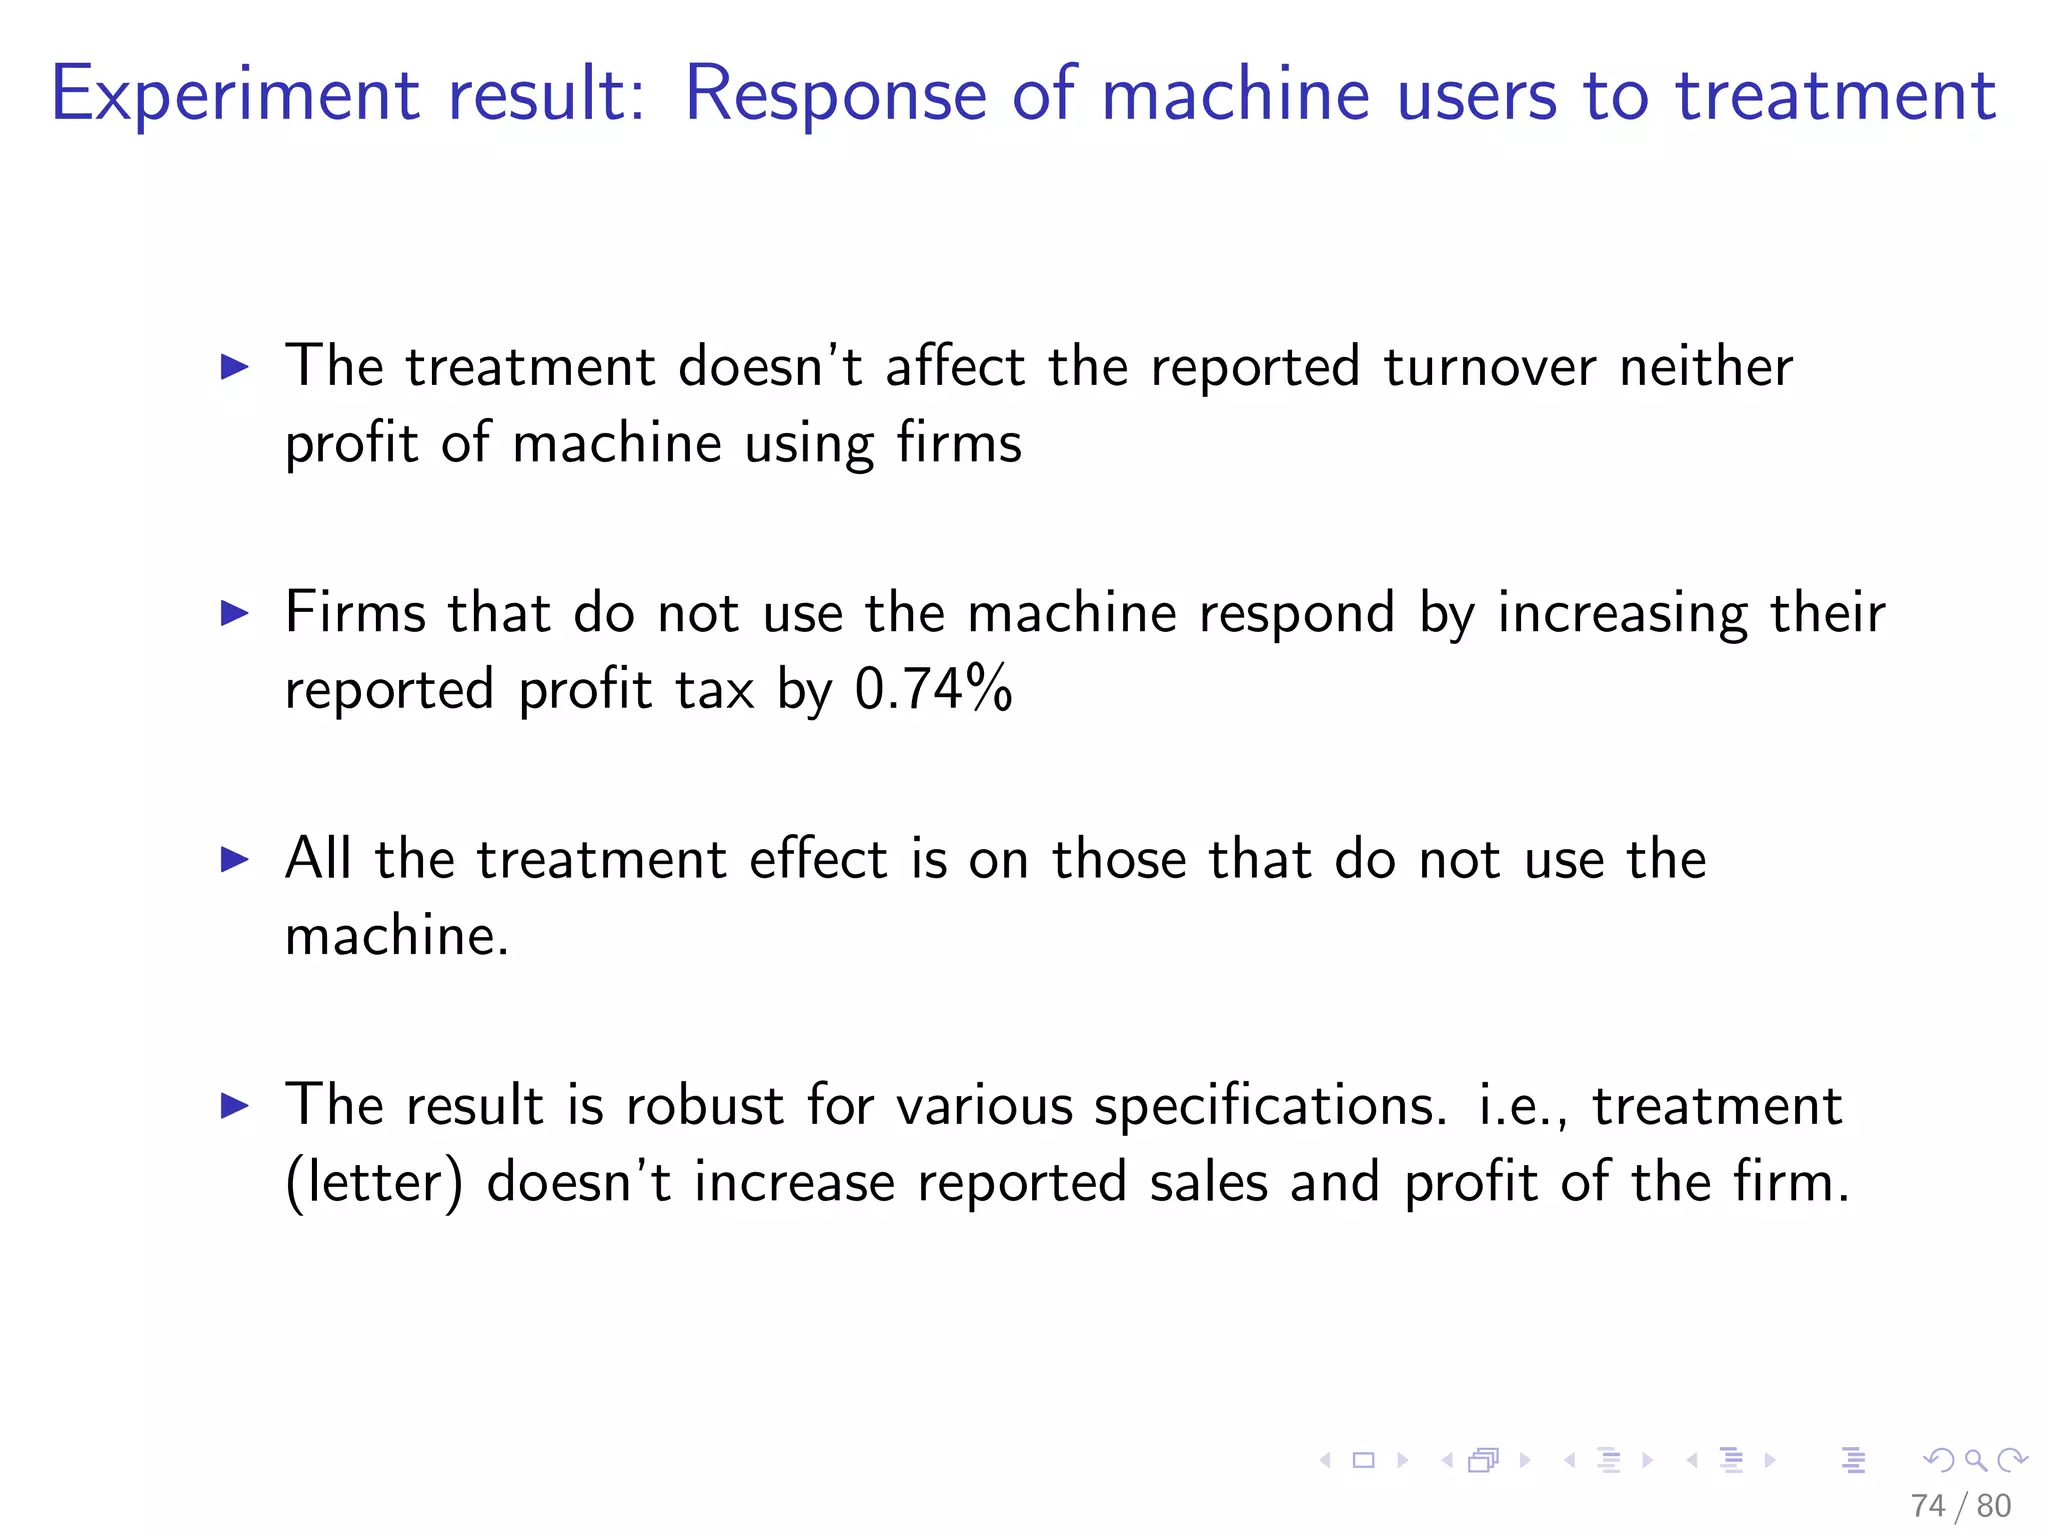
![Experiment result: Response of machine users to treatment
Table: The Impact of Treatment on Profit Tax: Differences between
machine users and non users
A B C
Treated 0.11 0.20*** 0.04
[0.11] [0.07] [0.08]
Not users of ESRM -1.40*** -0.66***
[0.13] [0.11]
treat non esrm 0.74*** 0.31**
[0.18] [0.14]
Individual -0.58*** -0.53***
[0.09] [0.10]
Top 25 % in turnover 2.93*** 2.89***
[0.08] [0.08]
Constant 8.96*** 8.90*** 9.18***
[0.12] [0.12] [0.13]
R-squared 0.494 0.216 0.506
N 2,112 2,255 2,112
Standard errors in brackets
*** p < 0.01 , ** p < 0.05 , * p< 0.1
72 / 80](https://image.slidesharecdn.com/3-171116091339/75/Hide-and-Seek-Taxpayers-responses-to-increased-enforcement-through-ICTs-Evidence-from-Natural-and-Field-Experiments-in-Ethiopia-72-2048.jpg)
![Experiment result: Response of machine users to treatment
Table: The Impact of Treatment on Turnover: Differences between
machine users and non users
Turnover (A) Turnover(B)
Treated 0.01 -0.06
[0.10] [0.07]
Not users of ESRM -0.94*** -0.59***
[0.13] [0.09]
treat non esrm 0.37** 0.26**
[0.17] [0.12]
Individual -0.27***
[0.08]
Top 25 % in turnover 3.24***
[0.06]
Constant 12.84*** 12.62***
[0.11] [0.11]
R-squared 0.234 0.645
N 2,102 2,102
Robust standard errors in parentheses
*** p<0.01 , ** p<0.05 , * p<0.1 73 / 80](https://image.slidesharecdn.com/3-171116091339/75/Hide-and-Seek-Taxpayers-responses-to-increased-enforcement-through-ICTs-Evidence-from-Natural-and-Field-Experiments-in-Ethiopia-73-2048.jpg)


The document explores the relationship between tax compliance and the use of ICTs in Ethiopia, investigating whether investments in tax administration can enhance tax-to-GDP ratios through improved enforcement and information availability. It critiques previous studies for their limitations and proposes a comprehensive study that extends existing research by analyzing income tax reporting changes post the introduction of electronic sales registration machines. Through a randomized control experiment, the authors aim to validate that these machines enhance compliance and assess potential shifts in tax evasion practices.


