Download to read offline


![90Cooperative compliance – how can businesses and tax authorities learn to trust each other?
60
In the Netherlands, no clear objectives were set and no performance measurement system was implemented from the start, thereby resulting in heated
debates on the effectiveness of horizontal monitoring and its value to both business and the tax administration.
61
See, for example, Authorized Economic Operator (AEO), US: Foreign Account Tax Compliance Act (FATCA), etc.
62
See, for example, the recent controversies surrounding Apple, Google and Starbucks.
63
See, for example, Dutch Association of Investors for Sustainable Development (VBDO), Good Tax Governance in Transition. Transcending the tax debate to
CSR ([2014]).
Tax administrations should set
measurable objectives. If it can be shown
that cooperative compliance adds value
in terms of reduced cost of compliance
and more compliant behaviour of
taxpayers, stakeholder buy-in and
enhanced cooperation would follow.60
Cooperative compliance will fail without
the buy-in of the individuals who have
to execute it. The civil servants of the
tax administration must be trained
properly in this audit approach, and
tax inspectors provided with tools,
guidelines and a legal framework.
The cornerstone of cooperative
compliance is that tax administrations
can “trust” the information provided by
a taxpayer is right. We do not believe
in credible and sustainable cooperative
compliance if the boundaries of the rules
when “trust” becomes “justified trust”
are not set. A legitimate approach exists
when guiding principles, regulations
or law reduce the compliance burden
by “regulating” part of the cooperative
compliance model.
In addition to boundaries on the
concept of TCF, it is possible to think
of technology-based alternatives of
regulated self-assessment, some of
which already exist.61
This could prove
to be a significant advantage for both
tax administrations and taxpayers, as
this would provide clear guidance for
internal and external auditors.
Taxpayers, have a legal obligation
to install a functioning TCF, as they
are responsible for filing proper tax
returns. However, taxpayers are, in
nearly all cases, not legally bound to
provide information outside the legal
framework of a general tax act and it is
this extra-statutory information that is
likely to be necessary for cooperative
compliance. Although the voluntary
nature of the provision of such
information fits well in a relationship
based on “trust and transparency”, the
rules of good corporate governance
prescribe that risks should be mitigated
and shareholder value protected.
Consequently, the cooperative
compliance system should have
“noticeable value” for taxpayers;
to leave this at the discretion of the
individual tax inspector may prove
inefficient. In line with regulated
self-assessment, consideration should
be given to safeguarding taxpayers’
rights by implementing regulations on
the effective audit approach under a
cooperative compliance system.
Most companies want to be tax
compliant in the most efficient way
and cooperative compliance could be
a way of achieving this objective. Until
recently, tax was just regarded by most
companies as a cost.62
Discussions on
the tax behaviour of multinational
enterprises (MNEs) have changed this
and put tax governance more at the
forefront.63
Communication on taxpayers’ tax
governance, objectives and vision on
tax is important in building trust. The
board and senior management must,
therefore, have the intrinsic will to be
transparent regarding tax and to be
compliant.
The concept of a TCF is a part of a
taxpayer’s general risk and compliance
environment. Thinking of tax as more
than just “costs” means that taxpayers
may have to reconsider their current
tax compliance infrastructure. The
past approach was that tax returns
were deemed to be right until a tax
official came with an adjustment. Now a
taxpayer should be able to demonstrate
that data in the relevant tax returns are
right. This may require investment in
processes, systems and people.
Nothing is more detrimental to
a relationship built on trust and
transparency than mismanaged
expectations. We are aware of examples
when voluntarily provided information
resulted in penalties and data mining
exercises by the competent authority. A
taxpayer should develop a reporting and
working process around cooperative
compliance with clear deliverables
for both the company and the tax
administration. Of course, if cooperative
compliance was regulated by way of
self-assessment with a clear operating
approach, this would not be necessary.
Conclusions
The concept of enhanced relationship
has recently been transformed into
one of cooperative compliance. We
believe that this is not the end of
the transformation yet. In order to
make cooperative compliance work,
boundaries must be defined on the
concept of TCF to legitimise “trust”.
Clear objectives must also be set and
measured against performance.
We are strongly of the opinion that no
one benefits from a dysfunctional tax
compliance system. All parties involved
should, therefore, be open to any
suggestions to improve tax compliance,
even if it may mean a form of regulation
of the cooperative compliance concept.](https://image.slidesharecdn.com/pwc-paying-taxes-2015-high-resolution-141125021135-conversion-gate02/85/Pwc-Paying-Taxes-2015-89-320.jpg)


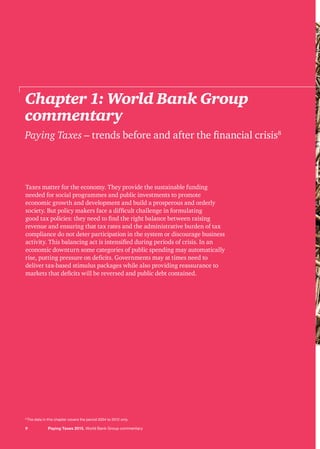
![132Appendix 1: Methodology and example calculations
Figure A1.1
How the non-linear transformation affects the distance to frontier score for the Total Tax Rate
Note: The non-linear distance to frontier for the Total Tax Rate is equal to the distance to frontier for the Total Tax Rate to the power of 0.8.
Source: Doing Business database.
DTF for the time to comply and the
number of payments is computed as:
100 * (max – y) / (max – min)
Where y := sub-indicator value
for a given economy
DTF for the Total Tax Rate (TTR) is
computed as:
TTRDTF
= 100 * [(max – y) /
(max – min)] 0.8
for TTR above the 15th percentile.
For a TTR value below the 15th
percentile, TTRDTF
is set at 100.
The overall Paying Taxes DTF will
then take the form;
Paying TaxesDTF
= 1/3 [TTRDTF
+
TimeDTF
+ Payments DTF
]
10%0 20% 30% 40% 50% 60% 70% 80% 90% 100%
Distance to frontier
A
C
B
D
Total Tax Rate
Distance to frontier
for Total Tax Rate –
linear
Distance to frontier
for Total Tax Rate –
non-linear
100
80
60
40
20
0
Distance to frontier (DTF)](https://image.slidesharecdn.com/pwc-paying-taxes-2015-high-resolution-141125021135-conversion-gate02/85/Pwc-Paying-Taxes-2015-137-320.jpg)


The Paying Taxes 2015 report measures the ease of tax compliance across 189 economies, revealing that it takes an average of 264 hours to comply with taxes, involving 25.9 payments and an average total tax rate of 40.9%. The report highlights ongoing challenges in tax reform amid global economic changes and emphasizes the need for governments to balance revenue collection with incentivizing economic growth and investment. Additionally, the study examines the impact of electronic filing and tax systems on compliance burdens, with varying results across different regions.


