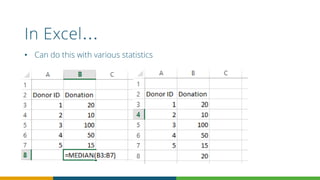
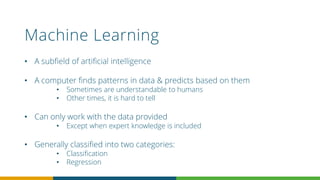
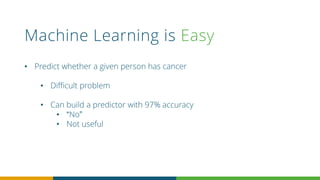
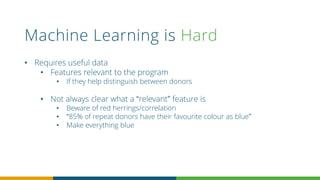
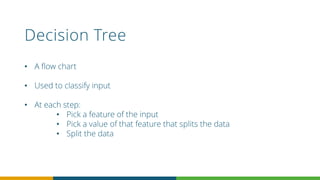
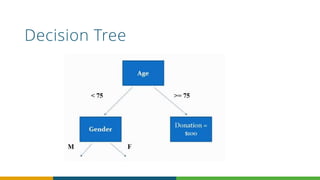
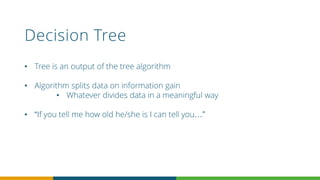
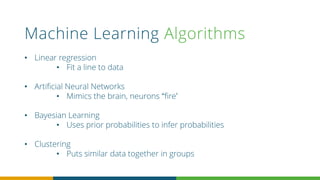
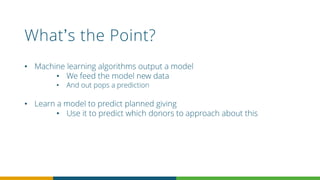
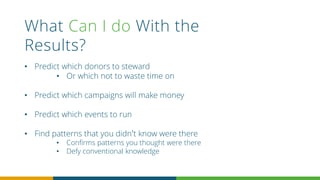
2. OUTLINE:
• What is data?
• What data should you collect?
• What can data do for you?
• How do you analyze data?
3. What Is Data?
• Pieces of information (One piece = a datum)
• Can be qualitative or quantitative
• Age = 34 Quantitative
• Demeanor = Happy Qualitative
• Quantitative is the easiest to work with
• Qualitative can be categorized
• “Friendly” = 2
• ‘Aggressive” = 1
4. What Data is Useful?
• Most data is useful
• Anything that can be used to distinguish between donors
• Or events
• Or appeals
• Anything that you would like to know about donors
• Or events
• Or appeals
5. Sample Data
LAUNCH GROWTH MATURITY
DIRECT EMAIL
• Opt- in email list
• Professional
association lists
• Symposium & events
6. What Data to Record
• Good Features
• Split data in interesting ways
• Gender, age, location, date, income
• “Bad” Features
• Provide little information
• Name, ID number, phone number
• “Growing Features”
• Email, address, postal code
7. Dirty Data
• Data that must be “cleaned” in order to be processed
• ID’s that are not unique (duplicate records)
• Mixed up collumns
• Ambiguous terms
• Missing fields
• Campaigns referenced in multiple ways
• “Fall fundraiser 2013”
• FF2013
8. Keep Your Data Clean
• Enforce standards
• Unique ID’s
• Defined names (for campaigns, events, appeals)
• Include fail-safes
• Search for duplicates
• Emphasize the importance of data to everyone
• “That’s not important”
• Disconnect between data entry & data analysis
9. What Can Data do for You
• Increase your fundraising knowledge
• With respect to your particular area
• That’s nice, how does that help?
• Saving money through:
• Targeted campaigns
• Eliminating unprofitable campaigns
10. Simple Analysis
• “We are drowning in data but starving for information’
• John Naisbitt
• We want to make informed insights from data
• To do this you need years of training in statistics, data
processing and machine learning
• Not really
11. Simple Analysis
• What is the average donation?
• Within a given campaign
• Within a geographic area
• Within a gender
• What campaigns generate the most new donors?
• Which are best at keeping donors?
• Numbers can surprise you
14. Recency/Frequency/Monetary
• Sort your donors by:
• Recency: The last time they donated
• Frequency: How many times they’ve donated
• Monetary: How much they have donated
• Bucket donors in each category:
• 5 buckets
• Donor X is R=4, F=3, M=5
• 80% of donations come from top 20%
16. Sophisticated Analysis
• Basic statistics give valuable information
• Historical information
• But what if we want to predict what donors will do?
• Or how profitable a campaign was
• Patterns in data can provide statistical bias for predictions
• Machine learning can find these patterns
17. Machine Learning
• A subfield of artificial intelligence
• A computer finds patterns in data & predicts based on them
• Sometimes are understandable to humans
• Other times, it is hard to tell
• Can only work with the data provided
• Except when expert knowledge is included
• Generally classified into two categories:
• Classification
• Regression
18. Machine Learning is Easy
• Predict whether a given person has cancer
• Difficult problem
• Can build a predictor with 97% accuracy
• “No”
• Not useful
19. Machine Learning is Hard
• Requires useful data
• Features relevant to the program
• If they help distinguish between donors
• Not always clear what a “relevant” feature is
• Beware of red herrings/correlation
• “85% of repeat donors have their favourite colour as blue”
• Make everything blue
20. Decision Tree
• A flow chart
• Used to classify input
• At each step:
• Pick a feature of the input
• Pick a value of that feature that splits the data
• Split the data
22. Decision Tree
• Tree is an output of the tree algorithm
• Algorithm splits data on information gain
• Whatever divides data in a meaningful way
• “If you tell me how old he/she is I can tell you…”
23. Machine Learning Algorithms
• Linear regression
• Fit a line to data
• Artificial Neural Networks
• Mimics the brain, neurons “fire’
• Bayesian Learning
• Uses prior probabilities to infer probabilities
• Clustering
• Puts similar data together in groups
24. What’s the Point?
• Machine learning algorithms output a model
• We feed the model new data
• And out pops a prediction
• Learn a model to predict planned giving
• Use it to predict which donors to approach about this
25. What Can I do With the
Results?
• Predict which donors to steward
• Or which not to waste time on
• Predict which campaigns will make money
• Predict which events to run
• Find patterns that you didn’t know were there
• Confirms patterns you thought were there
• Defy conventional knowledge
26. Strange Data Examples
• Big Bang radiation
• Ozone layer hole
• UPS route changes
• Canada Post
• Paralyzed veterans