The document summarizes a study that examined the effects of a unilateral gluteal activation protocol on single leg drop jump performance. The study found:
1) Significant differences in contact time, peak ground reaction force, and flight time between the baseline day and when the gluteal exercises were performed, but no difference between the exercise day and a third baseline day, suggesting the improvements were due to practice not the exercises.
2) Using a typical error analysis to examine individual responses, there was no discernible pattern of enhancement or fatigue for any participant from the gluteal exercises.
3) In conclusion, the gluteal activation protocol did not acutely improve single leg drop jump performance beyond potential learning effects
EFFECTS OF STRENGTH TRAINING ON SQUAT AND SPRINT PERFORMANCE IN SOCCER PLAYERSFernando Farias
We have demonstrated that a simple in-season strength training program resulted in an improvement in maximal back squat performance, which was reflected in improve- ments in short sprint performance, as identified by a decrease in sprint time over 5, 10, and 20 m, in professional soccer players, in line with the hypotheses. Furthermore, the changes in relative 1RM squat strength demonstrate strong associations with the changes in 5 (r = 0.62), 10 (r = 0.78), and 20-m (r = 0.60) sprint performances.
The effect of instability training on knee joint proprioception and core stre...Fernando Farias
A general 10-week IT program utilizing Swiss balls and body mass as a resistance proved effective for improving knee proprioception as well as trunk flexion and extension strength in previously inactive individuals. The present study demonstrates that the use of body weight as a resis- tance under unstable conditions can provide significant improvements in knee proprioception (for as long as 9 months after training) and trunk strength for the untrained population that should contribute to general health and functionality.
Melhorar ou até mesmo manter o desempenho atlético em jogadores de esportes de equipe competitivos durante o longo período da temporada é um dos maiores desafios para qualquer treinador comprometido. Tempo muito limitado está disponível entre as partidas semanais para introduzir sessões intensivas de treinamento de força e poder, com uma freqüência normal de 1-2 unidades por semana. Este fato estimula a busca de métodos de treinamento mais eficientes capazes de melhorar uma ampla variedade de habilidades funcionais, evitando ao mesmo tempo os efeitos de fadiga.
Epidemiological studies have consistently shown hamstring
strain injuries (HSIs) to have a high prevalence rate in many
sports, such as sprinting (11%; Lysholm & Wiklander, 1987),
Australian Rules Football (16–23%; Orchard, 2001; Orchard,
Marsden, Lord, & Garlick, 1997) and football (12–14%:
Ekstrand, Hagglund, & Walden, 2011; Hawkins, Hulse,
Wilkinson, Hodson, & Gibson, 2001). The epidemiology and
aetiology of HSI in football has received extensive attention in
the scientific literature (Ekstrand et al., 2011; Woods et al., 2004),
given the economic burden associated with professional
players missing training and competitive fixtures (Woods,
Hawkins, Hulse, & Hodson, 2002). b
Acute effect of different combined stretching methodsFernando Farias
The purpose of this study was to investigate the acute effect of different stretching methods, during a warm-up,
on the acceleration and speed of soccer players. The acceleration performance of 20 collegiate soccer players (body height:
177.25 ± 5.31 cm; body mass: 65.10 ± 5.62 kg; age: 16.85 ± 0.87 years; BMI: 20.70 ± 5.54; experience: 8.46 ± 1.49
years) was evaluated after different warm-up procedures, using 10 and 20 m tests. Subjects performed five types of a
warm-up: static, dynamic, combined static + dynamic, combined dynamic + static, and no-stretching. Subjects were
divided into five groups. Each group performed five different warm-up protocols in five non-consecutive days. The
warm-up protocol used for each group was randomly assigned. The protocols consisted of 4 min jogging, a 1 min
stretching program (except for the no-stretching protocol), and 2 min rest periods, followed by the 10 and 20 m sprint
test, on the same day. The current findings showed significant differences in the 10 and 20 m tests after dynamic
stretching compared with static, combined, and no-stretching protocols. There were also significant differences between
the combined stretching compared with static and no-stretching protocols. We concluded that soccer players performed
better with respect to acceleration and speed, after dynamic and combined stretching, as they were able to produce more
force for a faster execution.
The effects of self-myofascial release using a foam roll or roller massager on joint range of motion, muscle recovery, and performance: a systematic review
Training the vertical jump to head the ball in soccer Fernando Farias
IN MODERN SOCCER, HEADING
THE BALL IS BOTH AN OFFENSIVE
TOOL USED TO SCORE GOALS
AND A DEFENSIVE MEASURE
AGAINST OPPOSING TEAMS. PRO-
FICIENCY IN HEADING THE BALL
REQUIRES PROPER TECHNIQUE IN
CONJUNCTION WITH AN EFFEC-
TIVE VERTICAL JUMP. THE AIM OF
THIS ARTICLE IS TO ADDRESS THE
FACTORS INVOLVED IN VERTICAL
JUMP PERFORMANCE AND HOW
THEY RELATE SPECIFICALLY TO
HEADING THE BALL
Nossos dados sugerem que um macrociclo com ênfase na capacidade técnica e tática foi capaz de promover aumentos no desempenho físico e tático de jovens jogadores de futebol em situações reais de disputa. Assim, a distribuição das cargas de treinamento utilizadas neste estudo, além de possibilitar uma formação mais específica e contextual, proporcionou um aumento da intensidade do jogo no final da temporada, variável diretamente relacionada ao resultado do jogo (17). Além disso, verificou-se que o protocolo de treinamento causou reduções nos marcadores de danos musculares, revelando um estímulo benéfico para o sistema muscular, o que pode contribuir para a prevenção de lesões por sobreentrenamento ao longo da temporada. Apesar da importância bem documentada da avaliação de parâmetros sangüíneos (ie, marcadores de dano) durante a prática de futebol (3, 4, 23, 29), verificamos que a redução relacionada foi associada com maior taxa de trabalho durante o jogo, Através de um treinamento técnico-tático de periodização, mostrando a importância do monitoramento desses parâmetros em longo prazo.
The hamstring muscle group is the most frequently injured, representing
approximately 12 to 24% of all athletic injuries.1,2 These injuries may be due to
disproportionate training performed for the quadriceps,3 with hamstring strains
occurring more frequently in those who demonstrated hamstring weakness, and
lower hamstring-to-quadriceps strength ratios.2 Thus, hamstring strength is impor-
tant for athletic performance and injury prevention in a variety of sports.
Is Postexercise muscle soreness a valid indicator of muscular adaptations?Fernando Farias
DELAYED ONSET MUSCLE SORE- NESS (DOMS) IS A COMMON SIDE EFFECT OF PHYSICAL ACTIVITY, PARTICULARLY OF A VIGOROUS NATURE. MANY EXERCISERS WHO REGULARLY PERFORM RESISTANCE TRAINING CONSIDER DOMS TO BE ONE OF THE BEST INDICATORS OF TRAINING EFFECTIVENESS, WITH SOME RELYING UPON THIS SOURCE AS A PRIMARY GAUGE. THIS ARTICLE DISCUSSES THE RELEVANCE OF USING DOMS TO ASSESS WORKOUT QUALITY.
Mechanics of the human hamstring muscles during sprintingFernando Farias
As peak musculotendon
force and strain for BF
LH
, ST, and SM occurred around the same time during terminal swing, it is suggested that this period in the
stride cycle may be when the biarticular hamstrings are at greatest injury risk. On this basis, hamstring injury prevention or rehabilitation
programs should preferentially target strengthening exercises that involve eccentric contractions performed with high loads at longer
musculotendon lengths.
Postexercise Cold Water Immersion Benefits Are Not Greater than the Placebo E...Fernando Farias
A CWI placebo is also as effective as
CWI itself in the recovery of muscle strength over 48 h.
This can likely be attributed to improved subjective ratings
of pain and readiness for exercise, suggesting that the hy-
pothesized physiological benefits surrounding CWI may
be at least partly placebo related.
Effects of seated and standing cold water immersion on recovery from repeated...Fernando Farias
There were
no significant group differences between control and either of the cold water immersion interventions. Seated cold water
immersion was associated with lower DOMS than standing cold water immersion (effect size = 1.86; P = 0.001). These
data suggest that increasing hydrostatic pressure by standing in cold water does not provide an additional recovery benefit
over seated cold water immersion, and that both seated and standing immersions have no benefit in promoting recovery
Changes During Passive Recovery In Lower Limbs Tiredness After Strenuous WorkoutIOSR Journals
Abstract: Lower limbs tiredness is a widely accepted indicator for recovery state prediction. The study was
designed and purposed to know the rate and trend of lower limbs tiredness recovery after strenuous workout in
passive state. Ten athletes from LNIPE, Gwalior having almost similar anthropometric measurements,
physiological capacity, chronological age(18-19 year), training age(5-6 year), event(sprinters) etc. residing in
same campus having similar daily routine were selected as participant in this experiment. The experiment was
conducted in a highly controlled environment using sophisticate equipments. Target Heart Rate Zone of the
workout lasting for 20 minutes was 80%-90% of their Maximum Heart Rate. Three readings including pre, post
and 30 minutes post workout was considered for both the two tests (Isometric Leg Strength Test and Sergeant
Jump Test) selected for the purpose. rANOVA was employed separately to derive out meaningful information
from the raw data. In both the tests well controlled workout for 20 minutes resulted in significant increase state
of post workout readings. With passage of time after 30 minutes post passive recovery there was no
improvement in state of tiredness. Thus scope of future research is there in planning out means and methods to
promote lower limbs tiredness recovery during this post recovery period.
Keyword: Isometric Leg Strength Test, Sergeant Jump Test, Recovery, rANOVA
Does strength training change your movement patterns?Fernando Farias
Most of us in this industry believe that good movement patterns make someone
a better athlete, as well making them less likely to get injured. Unsurprisingly,
therefore, a lot of programs have been put together to help you improve your
movement patterns.
Cold water immersion alters muscle recruitment and balanceFernando Farias
The purpose of this study was to evaluate the effects of cold-water immersion on the electromyographic (EMG) response of
the lower limb and balance during unipodal jump landing. The evaluation comprised 40 individuals (20 basketball players
and 20 non-athletes). The EMG response in the lateral gastrocnemius, tibialis anterior, fibular longus, rectus femoris,
hamstring and gluteus medius; amplitude and mean speed of the centre of pressure, flight time and ground reaction force
(GRF) were analysed. All volunteers remained for 20 min with their ankle immersed in cold-water, and were re-evaluated
immediately post and after 10, 20 and 30 min of reheating
How Small-Sided and Conditioned Games Enhance Acquisition of Movement and Dec...Fernando Farias
Such traditional methods provide a limited scope for
action variability in learners because a key aim of practitioners
is to decrease uncertainty of actions and rationalize decision-
making processes in training drills. Despite these reported bene-
fits, traditional utilization of practice drills has been criticized
because they neglect the active role of the performance envi-
ronment in shaping movement behavior and decision making
(10), sustaining a dysfunctional rupture in the performer-
environment relationship (cf. the concept of organismic asym-
metry in sports science (9)).
THE ABILITY TO EXPRESS HIGH
POWER OUTPUTS IS CONSIDERED
TO BE ONE OF THE FOUNDA-
TIONAL CHARACTERISTICS
UNDERLYING SUCCESSFUL PER-
FORMANCE IN A VARIETY OF
SPORTING ACTIVITIES, INCLUDING
JUMPING, THROWING, AND
CHANGING DIRECTION. NUMER-
OUS TRAINING INTERVENTIONS
HAVE BEEN RECOMMENDED TO
ENHANCE THE ATHLETE’S ABILITY
TO EXPRESS HIGH POWER OUT-
PUTS AND IMPROVE THEIR OVER-
ALL SPORTS PERFORMANCE
CAPACITY. THIS BRIEF REVIEW
EXAMINES THE FACTORS THAT
UNDERLIE THE EXPRESSION OF
POWER AND VARIOUS METHODS
THAT CAN BE USED TO MAXIMIZE
POWER DEVELOPMENT
The use of stretching in the training programs of recrea-
tional and competitive athletes has been historically common-
place. The role of stretching in enhancing athletic performance
has been debated (49). The purpose of this review was to
examine the literature regarding the effect of stretching on
performance, without regard to any of the other purported
effects of stretching, including improvements in joint range
of motion, muscle length, or recovery from or susceptibility
to injury.
Correlation between conventional clinical tests and a new movement assessment...Stavros Litsos
Correlation between conventional clinical tests and a new movement assessment battery - Bachelor thesis
Despite the complexity of movements performed in sports, physical examination is today done by conventional tests that evaluate joints and muscles individually (e.g. Smith press test, Figure1). Our study used a new movement assessment battery of 20 reach tests, which incorporates the complexity and diversity of natural human movements, taking into consideration that joints are interdependent in a movement and that the planes and sequences of a movement change during its performance. The purpose of this study was to determine whether or not there is a correlation between conventional mobility tests and the new assessment battery.
Muscular strength, functional performances and injury risk in professional an...Fernando Farias
Muscle strength and anaerobic power of the lower extre-
mities are neuromuscular variables that influence perfor-
mance in many sports activities, including soccer. Despite
frequent contradictions in the literature, it may be assumed
that muscle strength and balance play a key role in targeted
acute muscle injuries. The purpose of the present study was
to provide and compare pre-season muscular strength and
power profiles in professional and junior elite soccer players
throughout the developmental years of 15–21.
Transfer of strength and power training to sports performance Fernando Farias
The purposes of this review are to identify the factors that contribute to the
transference of strength and power training to sports performance and to pro-
vide resistance-training guidelines. Using sprinting performance as an example,
exercises involving bilateral contractions of the leg muscles resulting in vertical
movement, such as squats and jump squats, have minimal transfer to performance.
However, plyometric training, including unilateral exercises and horizontal
movement of the whole body, elicits signifi cant increases in sprint acceleration
performance, thus highlighting the importance of movement pattern and contrac-
tion velocity specifi city. Relatively large gains in power output in nonspecifi c
movements (intramuscular coordination) can be accompanied by small changes in
sprint performance. Research on neural adaptations to resistance training indicates
that intermuscular coordination is an important component in achieving transfer to
sports skills. Although the specifi city of resistance training is important, general
strength training is potentially useful for the purposes of increasing body mass,
decreasing the risk of soft-tissue injuries, and developing core stability. Hyper-
trophy and general power exercises can enhance sports performance, but optimal
transfer from training also requires a specifi c exercise program.
The Analysis of Plyometric Training Program on University Handball PlayersIOSR Journals
Abstract: The purpose of this study was to find out the efficiency of composed plyometric training program on
beginners Handball players force capabilities in their usual training period. The plyometric training program
was applied during 16 week period where was attended twenty-one 12-19 years old beginners Handball
players. Twelve of them were female and nine male handball players. There were three control tastings. All
subjects participated in following tests: standing long jump, depth leap long jump, medicine ball throws up in
10 seconds; medicine ball overhead throws forward against the wall in 10 seconds, maximal vertical jumps to
the maximal height in 10 seconds, maximal vertical jump height. Testing results statistical analysis has shown
athletes legs and arms speed force reliable improvement. Standing long jump, depth leap long jump and
maximal vertical jump height test results, what has shown legs explosive power, has not shown remarkable
reliable difference (P>0.05) . Medicine ball throws and maximal vertical jumps to the maximal height in 10
seconds, what show speed force improvement, showed reliable difference (P<0.01).
Key words: TRAINING METHOD, LEGS AND ARMS SPEED FORCE TRAINING.
Eccentric training using external loads greater than the
relative concentric training intensity is a potent stimulus for
enhancements in muscle mechanical function, and MTU
morphological and architectural adaptations. The inclusion
of eccentric loads above maximal concentric strength is
therefore an avenue to induce novel training stimuli and
effect change in key determinants, and functional metrics,
of strength, power and speed performance. Strength
improvements are largely mode-specific and arise from a
combination of neural, morphological and architectural
adaptations [8]. Increased agonist volitional drive is posited
as the primary contributing factor to the marked increases
in eccentric strength observed following training [54].
Eccentric training improves concentric muscle power and
SSC performance to a greater extent than concentric or
traditional modalities
Mats André Zuccarello Aasen, commonly known as Mats Zuccarello, was born on September 1, 1987, in
Oslo, Norway. He grew up in the bustling neighborhood of Løren, where his passion for ice hockey began
at a young age. His mother, Anita Zuccarello, is of Italian descent, and his father, Glenn Aasen, is
Norwegian. This multicultural background played a significant role in shaping his identity and versatility
on and off the ice.
Mock 2024 NHL Draft Experts Divided after Celebrini, Levshunov, Silayev go in...Ice Brek
After the NHL Draft Lottery on Monday, Adam Kimelman, NHL.com’s deputy managing editor,
and Mike G., senior draft writer, Morreale make their predictions for how the first 16 selections
of the 2024 Upper Deck NHL Draft could turn out.
Albania vs Spain Euro Cup 2024 Very Close Armando Broja Optimistic Albania Wi...Eticketing.co
Euro Cup 2024 fans worldwide can book Albania vs Spain Tickets from our online platform www.eticketing.co. Fans can book Euro Cup Germany Tickets on our website at discounted prices.
Belgium vs Slovakia Belgium announce provisional squad for Euro Cup 2024 Thib...Eticketing.co
Euro 2024 fans worldwide can book Belgium vs Slovakia Tickets from our online platform www.eticketing.co. Fans can book Euro Cup Germany Tickets on our website at discounted prices.
Euro Cup fans worldwide can book Euro 2024 Tickets from our online platform www.worldwideticketsandhospitality. Fans can book Spain Vs Croatia Tickets on our website at discounted prices.
Narrated Business Proposal for the Philadelphia Eaglescamrynascott12
Slide 1:
Welcome, and thank you for joining me today. We will explore a strategic proposal to enhance parking and traffic management at Lincoln Financial Field, aiming to improve the overall fan experience and operational efficiency. This comprehensive plan addresses existing challenges and leverages innovative solutions to create a smoother and more enjoyable experience for our fans.
Slide 2:
Picture this: It’s a crisp fall afternoon, driving towards Lincoln Financial Field. The atmosphere is electric—tailgaters grilling, fans in Eagles jerseys creating a sea of green and white. The air buzzes with camaraderie and anticipation. You park, join the throng, and make your way to your seat. The stadium roars as the Eagles take the field, sending chills down your spine. Each play is a thrilling dance of strategy and skill. This is what being an Eagles fan is all about—the joy, the pride, and the shared experience.
Slide 3:
But now, the day is marred by frustration. The excitement wanes as you struggle to find a parking spot. The congestion is overwhelming, and tempers flare. The delays mean you miss the pre-game excitement, the tailgate camaraderie, and even the opening kick-off. After the game, the joy of victory or the shared solace of defeat is overshadowed by the stress of navigating out of the parking lot. The gridlock, honking horns, and endless waiting drain the energy and joy from what should have been an unforgettable experience.
Our proposal aims to eliminate these frustrations, ensuring that from arrival to departure, your experience is extraordinary. Efficient parking and smooth traffic flow are key to maintaining the high spirits and excitement that make game days special.
Slide 4:
The Philadelphia Eagles are not just a premier NFL team; they are an integral part of the community, hosting games, concerts, and various events at Lincoln Financial Field. Our state-of-the-art stadium is designed to provide a world-class experience for every attendee. Whether it's the thrill of game day, the excitement of a live concert, or the camaraderie of community events, we pride ourselves on delivering a fan-first experience and maintaining operational excellence across all our activities. Our commitment to our fans and community is unwavering, and we continuously strive to enhance every aspect of their experience, ensuring they leave with unforgettable memories.
Slide 5:
Recent trends show an increasing demand for efficient event logistics. Our customer feedback has consistently highlighted frustrations with parking and traffic. Surveys indicate that a significant number of fans are dissatisfied with the current parking situation. Comparisons with other venues like Citizens Bank Park and Wells Fargo Center reveal that we lag in terms of parking efficiency and convenience. These insights underscore the urgent need for innovation to meet and exceed fan expectations.
Slide 6:
As we delve into the intricacies of our operations, one glaring issue emer
Euro Cup international supporters can book Euro 2024 Tickets from our online platform Worldwideticketsandhospitality.com. Followers can book Portugal Vs Czechia Tickets on our website at sale prices.
Results for LtCol Thomas Jasper, Marine, for the 2010 Marine Corps Marathon held October 31, 2010, marking the 35th annual marathon known as "The People's Marathon."
An impressive finishing time of 3:46:39, placing 324th in the Male division ages 40-44.
Spain vs Croatia Date, venue and match preview ahead of Euro Cup clash as Mod...Eticketing.co
We offer Euro Cup Tickets to admirers who can get Spain vs Croatia Tickets through our trusted online ticketing marketplace. Eticketing.co is the most reliable source for booking Euro Cup Final Tickets. Sign up for the latest Euro Cup Germany Ticket alert.
Euro Cup fans worldwide can book Euro 2024 Tickets from our online platform www.worldwideticketsandhospitality. Fans can book Croatia Vs Italy Tickets on our website at discounted prices.
Euro Cup fans worldwide can book Euro 2024 Tickets from our online platform www.worldwideticketsandhospitality. Fans can book Belgium Vs Romania Tickets on our website at discounted prices.
Euro Cup international supporters can book Euro 2024 Tickets from our online platform Worldwideticketsandhospitality.com. Followers can book Turkey Vs Portugal Tickets on our website at sale prices.
Euro Cup fans worldwide can book Euro 2024 Tickets from our online platform www.worldwideticketsandhospitality. Fans can book Denmark Vs England Tickets on our website at discounted prices.
Euro Cup fans worldwide can book Euro 2024 Tickets from our online platform www.worldwideticketsandhospitality. Fans can book Ukraine Vs Belgium Tickets on our website at discounted prices.
Euro Cup fans worldwide can book Euro 2024 Tickets from our online platform www.worldwideticketsandhospitality. Fans can book Poland Vs Austria Tickets on our website at discounted prices.
Turkey's Euro 2024 Squad Overview and Transfer Speculation.docxEuro Cup 2024 Tickets
Vincenzo Montella has announced a preliminary 35-man squad for Turkey ahead of the UEFA Euro 2024, which includes three Serie A players, Hakan Calhanoglu, Kenan Yildiz, and Zeki Celik
Euro Cup fans worldwide can book Euro 2024 Tickets from our online platform www.worldwideticketsandhospitality. Fans can book Slovenia Vs Denmark Tickets on our website at discounted prices.
Ukraine Euro Cup 2024 Squad Sergiy Rebrov's Selections and Prospects.docxEuro Cup 2024 Tickets
After securing their spot through the playoff route, Ukraine is gearing up for their fourth consecutive European Championship. Ukraine first qualified as hosts in 2012, but in 2016
Ukraine Euro Cup 2024 Squad Sergiy Rebrov's Selections and Prospects.docx
Healy and harrison et al. 2014 drop jump emg gluteo
1. The effects of a unilateral gluteal activation protocol on
single leg drop jump performance
ROBIN HEALY & ANDREW J. HARRISON
Biomechanics Research Unit, Department of Physical Education and Sport Sciences, University of
Limerick, Limerick, Ireland
(Received 4 May 2013; accepted 2 December 2013)
Abstract
Warm-up protocols are commonly used to acutely enhance the performance of dynamic activities. This
study examined the acute effect of low-load gluteal exercises on the biomechanics of single-leg
drop jumps. Eight men and seven women (18–22 years old) performed 10 single-leg drop jumps on
three separate days. The gluteal exercises were performed within the warm-up on day 2. Contact time,
flight time, peak vertical ground reaction force (GRF), rate of force development, vertical leg-spring
stiffness, and reactive strength index were determined. A repeated measures analysis of variance was
used to examine differences on all variables across days. Significant differences were found for contact
time, peak GRF, and flight time between days 1 and 2 and for flight time between days 1 and 3
(p # 0.05) with no significant difference in any variables between days 2 and 3. This suggested that
the improvements in day 2 were due to practice effects rather than the gluteal activation exercises.
In addition, a typical error analysis was used to determine individual responses to the gluteal exercises.
The results using this analysis showed no discernible response pattern of enhancement or fatigue for
any participant.
Keywords: Stretch shortening cycle, ground reaction force, fatigue, potentiation, warm-up
Introduction
Warm-up protocols play a vital role in preparing an athlete for explosive movements in both
training and competition. The goal of a warm-up is to create an environment where an athlete
can perform optimally. A large amount of research exists in designing warm-up protocols
to enhance jumping performance using exercises of low, moderate, and high intensities (de
Villarreal, Gonzalez-Badillo, & Izquierdo, 2007; Young, Jenner, & Griffiths, 1998). Ideally, a
warm-up should be safe, effective, and easy to perform. Although exercises at high intensities
have been shown to be effective, they can also result in significant fatigue effects (Kilduff et al.,
2008; Witmer, Davis, & Moir, 2010). It is unclear whether lower intensity exercises may be
more effective, given their reduced exercise load. Warm-ups for explosive activities such as
jumping or sprinting have attempted to elicit a post-activation potentiation effect, which
results in an acute enhancement in the performance of the explosive activity after a prior
q 2014 Taylor & Francis
Correspondence: A.J. Harrison, Department of Physical Education and Sport Sciences, The University of Limerick, Castletroy,
Limerick, Ireland, E-mail: drew.harrison@ul.ie
Sports Biomechanics, 2014
Vol. 13, No. 1, 33–46, http://dx.doi.org/10.1080/14763141.2013.872288
2. conditioning stimulus (Tillin & Bishop, 2009). To elicit a post-activation potentiation effect,
the mode and intensity of the prior conditioning activity need to be considered. Much of the
research on post-activation potentiation has focussed on performing heavy back squats
(.80% 1RM) to elicit a post-activation potentiation effect during recovery (Comyns,
Harrison, Hennessy, & Jensen, 2006; Crewther et al., 2011; Kilduff et al., 2007; Rahimi,
2007). According to Sale (2002), post-activation potentiation is the “transient increase in
muscle contractile performance after previous contractile activity” and is thought to occur
through the phosphorylation of myosin regulatory light chains. Regardless of the mechanism
involved, post-activation potentiation may result in an acute increase in power output which
may enhance performance in trained individuals (Chiu et al., 2003).
Research on the acute effects of low and moderate intensities on jump performance has
yielded contrasting results. Improvements in countermovement jump height and mechanical
power have been observed following dynamic back squats performed at light (25–35%
1RM) and moderate (45–65% 1RM) intensities and jump squats performed at 30% and
60% 1RM (Smilios, Piliandis, Sotiropoulos, Antonakis, & Tokmakidis, 2005; Sotiropoulos
et al., 2010). In contrast, no change in countermovement jump or single leg
drop jump performances have been observed by other researchers when using back squat
loads ranging for 30–65% 1RM (Comyns, Harrison, Hennessy, & Jensen, 2007; de
Villarreal et al., 2007; Hanson, Leigh, & Mynark, 2007; Moir, Mergy, Witmer, & Davis,
2011). Recent research by Crow, Buttifant, Kearny, and Hrysomallis (2012) found that the
execution of a low/moderate load gluteal activation protocol resulted in a 4.2% improvement
in peak power production during countermovement jump performance. This improvement
was attributed to increased muscle activation of the gluteal region as a result of the protocol.
The protocol used consisted of exercises designed to specifically target the gluteal muscles
and are typically prescribed by physiotherapists and coaches to activate the gluteal muscles
prior to jumping or sprinting. The gluteal muscle group is extremely important in the
performance of dynamic activities such as sprinting and jumping. The gluteus maximus acts
to generate large amounts of work and power output throughout the jumping motion,
whereas the gluteus medius and minimus act to stabilise the hip joint (Nagano, Komura,
Fukashiro, & Himeno, 2005). If effective, a warm-up consisting of a gluteal activation
protocol may be a more practical method to elicit acute improvements in jumping
performance as it is safe and easy to administer and can be carried out in any environment.
A gluteal activation protocol could potentially elicit a post-activation potentiation response;
however, the classic trend of initial fatigue followed by potentiation must be observed in
order for an improvement to be post-activation potentiation related (Tillin & Bishop, 2009).
Drop jumps or their single leg variation, the single leg drop jump affords researchers an
effective method of examining stretch shortening cycle performance (i.e. the ability to couple
eccentric and concentric muscle contractions) and other performance variables. In these
jumping activities, acute improvements or decrements in performance are associated with a
change in biomechanical parameters that include ground contact time, reactive strength
index, vertical leg-spring stiffness, and rate of force development. These parameters are
important as they may influence a variety of other performance outcomes. Few studies to
date have examined the potential performance enhancing or inhibiting effects of gluteal
activation exercises on jumping or running performance or parameters that influence
performances such as leg-spring stiffness, reactive strength index, or mean rate of force
development. Notable exceptions include Crow et al. (2012) who examined the effect of
gluteal exercises on mechanical power and Berning et al. (2010) who examined the effect of
isometric squats on vertical jump performance. Generally, most previous research on
jumping has used simple pre-test, post-test experimental designs (e.g. Berning et al., 2010;
34 R. Healy & A.J. Harrison
3. Crow et al., 2012); however, these designs may not be suitable for assessing the effects due to
post-activation potentiation or other proposed mechanisms, since the potential learning or
practice effects may not be detected. To control for practice effects, a 3-day experimental
design is recommended with participants completing a pre-test, a post-test with intervention
and a third bout of testing which mirrors that of the pre-test. A true performance enhancing
effect due to the intervention would be indicated by a significant difference between days 1
and 2 and significant difference between day 2 and the repeat baseline test (day 3).
Previous post-activation potentiation research has shown large variability between subject
responses which could potentially mask differences between pre- and post-test scores when
using repeated measures analysis of variance (ANOVA; Comyns et al., 2007; Harrison,
2011). In order to account for this, the typical error method has been proposed (Hopkins,
2000) and has been effectively used in research to investigate individual responses to
treatment conditions (Witmer et al., 2010). The typical error method can be adapted to
determine potentiation and fatigue events relative to the pre-test measures and to examine
fatigue–potentiation sequences in individual’s responses due to an intervention. Previous
studies have shown that post-activation potentiation responses often present as a time
sequence of initial fatigue (i.e. performance decrement) followed by potentiation (i.e.
performance enhancement; Tillin & Bishop, 2009).
The primary aim of this study was to examine the effects of a gluteal activation protocol on
the mechanics of single leg drop jumps performed on a force sledge apparatus using a 3-day
experimental design with the gluteal activation protocol being used only on the day 2
measures. A secondary aim was to compare the results of the data analysis using repeated
measures ANOVA and an adapted typical error analysis to control for intra and inter
participant variability. These aims led to the primary research question: “What are the acute
individual effects of a gluteal activation protocol on single leg drop jump performance?”
Methods
Fifteen participants (eight men and seven women) were recruited for this study and their
mean (^SD) age, height, and body mass were 19.9 ^ 1.6 years, 173.9 ^ 11.7 cm, and
67.5 ^ 11.1 kg, respectively. All participants were sprint trained, track athletes and were
injury free at the time of testing. Ethical approval for this study was granted by the University
of Limerick Research Ethics Committee prior to testing. Before participation, the
participants were provided with a participant information form which gave a description of
the study and an outline of all the potential risks and benefits associated with the study.
All participants completed a physical activity readiness questionnaire and an informed
consent form. Throughout the testing sessions, participants wore their own shorts and t-shirt
but they were instructed to wear the same running shoes for each day of testing. All
participants were experienced with drop jumping exercises but had no prior experience
performing single leg drop jumps on the force sledge apparatus.
Experimental design
All participants performed 10 single leg drop jumps on their dominant leg on a specially
constructed sledge and force platform apparatus on three separate days. Days 1 and 3 acted as
control (i.e. non-intervention condition) measures where participants performed the jumps at
a rate of one jump per minute following a standardised warm-up. Day 2 acted as the
intervention condition, where participants performed the jumps following a standardised
Effects of a unilateral gluteal activation protocol 35
4. warm-up and a gluteal activation protocol consisting of seven exercises performed for ten
repetitions on the dominant leg.
Instrumentation
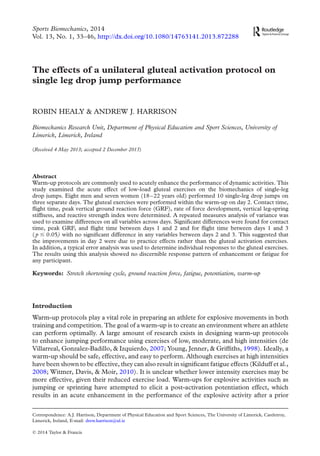
All of the single leg drop jumps were performed on a specially built force sledge apparatus
(Figure 1) which consists of a sledge frame, a sliding chair, a lifting winch and a force
platform. This type of apparatus has been effectively used to assess biomechanical
parameters of stretch–shortening cycle exercises (Aura & Komi, 1986; Kaneko, Komi, &
Aura, 1984; Kyro¨la¨inen et al., 1990).
The sledge frame was a right-angled triangle set at an incline of 308, made of box metal
with projections at the base of the frame at each side for greater stability. To prevent any
backward movement, the base of the frame was bolted to the floor. The sliding chair was
mounted on the rails of the sledge frame on steel rollers. Since the difference between the
calculated average acceleration and the predicted acceleration at 308 incline using this
apparatus was 9.28 £ 1023
m/s2
or 0.19% (Furlong & Harrison, 2013), the effect of friction
was assumed to be negligible.
Participants sat in the sliding chair and were securely fastened with a harness and Velcro
straps at the shoulders and waist and with their arms crossed across their chest to minimise
any involvement of the upper body in the jumping action. A lifting winch enabled the sliding
chair to be set at a predetermined drop height until they were released. A force platform
(OR6-5, Advanced Mechanical Technology, Inc., Watertown, MA, USA) was positioned at
an angle of 608 to the floor and sledge frame providing an angle of 908 between the force
platform and the sledge frame. The force data were sampled at 1,000 Hz and provided
force–time data that were accurate to within 1 N for force and within 1 ms for time.
The measurement control provided by the force-sledge apparatus allowed the isolation
of the lower body and constrained any potential involvement of the upper body in the
performance of the drop jump. It was also effective in providing control of the participant
Figure 1. Force sledge apparatus illustrating the force platform, the sledge frame, the safety harness, and the lifting
winch.
36 R. Healy & A.J. Harrison
5. drop height and impact velocity which facilitated increased reliability in the drop jump tests
(Kramer, Ritzmann, Gollhofer, Gehring, & Gruber, 2010). Flanagan and Harrison (2007)
established a strong trial-to-trial reliability for single leg drop jumps performed on a
dominant leg with this type of apparatus in the calculation of flight time, peak vertical ground
reaction force (GRF), vertical leg-spring stiffness, and reactive strength index with
Cronbach’s a reliability coefficients greater than 0.95, and single trial and averaged multiple
trial intraclass correlations greater than 0.85 and 0.90, respectively.
Test procedures
A 3-day testing design was used over a 7-day period as illustrated in Figure 2. All participants
were asked to refrain from intense lower body exercise and to standardise their diet for 24 h
prior to each testing session. On all three days of testing, the participants performed a
standardised dynamic warm-up adapted from Esformes, Cameron, and Bampouras (2010).
This warm-up consisted of 3 min of cycling at a self-selected pace followed by four
repetitions of high knees, walking hamstring sweeps, and walking lunges over 10 m. Single
leg drop jumps were performed with the participants’ dominant leg from a standardised
drop height of 30 cm which has been shown to maximise reactive strength index in sprinters
using a force sledge apparatus similar to that of Kaneko et al. (1984). A rest interval of 1 min
was provided between trials which allowed for full recovery from the jump. Following the
procedures used in Comyns, Harrison, and Hennessy (2011), the participants were
instructed to minimise their contact time on the force plate while maximising the height of
the subsequent jump. Participants were given the following cue after their third, sixth, and
ninth jump on all three days to ensure consistency of technique “Minimize your contact
time, get off the plate as quick as you can”.
On day 1, the participants’ standing height and body mass were recorded. The participants
then executed the dynamic warm-up as outlined above followed by three familiarisation
jumps. The participants then performed single leg drop jumps at a rate of one jump per minute
for a total of ten jumps performed over 10 min. All jumps were performed from a standardised
drop height of 30 cm. On day 2 of testing, participants underwent a gluteal activation
protocol in addition to the standardised dynamic warm-up. This protocol is outlined in
Table I with each exercise performed for ten repetitions and contractions held for 5 s.
Figure 2. Layout of the 3-day experimental design.
Effects of a unilateral gluteal activation protocol 37
6. Following this, single leg drop jumps were performed in the same manner as in day 1. This
testing session took place two days after the 1st day of testing. Day 3 of testing was performed
in an identical manner to that of the 1st day. This session acted as a second control day to
account for any possible learning affects that may have arisen due to practice. Test session 3
took place seven days after the 1st day of testing.
Calculation of dependent variables
The dependent variables calculated for all jumps were contact time, flight time, peak vertical
GRF, mean rate of force development, vertical leg-spring stiffness, and reactive strength
index. Contact time, flight time, and peak vertical GRF were obtained directly from the force
platform data. An example of a force trace is provided in Figure 3 illustrating the derivation
of the key variables. Contact time was calculated as the difference in time(s) between the
initial landing following the drop and the subsequent take-off. Flight time was found by
Table I. Gluteal activation protocol exercises and available electromyographic muscle activation values (%MVIC;
M ^ SD).
Exercise Study Gluteus maximus Gluteus medius
Unilateral bridge Ekstrom, Donatelli, and Carp (2007) 40 ^ 20 47 ^ 24
Quadruped lower extremity lift Ekstrom et al. (2007) 42 ^ 17 56 ^ 22
Quadruped hip abduction N/A N/A N/A
Side lying clam in 608 hip flexion DiStefano, Blackburn, Marshall, and
Padua (2009)
39 ^ 34 38 ^ 29
Side lying hip abduction Distefano et al. (2009) 39 ^ 18 81 ^ 42
Prone single leg hip extension Lewis and Sahrmann (2009) 22 ^ 10 N/A
Single limb squat Distefano et al. (2009) 59 ^ 27 61 ^ 24
Note: MVIC, maximum voluntary isometric contraction; N/A, appropriate electromyographic data not available.
Source: Adapted from Crow et al. (2012).
Figure 3. Force–time trace of a single leg drop jump with peak vertical ground reaction force, contact time, and flight
time illustrated.
38 R. Healy & A.J. Harrison
7. calculating the time difference between the take-off and landing for each jump. Both contact
time and flight time events were determined using an Excel Macro that recognised contact
time as the first instance where force exceeded 10 N and continued until recorded force fell
below 10 N, and this was considered as the beginning of flight time and continued until force
once again exceeded 10 N.
Peak vertical GRF was calculated as the peak force produced during the execution of the
single leg drop jump. In some instances, a double peak was encountered due to an initial
impact spike, where the impact spike was ignored and the second force peak was considered
the true peak vertical GRF.
Mean rate of force development was defined as the peak vertical GRF divided by the time
taken to reach peak vertical GRF and was expressed in N/s (Zatsiorsky, 1995). Vertical leg-
spring stiffness was defined as peak vertical GRF divided by the maximum displacement of
the centre of mass of the subject and sledge system during contact with the force platform.
The displacement was calculated by double integration of the resultant vertical component
of the GRF based on the recommendations of Street, McMillan, Board, Rasmussen, and
Heneghan (2001). The initial velocity was derived from the sledge drop height with a
constant acceleration component of 4.905 m/s2
. Reactive strength index was calculated as
the height jumped in metres divided by the ground contact time in seconds (Young, 1995).
The height jumped was defined as the flight height component and was determined using
an adaptation of the equation of Bosco, Luhtanen, and Komi (1983) due to the 308 incline of
the force sledge:
Height Jumped ¼
9:81 £ ðFlight TimeÞ2
16
: ð1Þ
Statistical analysis
To test for normality, a Shapiro–Wilk’s test was performed due to the relatively small
(n , 50) sample size (O’ Donoghue, 2012). Normality of the data was assumed for each
variable when Shapiro-Wilk’s test was found to have an a level .0.05 for each variable.
A repeated measures ANOVA with the a level set at p # 0.05 was used in order to determine
group-related differences in means for the dependent variables. All statistical analyses were
performed using SPSS, PASW Statistics (Version 20, IBM, Inc., Armonk, NY, USA).
An adapted typical error method was used to investigate the participants’ individual
responses to the gluteal activation protocol for each dependent variable. Means and standard
deviations were used to represent measures of central tendency and spread of the data during
each participant’s 10 test trials on day 1. Based on the recommendations of Hopkins (2000),
a typical error upper limit and typical error lower limit of the biological variance of the
participant’s performance were set for each variable and for each participant by adding 1.5
times the within-subject SD to the mean score and subtracting 1.5 times the within-subject
SD to the mean score, respectively. This typical error range allowed the calculation of the
magnitude of change that was required in order for a true change in performance to be
identified. This enabled potentiation and fatigue events to be identified in the intervention
day in comparison with the control days. Typical error limits were set according to the higher
value of the 2 control day measures for potentiation and the lower value of the 2 control day
measures for fatigue. For flight time, peak vertical GRF, mean rate of force development,
vertical leg-spring stiffness, and reactive strength index, a potentiation event occurred if the
values exceeded the typical error upper limit, whereas a fatigue event occurred if the values
Effects of a unilateral gluteal activation protocol 39
8. were below the typical error lower limit. For contact time, a potentiation event occurred if the
values were below the typical error lower limit, whereas a fatigue event occurred if the values
were greater than the typical error upper limit. The results were then grouped for each
variable to calculate the total number of fatigue and potentiation events across all dependent
variables and these were expressed in relation to the total possible number of fatigue or
potentiation events or fatigue followed by potentiation sequences (i.e. where an initial fatigue
occurred followed by potentiation). The proportion of fatigue and potentiation events was
calculated by dividing the total number of fatigue or potentiation events by the total number
of possible events and expressed as a percentage.
Results
The mean (^SD) values for all variables on each testing day are shown in Table II. The
analysis using repeated measures ANOVA found significant differences between days 1 and 2
for contact time, flight time, and peak vertical GRF with no significant differences being
found for mean rate of force development, reactive strength index and vertical leg-spring
stiffness. The results showed that mean contact time and mean flight time reduced by 0.036 s
(p ¼ 0.005) and 0.033 s (p ¼ 0.011), respectively, whereas peak vertical GRF increased by
57 N ( p ¼ 0.011). Significant differences were also found between days 1 and 3 for flight
time. Mean flight time decreased by 0.028 s ( p ¼ 0.047). No significant differences were
found between days 2 and 3 for any variable.
An illustration of the scores of day 2 of testing for all variables for participant 1 is displayed
in Figure 4. A plot of the intervention (day 2) values is displayed relative to the upper and
lower typical error limits. Participant 1 acted as an exemplar participant so that the typical
error results could be described before all participants’ individual results were grouped
together.
Figure 4a illustrates potentiation events for participant 1 when contact time was below the
lower typical error limit (0.352 s) in jumps 9 (0.344 s) and 10 (0.288 s), whereas no fatigue
events were present. Figure 4b illustrates fatigue events for participant 1 when flight time was
below the lower typical error limit (0.548 s) in jumps 9 (0.534 s) and 10 (0.405 s), whereas no
potentiation events were present. Figure 4c illustrates potentiation events for participant 1
when peak vertical GRF was above the upper typical error limit (799 N) in jumps 9 (818 N)
and 10 (923 N), whereas no fatigue events were present. Figure 4d illustrates potentiation
events for participant 1 when mean rate of force development was above the upper typical
error limit (4,874 N/s) in jumps 9 (5,114 N/s) and 10 (6,941 N/s), whereas no fatigue events
Table II. Results of the repeated measures ANOVA between the 3 testing days (M ^ SD).
Dependent variable Day 1 Day 2 Day 3
Contact time (s) 0.403 ^ 0.044 0.367 ^ 0.028†
(8.9%) 0.377 ^ 0.027
Flight time (s) 0.669 ^ 0.038 0.636 ^ 0.029†
(4.9%) 0.641 ^ 0.036‡
(4.19%)
Peak vertical GRF (N) 787 ^ 60 845 ^ 42†
(7.2%) 828 ^ 48
Rate of force development (N/s) 4175 ^ 1083 4873 ^ 619 4,458 ^ 835
Vertical leg-spring stiffness (kN/m) 2.44 ^ 0.59 2.58 ^ 0.55 2.48 ^ 0.54
Reactive strength index 0.709 ^ 0.096 0.695 ^ 0.061 0.689 ^ 0.057
Notes: Percentage differences are provided where significant differences in means occurred. †
Denotes statistically
significant difference between days 1 and 2 ( p # 0.05). ‡
Denotes statistically significant difference between days 1
and 3 (p # 0.05). No statistically significant differences were found between days 2 and 3. GRF, ground reaction
force.
40 R. Healy & A.J. Harrison
9. were present. Figure 4e illustrates potentiation events for participant 1 when vertical leg-
spring stiffness was above the upper typical error limit (2.37 kN/m) in jumps 9 (2.38 kN/m)
and 10 (2.69 kN/m) whereas no fatigue events were present. Figure 4f illustrates fatigue
events for participant 1 when reactive strength index was below the lower typical error limit
(0.36) in jump 10 (0.35) whereas no potentiation events were present. For all variables for
participant 1, no fatigue–potentiation sequences were found.
The group-based analysis of the potentiation events, the fatigue events, and the fatigue–
potentiation sequences for all variables are shown in Table III. The percentage of total events
for fatigue and potentiation is also given. Vertical leg-spring stiffness was found to have the
Figure 4. Contact time (a), flight time (b), peak vertical ground reaction force (c), mean rate of force development
(d), vertical leg-spring stiffness (e), and reactive strength index (f) over 10 jumps on day 2 of testing for participant 1
with upper and lower typical error limits included. GAP, gluteal activation protocol.
Effects of a unilateral gluteal activation protocol 41
10. highest total number of participants in which potentiation events occurred (n ¼ 9), while the
lowest was found for flight time (n ¼ 0). Flight time was found to have the highest total
number of participants in which fatigue events occurred (n ¼ 6) while the lowest was found
for vertical leg-spring stiffness (n ¼ 1). The greatest overall percentage of potentiation was
found for peak vertical GRF with 17.3% while the greatest overall percentage of fatigue was
found for flight time with 12%. The lowest overall percentage of potentiation was found for
flight time with 0% while the lowest overall percentage of fatigue was found for peak vertical
GRF with 1.3%. No fatigue–potentiation sequences were found for any variable.
Table IV provides a description of the overall trends in the numbers of fatigue, potentiation
or no change events that occurred in all variables, in each participant across all of their
10 trials. The greatest potentiation response was found in participant 8, where potentiation
events were found for contact time, peak vertical GRF, mean rate of force development,
vertical leg-spring stiffness, and reactive strength index along with fatigue events in flight
time. The greatest fatigue response was found in participant 6, where fatigue events were
found in all dependent variables apart from peak vertical GRF and flight time. The fewest
number of responses were found in participant 10 where only one potentiation event was
Table III. Group-based typical error analysis.
Potentiation Fatigue
Dependent variable
Total
events
Participantsa
(%)
Total
events
Participantsa
(%)
Total fatigue–
potentiation sequences
Contact time 13 6 (8.7) 3 3 (2.0) 0
Flight time 0 0 (0) 18 6 (12) 0
Peak vertical GRF 26 8 (17.3) 2 2 (1.3) 0
Rate of force development 17 7 (11.3) 5 4 (3.3) 0
Vertical leg-spring stiffness 24 9 (16.0) 3 1 (2.0) 0
Reactive strength index 8 3 (5.3) 14 6 (9.3) 0
Note: GRF, ground reaction force.; a
The total participant number in which events occurred and % of total events.
Table IV. Typical error analysis results.
Participant
Contact
time
Flight
time
Peak vertical
GRF
Rate of force
development
Vertical leg-spring
stiffness
Reactive
strength index
1 P F P P P F
2 – – F F P –
3 PF F – F P F
4 – – P P P –
5 P – P – P P
6 F – – PF F F
7 F F – – – F
8 P F P P P P
9 – – – P P –
10 – – P – – –
11 – – F F – –
12 – – P – P –
13 P F P – P F
14 – – P P – P
15 P F – P – F
Note: P, potentiation event; F, fatigue events; –, no change.
42 R. Healy & A.J. Harrison
11. found. Both potentiation and fatigue events were found for the same variable in participant 3
for contact time and vertical leg-spring stiffness and in participant 6 for mean rate of force
development; however, this occurred in the sequence potentiation–fatigue.
Discussion and implications
The purpose of this investigation was to determine whether a gluteal activation protocol
provided an acute enhancement or inhibition of single leg drop jump performance in sprint-
trained athletes. A 3-day testing design was used to control for improvements that may have
occurred due to learning. In addition, this study also attempted to control for intra-
individual variability through the use of the typical error method. The results of the repeated
measures ANOVA showed significant differences in mean scores between days 1 and 2 for
contact time, flight time, and peak vertical GRF. While these differences suggest that changes
in performance were due to the gluteal activation protocol, the 3-day design showed no
significant differences between days 2 and 3 in any of the dependent variables. Had similar
significant differences been found between days 1 and 2 as well as days 2 and 3, this would
have suggested that the gluteal activation exercises alone were responsible for acute changes
in performance.
Flight time can be considered the primary measure of jumping performance in this study
and these results indicate a 4.9% decrease in jumping performance as flight time was reduced
between days 1 and 2. A significant reduction in flight time of 4.19% found between days 1
and 3, however, suggests that the decrease in performance between days 1 and 2 was more
likely due to practice than an acute change caused by the gluteal activation protocol. This
decrease in flight time coincided with a decrease in contact time in days 2 and 3, suggesting
that the participants were attempting to minimise their contact time at the expense of flight
time. A simple pre-test post-test design on the days 1 and 2 data would have resulted in
statistically significant reductions in contact time and flight time and improvements in peak
vertical GRF which would have indicated a performance inhibiting effect as a result of the
gluteal activation protocol. The 3-day design was therefore effective in accounting for a
learning effect due to practice. Previous complex training experiments examining jumping
activities have tended to use a simpler pre-test, post-test design (Berning et al., 2010; Crow
et al., 2012). As a consequence, some doubt can be cast about the reliability of those findings
since potential improvements occurring as a result of a practice effect cannot be ruled out.
The results of the group analysis using the typical error method shown in Tables III and IV,
illustrate that the total number of fatigue and potentiation events differed greatly between
participants and between variables. These results are inconsistent and have no clear
discernible pattern as a variety of responses were found for all participants. The only
identifiable trend that could be found was in flight time where six participants had a fatigue
response as a result of the gluteal activation protocol with no change being found in the
remainder of the subjects. This is consistent with the post-activation potentiation literature
on jumping where reductions in flight time have been noted in countermovement jumps and
drop jumps after performing conditioning activities (Comyns et al., 2006, 2007; Kilduff
et al., 2008; Witmer et al., 2010). The lack of response in the remainder of participants
suggests that this fatigue effect on flight time cannot be generalised. When all variables are
included, potentiation events were noted in a total of twelve participants most notably for
vertical leg-spring stiffness with potentiation events occurring in nine participants. A second
variant of the typical error method, i.e. using maximum and minimum values to determine
potentiation and fatigue, was applied to the data which provided a more stringent criterion.
No major difference was found apart from a reduction of one participant from the total
Effects of a unilateral gluteal activation protocol 43
12. number of individuals with fatigue events for contact time, flight time, mean rate of force
development, and reactive strength index and with potentiation events for contact time,
mean rate of force development, peak vertical GRF, and vertical leg-spring stiffness.
The literature reports that post-activation potentiation effects can be very individual
(Comyns et al., 2006, 2007; Witmer et al., 2010). If post-activation potentiation was the
cause of the improvements noted, then a classic post-activation potentiation pattern should
be evident. A typical post-activation potentiation effect should involve a reduction in
performance immediately after the exercise stimulus (a fatigue event/events) followed by an
enhancement some time later (a potentiation event/events). This has been well documented
in complex training research (Gilbert & Lees, 2005; Harrison, 2011; Kilduff et al., 2008).
In this study, this was not the case, however, as the typical error results revealed that the
gluteal activation protocol did not result in a single fatigue–potentiation sequence across all
participants and all variables. Only two participants exhibited both a fatigue and potentiation
effect for the same variable; however, this occurred with post-activation potentiation preceding
fatigue and so cannot be considered as a fatigue–potentiation sequence. Improvements that
were found in dependent variables cannot be attributed to post-activation potentiation as the
response of participants was so varied that they are mostly likely due to intra-individual
biological variability.
The intensities of the gluteal exercises used in the gluteal activation protocol in this
experiment have previously been reported to range from 22% to 59% of a maximum
voluntary isometric contraction (MVIC) for the gluteus maximus and 38–81% for the
gluteus medius. These exercises are commonly prescribed by coaches and therapists to
prevent injuries and improve performance. Low to moderate intensity exercises have been
shown to enhance jump performance; however, these were performed dynamically and
utilised exercises biomechanically similar to the jumping activity tested (Smilios et al., 2005;
Sotiropoulos et al., 2010). The gluteal activation protocol is performed isometrically and
therefore is not biomechanically similar to the highly dynamic movement pattern of jumping.
This combined with the relatively low intensities used suggest that a true post-activation
potentiation effect cannot be elicited by this gluteal activation protocol. This is in line with
current research where post-activation potentiation effects have been shown to be optimised
when maximal or near maximal intensities, i.e. greater than 80% of dynamic or isometric
MVIC are used (de Villarreal et al., 2007; Rahimi, 2007).
To date, the research by Crow et al. (2012) is the only study that assessed the use of a
gluteal activation protocol and reported acute improvements in peak power production
during countermovement jump testing after a gluteal activation protocol was used. The
improvements found were attributed to increased muscle activation as a result of the gluteal
activation exercises. Future study using EMG is required to assess whether a gluteal
activation protocol has any effect on subsequent gluteal muscle activation levels.
In contradiction to Crow et al. (2012), this investigation found no improvements in
jumping performance or biomechanical measures that could be clearly attributed to a gluteal
activation protocol. This explanation for this apparent contradiction in findings could be due
to the experimental design of Crow et al. (2012) not accounting for the possible practice
effect and/or biological variability. Alternatively, the differences in the findings could be
due to differences in the strength levels of participants between studies. Crow et al. (2012)
used elite Australian Rules Football players, whereas this study used track athletes that were
sprint trained.
The results of this study have important implications for training and for future research.
If coaches are prescribing exercises to elicit acute performance enhancing effects due to
post-activation potentiation or some other proposed mechanism, then careful consideration
44 R. Healy & A.J. Harrison
13. should be given to the selection of those exercises and their relative intensities. To benefit
from a post-activation potentiation effect, it is likely that exercises must elicit intensities
greater than 80% of a MVIC (Comyns et al., 2007). If lower intensity warm-up exercises are
to be used, then the movement pattern and movement velocity of the exercises must be
biomechanically similar to that of the desired activity. If ANOVA techniques are used and
baseline measures are recorded on a day separate to the intervention day, then a 3rd day of
testing as used in this study is recommended in order to reliably reject the null hypothesis.
Alternatively, the typical error method may be used to identify individual responses and
overall group trends while accounting for intra-individual variability.
Conclusion
This study has investigated the acute effects of an isometric gluteal activation protocol on
single leg drop jump performance and found that this protocol did not result in significant
differences in single leg drop jump performance. The significant differences observed in this
study between days 1 and 2 can be attributed to a learning/practise effect. Further research is
required to determine if a gluteal activation protocol has any effect on subsequent muscle
activation levels in the gluteal region.
References
Aura, O., & Komi, P. V. (1986). The mechanical efficiency of locomotion in men and women with special emphasis
on stretch shortening cycle exercises. European Journal of Applied Physiology and Occupational Physiology, 55,
37–43.
Berning, J. M., Adams, K. J., DeBeliso, M., Sevene-Adams, P. G., Harris, C., & Stamford, B. A. (2010). Effect of
functional isometric squats on vertical jump in trained and untrained men. The Journal of Strength &
Conditioning Research, 24, 2285–2289.
Bosco, C., Luhtanen, P., & Komi, P. V. (1983). A simple method for measurement of mechanical power in jumping.
European Journal of Applied Physiology and Occupational Physiology, 50, 273–282.
Chiu, L. Z., Fry, A. C., Weiss, L. W., Schilling, B. K., Brown, L. E., & Smith, S. L. (2003). Postactivation
potentiation response in athletic and recreationally trained individuals. The Journal of Strength & Conditioning
Research, 17, 671–677.
Comyns, T. M., Harrison, A. J., & Hennessy, L. K. (2011). An investigation into the recovery process of a maximum
stretch–shortening cycle fatigue protocol on drop and rebound jumps. Journal of Strength and Conditioning, 25,
2177–2184.
Comyns, T. M., Harrison, A. J., Hennessy, L. K., & Jensen, R. L. (2006). The optimal complex training rest interval
for athletes from anaerobic sports. The Journal of Strength & Conditioning Research, 20, 471–476.
Comyns, T. M., Harrison, A. J., Hennesy, L. K., & Jensen, R. L. (2007). Identifying the optimal resistive load for
complex training in male rugby players. Sports Biomechanics, 6, 59–70.
Crewther, B. T., Kilduff, L. P., Cook, C. J., Middleton, M. K., Bunce, P. J., & Yang, G. Z. (2011). The acute
potentiating effects of back squat on athlete performance. Journal of Strength and Conditioning Research, 25,
3319–3325.
Crow, J. F., Buttifant, D., Kearny, S. G., & Hrysomallis, C. (2012). Low load exercises targeting the gluteal muscle
group acutely enhance explosive power output in elite athletes. Journal of Strength and Conditioning Research, 26,
438–442.
de Villarreal, E. S. S., Gonza´lez-Badillo, J. J., & Izquierdo, M. (2007). Optimal warm-up stimuli of muscle activation
to enhance short and long-term acute jumping performance. European Journal of Applied Physiology, 100,
393–401.
Distefano, L. J., Blackburn, J. T., Marshall, S. W., & Padua, D. A. (2009). Gluteal muscle activation during common
therapeutic exercises. Journal Orthopaedic Sports Physical Therapy, 39, 532–540.
Ekstrom, R. A., Donatelli, R. A., & Carp, K. C. (2007). Electromyographic analysis of core, trunk, hip and thigh
muscles during 9 rehabilitation exercises. Journal Orthopaedic Sports Physical Therapy, 37, 754–762.
Esformes, J. J., Cameron, N., & Bampouras, T. M. (2010). Postactivation potentiation following different modes of
exercise. Journal of Strength and Conditioning Research, 24, 1911–1916.
Effects of a unilateral gluteal activation protocol 45
14. Flanagan, E. P., & Harrison, A. J. (2007). Muscle dynamics differences between legs in healthy adults. Journal of
Strength and Conditioning Research, 21, 67–72.
Furlong, L. A. M., & Harrison, A. J. (2013). Reliability and consistency of plantar flexor stretch–shortening cycle
function using an adapted force sledge apparatus. IOP Physiological Measurement, 34, 437–448.
Gilbert, G., & Lees, A. (2005). Changes in the force development characteristics of muscle following repeated
maximum force and power exercise. Ergonomics, 48, 1576–1584.
Hanson, E. D., Leigh, S., & Mynark, R. G. (2007). Acute effects of heavy-and light-load squat exercise on the kinetic
measures of vertical jumping. The Journal of Strength and Conditioning Research, 21, 1012–1017.
Harrison, A. J. (2011). Throwing and catching movements exhibit postactivation potentiation effects following
fatigue. Sports Biomechanics, 10, 185–196.
Hopkins, W. G. (2000). Measures of reliability in sports medicine and science. Sports Medicine, 30(1), 1–15.
Kaneko, M., Komi, P. V., & Aura, O. (1984). Mechanical efficiency of concentric and eccentric exercise performed
with medium to fast contraction rates. Scandinavian Journal of Sport Science, 6, 15–20.
Kilduff, L. P., Bevan, H. R., Kingsley, M. I., Owen, N. J., Bennett, M. A., Bunce, P. J., . . . , Cunningham, D. J.
(2007). Postactivation potentiation in professional rugby players: Optimal recovery. The Journal of Strength and
Conditioning Research, 21, 1134–1138.
Kilduff, L. P., Owen, N., Bevan, H., Bennett, M., Kingsley, M. I., & Cunningham, D. (2008). Influence of recovery
time on post-activation potentiation in professional rugby players. Journal of Sports Sciences, 26, 795–802.
Kramer, A., Ritzmann, R., Gollhofer, A., Gehring, D., & Gruber, M. (2010). A new sledge jump system that allows
almost natural reactive jumps. Journal of Biomechanics, 43, 2672–2677.
Kyro¨la¨inen, H., Komi, P. V., Oksanen, P., Ha¨kkinen, K., Cheng, S., & Kim, D. H. (1990). Mechanical efficiency of
locomotion in females during different kinds of muscle action. European Journal of Applied Physiology and
Occupational Physiology, 61, 446–452.
Lewis, C., & Sahrmann, S. (2009). Muscle activation and movement patterns during prone hip extension exercise in
women. Journal of Athletic Training, 44, 238–248.
Moir, G. L., Mergy, D., Witmer, C. A., & Davis, S. E. (2011). The acute effects of manipulating volume and load of
back squats on countermovement vertical jump performance. The Journal of Strength and Conditioning Research,
25, 1486–1491.
Nagano, A., Komura, T., Fukashiro, S., & Himeno, R. (2005). Force, work and power output of lower limb muscles
during human maximal-effort countermovement jumping. Journal of Electromyography and Kinesiology, 15,
367–376.
O’Donoghue, P. (2012). Statistics for sport and exercise studies: An introduction. London: Routledge.
Rahimi, R. (2007). The acute effects of heavy versus light-load squats on sprint performance. Facta Universitatis-
Series: Physical Education and Sport, 5, 163–169.
Sale, D. G. (2002). Postactivation potentiation: Role in human performance. Exercise and Sport Sciences Reviews,
30, 138–143.
Smilios, I., Pilianidis, T., Sotiropoulos, K., Antonakis, M., & Tokmakidis, S. P. (2005). Short-term effects of
selected exercise and load in contrast training on vertical jump performance. The Journal of Strength and
Conditioning Research, 19, 135–139.
Sotiropoulos, K., Smilios, I., Christou, M., Barzouka, K., Spaias, A., Douda, H., & Tokmakidis, S. P. (2010).
Effects of warm-up on vertical jump performance and muscle electrical activity using half-squats at low and
moderate intensity. Journal of Sports Science and Medicine, 9, 326–331.
Street, G. M., McMillan, S., Board, W., Rasmussen, M., & Heneghan, J. M. (2001). Sources of error in determining
countermovement jump height with the impulse method. Journal of Applied Biomechanics, 17, 43–54.
Tillin, M. N. A., & Bishop, D. (2009). Factors modulating post-activation potentiation and its effect on performance
of subsequent explosive activities. Sports Medicine, 39, 147–166.
Witmer, C. A., Davis, S. E., & Moir, G. L. (2010). The acute effects of back squats on vertical jump performance in
men and women. Journal of Sports Science and Medicine, 9, 206–213.
Young, W. (1995). Laboratory strength assessment of athletes. New Studies in Athletics, 10, 88–96.
Young, W. B., Jenner, A., & Griffiths, K. (1998). Acute enhancement of power performance from heavy load squats.
The Journal of Strength & Conditioning Research, 12, 82–84.
Zatsiorsky, V. M. (1995). Science and practice of strength training. Champaign, IL: Human Kinetics.
46 R. Healy & A.J. Harrison