HDFC Sec ETFs review - September 2012
•
1 like•313 views

1) The corpus of ETFs in India rose 1.8% in August to Rs. 12,249 crore, led by a 3% rise in gold ETFs to Rs. 10,398 crore. However, other ETFs saw a 5% decrease to Rs. 1,548 crore despite equity market gains. 2) Gold ETFs saw net inflows of Rs. 88 crore for the month while other ETFs saw outflows of Rs. 88 crore. 3) Total monthly trading volume for ETFs increased 13% to Rs. 752 crore, with gold ETFs contributing 46% of volume.

Recommended
More Related Content
Viewers also liked
Viewers also liked (12)
Similar to HDFC Sec ETFs review - September 2012
Similar to HDFC Sec ETFs review - September 2012 (14)
More from Dhuraivel Gunasekaran
More from Dhuraivel Gunasekaran (20)
Recently uploaded
Recently uploaded (20)
HDFC Sec ETFs review - September 2012
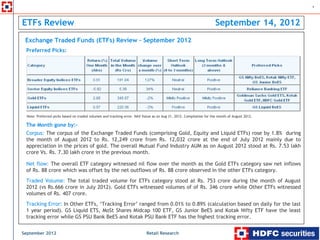
- 1. 1 ETFs Review September 14, 2012 Exchange Traded Funds (ETFs) Review – September 2012 Preferred Picks: Note: Preferred picks based on traded volumes and tracking error. NAV Value as on Aug 31, 2012. Compilation for the month of August 2012. The Month gone by:- Corpus: The corpus of the Exchange Traded Funds (comprising Gold, Equity and Liquid ETFs) rose by 1.8% during the month of August 2012 to Rs. 12,249 crore from Rs. 12,032 crore at the end of July 2012 mainly due to appreciation in the prices of gold. The overall Mutual Fund Industry AUM as on August 2012 stood at Rs. 7.53 lakh crore Vs. Rs. 7.30 lakh crore in the previous month. Net flow: The overall ETF category witnessed nil flow over the month as the Gold ETFs category saw net inflows of Rs. 88 crore which was offset by the net outflows of Rs. 88 crore observed in the other ETFs category. Traded Volume: The total traded volume for ETFs category stood at Rs. 753 crore during the month of August 2012 (vs Rs.666 crore in July 2012). Gold ETFs witnessed volumes of of Rs. 346 crore while Other ETFs witnessed volumes of Rs. 407 crore. Tracking Error: In Other ETFs, ‘Tracking Error’ ranged from 0.01% to 0.89% (calculation based on daily for the last 1 year period). GS Liquid ETS, MoSt Shares Midcap 100 ETF, GS Junior BeES and Kotak Nifty ETF have the least tracking error while GS PSU Bank BeES and Kotak PSU Bank ETF has the highest tracking error. September 2012 Retail Research
- 2. 2 ETFs Review contd… Domestic Equity Market: Indian markets ended the month of August on a positive note on hopes of quick implementation of reforms by the Indian Government coupled with the speculation that US would go for QE3. BSE Sensex & Nifty gained 1.5% & 0.6% respectively during the month. Global Equity Market: The world markets mostly ended the month of August 2012 on a positive note with Nasdaq, Japan and Brazil being the top three gainers, which rose by 4.3%, 1.7% and 1.7% respectively. Indonesia, Hong Kong, China and Singapore were the only losers, which fell by 2%, 1.6%, 2.7% and 0.4% respectively. Gold Market: Gold ETFs posted an average return of 2.05% in absolute term during the month of August 2012. The spot gold closed at $ 1657.75 per ounce, up $ 35 per ounce or 2.11 percent. The rise in the prices of gold is mainly attributable to an increased expectation that central banks may be set to launch more bullion-friendly stimulus measures. Fixed Income market: Prices of debt instruments firmed up slightly due to improved liquidity conditions coupled with weak domestic economic numbers. The 10 Year G Sec benchmark closed at 8.24% Vs. 8.25% in the previous month. I. Trend in the ETFs AUM: The corpus of the overall ETFs witnessed an increase by 1.8% during the month of August 2012 to Rs. 12,249 crore from Rs. 12,032 crore in the month earlier. The increase in the overall ETFs AUM was mainly attributable to the rise in the prices of gold. The AUM of Gold ETFs saw rise in AUM by 3% or Rs.303 crore to Rs. 10,398 crore during the month. Gold prices rose close to 2% during the month tracking gains in overseas markets and strong festive demand in the country. Gold prices are expected to remain high in the near term as more news is awaited concerning the euro zone crisis. It is to be noted that the prices of the local gold touched the Rs. 32,000 mark first time on 6th September 2012 driven by increased buying ahead of the marriage season coupled with amid a firming global trend. On the other hand, despite the surge in the equity markets, the “Other ETFs” category witnessed decrease in the AUM during August by 5% or Rs. 86 crore to Rs. 1,548 crore mainly due to net outflows from the category. September 2012 Retail Research
- 3. 3 ETFs Review contd… Growth of ETF Corpus over periods: 12000 3500 Gold ETF (LHS) Other ETFs (RHS) 10000 3000 8000 2500 6000 2000 4000 1500 2000 1000 0 500 Jun-09 Oct-09 Dec-09 Feb-10 Jun-10 Oct-10 Dec-10 Feb-11 Jun-11 Oct-11 Dec-11 Feb-12 Jun-12 Aug-09 Apr-10 Aug-10 Apr-11 Aug-11 Apr-12 Aug-12 Note: Other ETFs include Equity ETFs, Liquid ETFs and International ETFs. Source: AMFI monthly Data. II. Trend in the Fund Flows in the ETFs: The overall ETF category witnessed nil flow over the month as the Gold ETFs category saw net inflows of Rs. 88 crore which was offset by the net outflows of Rs. 88 crore in the other ETFs category. Gold has been an asset class attracting the investors flow over the periods. The depreciation in the rupee value compared to the USD also resulted in increase in local gold prices to above Rs 32,000 per 10g. Other ETFs, comprising domestic equity, international equity and liquid ETFs, saw fund outflows for the month after witnessing net inflows in the last two months. September 2012 Retail Research
- 4. 4 ETFs Review contd… The charts below portray the fund flows into Gold ETFs and Other ETFs categories (as per AMFI monthly data) over the last three year period. Gold ETFs saw net inflows for most of the months reflecting the investors’ increased interest. How ever, the outflows in the recent months show the opportunistic selling that hit the gold ETFs. In the case of other ETFs there is no consistency in flows as inflows in one month is followed by outflows in the next and so on. Net flows in Gold ETFs over periods: 1200 1000 800 600 400 200 0 -200 -400 Mar-09 May-09 Jun-09 Jul-09 Oct-09 Nov-09 Dec-09 Jan-10 Feb-10 Mar-10 May-10 Jun-10 Jul-10 Oct-10 Nov-10 Dec-10 Jan-11 Feb-11 Mar-11 May-11 Jun-11 Jul-11 Oct-11 Nov-11 Dec-11 Jan-12 Feb-12 Mar-12 May-12 Jun-12 Jul-12 Sep-09 Sep-10 Sep-11 Apr-09 Aug-09 Apr-10 Aug-10 Apr-11 Aug-11 Apr-12 Aug-12 Net flows in other ETFs over periods: 600 400 200 0 -200 -400 -600 -800 Mar-09 May-09 Jun-09 Jul-09 Oct-09 Nov-09 Dec-09 Jan-10 Feb-10 Mar-10 May-10 Jun-10 Jul-10 Oct-10 Nov-10 Dec-10 Jan-11 Feb-11 Mar-11 May-11 Jun-11 Jul-11 Oct-11 Nov-11 Dec-11 Jan-12 Feb-12 Mar-12 May-12 Jun-12 Jul-12 Sep-09 Sep-10 Sep-11 Apr-09 Aug-09 Apr-10 Aug-10 Apr-11 Aug-11 Apr-12 Aug-12 September 2012 Retail Research
- 5. 5 ETFs Review contd… Investors’ waning interest in gold: 1400 Fresh Sales (RHS) Redem ption (LHS) 500 1200 400 1000 300 800 600 200 400 100 200 0 0 Jan-11 Feb-11 Mar-11 May-11 Jun-11 Jul-11 Oct-11 Nov-11 Dec-11 Jan-12 Feb-12 Mar-12 May-12 Jun-12 Jul-12 Sep-11 Apr-11 Aug-11 Apr-12 Aug-12 Source: AMFI monthly Data. The above chart represents the investors’ interest in gold in the last 18 months (as per the AMFI monthly data). The charts clearly shows the investors’ waning interest in gold especially in the last one year period. Buying behavior (represented by blue line) witnessed a fall after September 2011 in the wake of sharp run up and volatility in the prices of gold. Meanwhile, redemptions that are made in the Gold ETFs also saw an increase in the given periods because of profit booking at higher level (represented by red line). However, gold prices are expected to remain high in the near term as more news is awaited on the global front concerning the euro zone crisis coupled with marriage season in the domestic front. September 2012 Retail Research
- 6. 6 ETFs Review contd… III. Trend in the Folios in the ETFs: Gold ETFs witnessed a decline in the number of folios by 6,570 in the month of August 2012 to 4.85 lakhs. The Gold ETFs category lost 10,817 of folios during the month of July 2012. The equity funds also saw reduction in the number of folios over the periods as the category witnessed folios closure of about 25 lakh in the last one year period. That was mainly due to the scheme mergers and folio de-duplication exercise carried out by R&Ts in the recent periods apart from redemptions. Contrary to this, number of folios of ‘Other ETFs’ have been increasing over periods due to attraction towards the diversified, broader market indices in the wake of risk aversion. Changes in investors’ Gold ETF folios: 600,000 500,000 400,000 300,000 200,000 100,000 0 Oct-10 Nov-10 Dec-10 Jan-11 Feb-11 Mar-11 Jun-11 Jul-11 Oct-11 Nov-11 Dec-11 Jan-12 Feb-12 Mar-12 May-12 Jun-12 Jul-12 Sep-10 Sep-11 Apr-11 Aug-11 Apr-12 Aug-12 September 2012 Retail Research
- 7. 7 ETFs Review contd… IV. Trend in the traded volume: The total traded volume of the overall ETF category during August 2012 stood at Rs. 752 crore, which is 13% greater than that of the previous month of July 2012 (Rs. 666 crore). The volume data includes all ETFs, taken from NSE (barring 2 Sensex ETFs which data are taken from BSE). The increase in the turnover was seen more in ‘Broader Indices ETFs’ in the category compared to the previous month. Goldman Sachs Gold ETF, Goldman Sachs Nifty ETF and Goldman Sachs Liquid ETF are the top traded ETFs in the overall ETF category Among the ETFs, the ‘Gold ETFs’ contributed 46% of the total trading volumes during the month, followed by the ‘Liquid ETFs’ and ‘Broader Indices ETFs’ which contributed 29% and 24% respectively. Segment break up of total turnover (Rs. 752 crore) in the ETF category during August 2012: Broader Indices ETFs: In August 2012, the total traded volume in the broader Indices ETFs stood at Rs. 181 crore. GS Nifty ETF, Kotak Sensex ETF Gold ETFs 345.57 Crs and Kotak Nifty ETF were the top 3 ETFs from the Liquid ETFs 220.36 Crs category having the traded volume of Rs. 89 crore, Rs. 31 crore and Rs. 25 crore respectively. Others 0.17 Crs Broader Indices ETFs 181.04 Crs Sector Indices ETFs: Goldman Sachs Banking Index ETF is the ETF from the category that witnessed Sector Indices ETFs 5.39 Crs turnover of Rs. 2.8 crore during the month. Liquid ETFs: Goldman Sachs Liquid ETF, the only ETF from the category witnessed trading Rs. 220 crore during last month. Gold ETFs: Among 14 Gold ETFs the top 3 gold ETF contributed 80% of the total trading volumes within the category during the month. They are Goldman Sachs Gold ETF, Kotak Gold ETF and Reliance Gold ETF. They accounted for volumes of Rs. 201 crore, Rs. 44 crore and Rs. 29 crore respectively. September 2012 Retail Research
- 8. 0 100 200 300 400 500 0 20 40 60 80 100 Jul-09 Jul-09 Aug-09 Sep-09 Nov-09 Nov-09 Dec-09 September 2012 Feb-10 Mar-10 Mar-10 May-10 Jul-10 Jun-10 ETFs Review Aug-10 Sep-10 Nov-10 O ct-10 Dec-10 Jan-11 Mar-11 Mar-11 Apr-11 Jul-11 Jun-11 Jul-11 Aug-11 Nov-11 O ct-11 Dec-11 Jan-12 Mar-12 Mar-12 Daily turnover (Rs Crs) in Sector Indices ETFs: Apr-12 Daily turnover (Rs Crs) in the Gold ETF category: Jul-12 May-12 Jul-12 Aug-12 0 10 20 30 40 50 60 70 0 20 40 60 80 100 Jul-09 Jul-09 Retail Research Sep-09 Sep-09 Jan-10 Jan-10 Apr-10 Apr-10 Jul-10 Jul-10 Sep-10 Sep-10 Dec-10 Dec-10 Mar-11 Mar-11 Jun-11 Jun-11 Sep-11 Sep-11 Daily turnover (Rs Crs) in the Liquid ETF: Jan-12 Jan-12 Apr-12 Apr-12 Jun-12 Jun-12 Daily turnover (Rs Crs) in the Broader Indices ETFs: contd… 8
- 9. 9 ETFs Review contd… Classification of ETF category: The overall ETFs category is mainly classified as ‘Gold ETFs’ and ‘Other ETFs’. The ‘Other ETFs’ is further sub-classified as Broader Equity Indices ETFs, Sector Equity Indices ETFs, Liquid ETFs and Thematic Equity Indices ETFs. Broader Equity Indices ETFs includes Sensex ETFs, Nifty ETFs, Capitalization ETFs and International ETFs. Sector Equity Indices ETFs includes Banking ETFs and PSU Banking ETFs. Thematic Equity Indices ETFs contains Infra ETFs and Shariah ETFs. Tracking Error: The primary objective of ETFs is to track closely and replicate the performance of the underlying index. Tracking error helps out the investors to measure how closely the ETF tracks the underling index. For investors’ point of view, the lower the tracking error, the better is the ETF. V. Performance:: Relative performance of ETFs on various time frames: Note: Trailing Returns up to 1 year are absolute and over 1 year are CAGR. Schemes chosen based on the larger traded volume in the respective categories. NAV Value as on Aug 31, 2012. September 2012 Retail Research
- 10. 10 ETFs Review contd… a. Gold ETFs: Gold ETFs posted an average return of 2.05% in absolute term during the month of August 2012. The spot gold closed at $ 1657.75 per ounce, up $ 35 per ounce or 2.11%. The rise in the prices of gold is mainly attributable to an increased expectation that central banks may be set to launch more bullion-friendly stimulus measures. Gold prices are expected to remain high in the near term given the expectation of additional stimulus measures to counter the euro zone crisis coupled with the festive season in India. The weakness in the Indian rupee against the U.S. dollar aided gold to maintain its sheen in local market. The chart below shows the relationship between spot gold price in USD and INR. In the chart, the international and domestic prices of gold were in tandem till about March 2012, post which there is a divergence due to a sharp depreciation in Rupee value vis-à-vis the USD. Interactive Gold price chart: September 2012 Retail Research
- 11. 11 ETFs Review contd… b. Broader Equity Indices ETFs: Indian equity benchmark indices ended the month of August 2012 in the positive with Sensex gaining 1.5% and the Nifty ended higher by 0.6% on hopes of quick implementation of reforms by the Indian Government. The rally was also supported by speculation that US would go for QE3 (Quantitative Easing) and on hopes of positive outcome from the ECB meeting. Snapping a losing streak of three straight weeks, Indian equities benchmark indices gained more than two percent in the first week of the month on the back of positive cues from global markets. The market extended its weekly gains in 2nd, 3rd and 4th week of the month as well but reversed the trend by ending the fifth week in red. Among Broader Equity Indices ETFs, the ETFs that tracks Sensex and Nifty posted an average return of 0.78% over the month of August. The international ETFs, Motilal Oswal MoSt Shares NASDAQ-100 ETF rose 4.61% while GS Hang Seng BeES registered -1.6%. GS Junior BeES lost 1.23% while MoSt Shares Midcap 100 ETF lost 1.16%. Movement of broader Equity Indices over one year period: 120 CNX Midcap Sensex NIFTY 115 110 105 100 95 90 85 80 75 70 Oct-11 Nov-11 Dec-11 Jan-12 Feb-12 Mar-12 May-12 Jun-12 Jul-12 Sep-11 Aug-11 Apr-12 Aug-12 September 2012 Retail Research
- 12. 12 ETFs Review contd… c. Sector Equity Indices ETFs: The sector Equity Indices ETFs, including Banking and PSU Banking ETFs, registered returns of -3.78% and -8.06% respectively during the month of August 2012. The respective benchmarks CNX Bank and CNX PSU Banks registered -3.8% and -8.07% respectively. The PSU index ended in the red at the end of August 2012. Bank of India, Canara Bank, BEML and HPCL lost 13.6%, 13.3%, 13% and 12.9% respectively. PSU stocks faced the brunt of profit booking. In Q1FY13 on asset quality front, PSU banks performance was quite dismal with sharp jump in gross slippage ratio. Canara Bank reported a lower than expected 6.8% year-on-year growth in net profit at Rs.780 cr, and 2.8% rise in net interest income (NII) for the quarter ended June 2012. Net interest margin (NIM) declined 10 basis points (bps) at 2.4% on quarter-on- quarter basis primarily driven by sequential drop in the yields and rise in cost of funds. The falling share of high yielding small and medium enterprise (SME) and retail loans, over 100bps decline in current account, savings account (CASA) and higher bulk deposit at around 40% led to further contraction in NIMs. Movement of banking Equity Indices over one year period: 110 CNX PSU Banks S&P CNX Bank 105 100 95 90 85 80 75 70 Oct-11 Nov-11 Dec-11 Jan-12 Feb-12 Mar-12 May-12 Jun-12 Jul-12 Sep-11 Aug-11 Apr-12 Aug-12 September 2012 Retail Research
- 13. 13 ETFs Review contd… d. Liquid ETF: GS Liquid BeES, the only Debt ETF in the Indian mutual fund industry, tracks Crisil Liquid Fund Index as benchmark. The investment objective of GS Liquid BeES is to enhance returns and minimize price risk by investing in a basket of call money, short-term government securities and money market instruments of short maturities while maintaining safety and liquidity. The scheme registered 0.57% of absolute returns during last month. The scheme underperformed liquid schemes and benchmark in terms of performance due to its lower maturity profile. The scheme has maintained as average maturity as one day while the category of liquid funds has maturity of 40 days. Performance of GS Liquid BeES on various periods: September 2012 Retail Research
- 14. 14 ETFs Review contd… VI. Discount (+) / Premium (-) of NAV to the Spot Price over the quarter: September 2012 Retail Research
- 15. 15 ETFs Review contd… . Analyst: Dhuraivel Gunasekaran. (Data sources: SEBI, AMFI, BSE, NSE, AMC Sites, NAVIndia and Ace MF) HDFC Securities Limited, I Think Techno Campus, Bulding –B, ”Alpha”, Office Floor 8, Near Kanjurmarg Station, Opp. Crompton Greaves, Kanjurmarg (East), Mumbai 400 042 Phone (022) 30753400 Fax: (022) 30753435 Disclaimer: Mutual Fund investments are subject to risk. Past performance is no guarantee for future performance. This document has been prepared by HDFC Securities Limited and is meant for sole use by the recipient and not for circulation. This document is not to be reported or copied or made available to others. It should not be considered to be taken as an offer to sell or a solicitation to buy any security. The information contained herein is from sources believed reliable. We do not represent that it is accurate or complete and it should not be relied upon as such. We may have from time to time positions or options on, and buy and sell securities referred to herein. We may from time to time solicit from, or perform investment banking, or other services for, any company mentioned in this document. This report is intended for non- Institutional Clients. September 2012 Retail Research