SlideShare a Scribd company logo
1 of 4
Download to read offline
Non-COI Barcode Regions — Guidelines for CBOL Approval
The Consortium for the Barcode of Life (CBOL) has so far accepted COI (mitochondrial
encoded cytochrome oxidase 1) as the default DNA barcode region for vertebrates and
insects and promotes its use in as many other clades as possible. This widespread
adoption of COI as barcode region offers significant benefits to researchers and barcode
users. The International Nucleotide Sequence Database Collaboration (INSDC, consisting
of GenBank, the European Molecular Biology Laboratory and the DNA Data Bank of
Japan) has adopted the data standards proposed by CBOL for BARCODE data records,
and has empowered CBOL to decide which gene regions can be given BARCODE status.
In addition to promoting standardization of barcode regions, CBOL also seeks extending
the application of DNA barcoding across all eukaryotic life. CBOL recognizes that:
  • COI does not vary in some taxonomic groups, or can be prone to exceptional
    molecular evolutionary processes in ways preventing it from being an effective
    barcode region;
  • COI may not be able to resolve species-level differences in all subgroups of a
    taxonomic group, and additional sequence data may be needed from a second or
    even third region in such cases; and
  • Researchers may have already gathered significant volumes of data using a
    different gene region in a particular taxonomic group which would, if properly
    vouchered, provide good DNA barcoding potential.

For these reasons, CBOL has developed the following guidelines for the adoption of gene
regions other than COI as the barcode region for a particular clade. These guidelines
specify the documentation that must be submitted to CBOL as an application for
BARCODE status in INSDC. Proposals will be reviewed by CBOL’s Scientific Advisory
Board, which will provide its advice to CBOL’s Executive Committee, which will reach
a final decision.
In order to support adopting non-COI regions for DNA barcoding the following questions
need to be addressed:
  a) Has COI been proven ineffective as a barcode region for the clade under
     consideration?
  b) Have alternative candidate regions been tested, screened, and compared in a
     systematic manner, i.e. can they recognize sisters in (as many as possible) species
     pairs within the clade?
  c) There may be clade-specific biological reasons for adopting an alternative method
     of assigning barcode regions. What is the rationale and performance of the
     proposed method?
  d) Does the proposed gene region work effectively as a barcode across the clade under
     consideration and is it easily PCR amplified even from degraded tissues?
  e) Is universality of primers expected to be feasible for this region and clade?

In order to standardize the assessment of non-CO1 regions as much as possible we ask
proposers to use the following guidelines when preparing their proposals:
1. Rejection of COI. Before CBOL will consider a non-COI region, applicants must
   document the ineffectiveness of COI as a barcode region in the taxonomic group of
   interest. Proposers must provide evidence that address the following:
   a) PCR problems. In case COI is rejected as barcode region owing to the inability to
      extract or amplify COI, the proposer must document his/her efforts to:
      i) test different extraction methods and amplification protocols;
      ii) develop new primers; and
      iii) consult with other barcode researchers.
   b) Pattern of intra and inter specific variation. Using data from INSDC, or other
      public databases, proposers should collect sequences of the COI from several
      groups of sibling species across the clade of interest. Sequence divergence d
      should be estimated with a model of evolution appropriate at that level of
      variation (e.g. K2P). Intra- and inter specific variation should be compared and
      expressed as the ratio of the two values, dintra/dinter, and plotted as in Fig. 1.
      Proposers should also provide a Neighbor-Joining tree of the sequence distances
      in order to demonstrate the failure of specific clustering. Finally, if applicable, a
      description of possible variation due to the presence of indels should be included.
   c) Resolving power. Using data from INSDC or other public databases, proposers
      should document the incapacity of COI to discriminate between as many sibling
      species pair as possible, with each species represented by multiple individuals
      from different geographical areas of its range. Individuals should be sampled
      following the criteria already established by CBOL’s Database Working Group
      (clear sample locations, taxonomic identifications, availability of vouchers).

2. Selection of non-COI barcode region. Proposers must document the process
   used to identify the proposed region as the optimal barcode region for the taxonomic
   group under consideration. CBOL will not accept a proposal based only on the
   volume of sequence data that has been collected for a gene region in the past. What
   other candidate regions have been tested? How were they screened and compared? In
   any case at least K2P-based Neighbor Joining should be applied to test their
   effectiveness as barcodes.

3. Performance of the Non-COI Barcode Region and /or alternative
   selection method. Proposers must present the following evidence that the
   proposed region works effectively as a barcode across the taxonomic group under
   consideration (see Table 1):
   a) Pattern of intra and inter specific variation. Using data from INSDC, or other
      public databases, proposers should collect sequence of the new marker from
      several groups of sibling species across the clade of interest. Sequence divergence
      d should be estimated with a model of evolution appropriate at that level of
      variation (e.g. K2P). Intra- and inter specific variation should be compared and
      expressed as the ratio of the two values, dintra/dinter, and plotted as in Fig. 1. Ideally
      the presence of a ‘barcode gap’ (i.e., interspecific divergences that are clearly
      greater than intraspecific variation) would emerge from this, however this is not
      an absolute requirement for approval. In case of absence of a barcode gap,
proposers should provide a Neighbor-Joining tree of the sequence distances as
       well in order to demonstrate specific clustering. In any case, a description of
       possible variation due to the presence of indels should be included.
   b) Resolving power. Using data from INSDC or other public databases, proposers
      should document the capacity of the new marker and the chosen method to
      discriminate between as many sibling species pairs as possible, with each species
      represented by multiple individuals from different geographical areas of the
      species range. Individuals should be sampled following the criteria already
      established by CBOL’s Database Working Group (clear sample locations,
      taxonomic identifications, availability of vouchers).
   c) Universality. The effectiveness of the best primer pair for the proposed region,
      and the return on investment in developing extra customized primers for
      generating barcodes for species included in the targeted clade, i.e. will it be worth
      while developing truely universal primers in my clade?, should be documented
      (see also Table 1).

Implementation. The current protocols will be adopted for a period of 6 months during
which CBOL is open to suggestions for improvement from the community. If for
instance, alternative methods of barcode region selection are proposed, the rationale for
doing so should be documented. For example, different clades could have different
reproductive, life history, and/or molecular evolutionary features such that some
approaches are more effective than others. Proposers should document their analysis as
described in point 3.

We would encourage proposers to publish their alternative marker along with the
evidence following from these guidelines so that the entire community has a chance to be
aware of the intent. For instance, PLoS One would be ideal where the community can
offer feedback to the publication. After the nomination paper, CBOL in consultation with
INSDC and the scientific community, will act on it and ensure the new barcode region is
adopted by GenBank.
Fig 1. Presence/Absence of barcode gap. Sequence divergence for different gene regions across
the same species

        20%                                                         Shapes are species pairs
                                                                    Colors are gene regions


                                        Barcode Gap
     Minimum
       percent
    interspecific
     divergence


                                                         1:1 line

                                                                           No Barcode Gap


                                          Maximum intraspecific divergence
                                                                                         10%


Table 1. Summary presented separately for each subclade and for entire clade
                                          Region A      Region B          Region C      Region D
Number of species pairs tested
(please indicate the number of
specimens tested per species)
% species successfully
amplified
% species successfully
identified + minimum number of
regions required for successful ID of
all species in the clade
Range of intraspecific                  Min-Max        Min-Max          Min-Max        Min-Max
variation1
Median % intraspecific
variation1
Range of minimum                        Min-Max        Min-Max          Min-Max        Min-Max
interspecific divergence (i.e.
                              1
between sibling species pairs)
Median % minimum
interspecific divergence1
1
 based on average appropriate distance across multiple specimens representing the
biogeographical range of the species

More Related Content

What's hot

GIAB Benchmarks for SVs and Repeats for stanford genetics sv 200511
GIAB Benchmarks for SVs and Repeats for stanford genetics sv 200511GIAB Benchmarks for SVs and Repeats for stanford genetics sv 200511
GIAB Benchmarks for SVs and Repeats for stanford genetics sv 200511GenomeInABottle
 
Development and use of different mapping population in brinjal
Development and use of different mapping population in brinjalDevelopment and use of different mapping population in brinjal
Development and use of different mapping population in brinjalBasavaraj Panjagal
 
Molecular quantitative genetics for plant breeding roundtable 2010x
Molecular quantitative genetics for plant breeding roundtable 2010xMolecular quantitative genetics for plant breeding roundtable 2010x
Molecular quantitative genetics for plant breeding roundtable 2010xFOODCROPS
 
Genome in a Bottle- reference materials to benchmark challenging variants and...
Genome in a Bottle- reference materials to benchmark challenging variants and...Genome in a Bottle- reference materials to benchmark challenging variants and...
Genome in a Bottle- reference materials to benchmark challenging variants and...GenomeInABottle
 
Association mapping for improvement of agronomic traits in rice
Association mapping  for improvement of agronomic traits in riceAssociation mapping  for improvement of agronomic traits in rice
Association mapping for improvement of agronomic traits in riceSopan Zuge
 
MAGIC populations and its role in crop improvement
MAGIC populations and its role in crop improvementMAGIC populations and its role in crop improvement
MAGIC populations and its role in crop improvementDr. Asit Prasad Dash
 
Molecular approaches in improvement of fruit crops
Molecular approaches in improvement of fruit cropsMolecular approaches in improvement of fruit crops
Molecular approaches in improvement of fruit cropsShabnamSyed3
 
Marker assisted selection
Marker assisted selectionMarker assisted selection
Marker assisted selectionFAO
 

What's hot (11)

GIAB Benchmarks for SVs and Repeats for stanford genetics sv 200511
GIAB Benchmarks for SVs and Repeats for stanford genetics sv 200511GIAB Benchmarks for SVs and Repeats for stanford genetics sv 200511
GIAB Benchmarks for SVs and Repeats for stanford genetics sv 200511
 
Development and use of different mapping population in brinjal
Development and use of different mapping population in brinjalDevelopment and use of different mapping population in brinjal
Development and use of different mapping population in brinjal
 
Molecular quantitative genetics for plant breeding roundtable 2010x
Molecular quantitative genetics for plant breeding roundtable 2010xMolecular quantitative genetics for plant breeding roundtable 2010x
Molecular quantitative genetics for plant breeding roundtable 2010x
 
MAGIC POPULATION
MAGIC POPULATIONMAGIC POPULATION
MAGIC POPULATION
 
Molecular markers
Molecular markersMolecular markers
Molecular markers
 
Genome in a Bottle- reference materials to benchmark challenging variants and...
Genome in a Bottle- reference materials to benchmark challenging variants and...Genome in a Bottle- reference materials to benchmark challenging variants and...
Genome in a Bottle- reference materials to benchmark challenging variants and...
 
Association mapping for improvement of agronomic traits in rice
Association mapping  for improvement of agronomic traits in riceAssociation mapping  for improvement of agronomic traits in rice
Association mapping for improvement of agronomic traits in rice
 
MAGIC populations and its role in crop improvement
MAGIC populations and its role in crop improvementMAGIC populations and its role in crop improvement
MAGIC populations and its role in crop improvement
 
Molecular approaches in improvement of fruit crops
Molecular approaches in improvement of fruit cropsMolecular approaches in improvement of fruit crops
Molecular approaches in improvement of fruit crops
 
Marker assisted selection
Marker assisted selectionMarker assisted selection
Marker assisted selection
 
MAS
MASMAS
MAS
 

Viewers also liked

Molecular murder mysteries 2013
Molecular murder mysteries 2013Molecular murder mysteries 2013
Molecular murder mysteries 2013bio-link
 
Many Notes pitch for App Circus at BlackBerry 10 Jam 2012
Many Notes pitch for App Circus at BlackBerry 10 Jam 2012Many Notes pitch for App Circus at BlackBerry 10 Jam 2012
Many Notes pitch for App Circus at BlackBerry 10 Jam 2012Will Robertson
 
Grandfather Paradox
Grandfather ParadoxGrandfather Paradox
Grandfather ParadoxGoldy Landau
 
Goldy ABRCMS Poster Final
Goldy ABRCMS Poster FinalGoldy ABRCMS Poster Final
Goldy ABRCMS Poster FinalGoldy Landau
 
Cytochrome c Oxidase Assay
Cytochrome c Oxidase AssayCytochrome c Oxidase Assay
Cytochrome c Oxidase AssayHenry Sergio Jr
 
DNA Barcoding: A simple way of identifying species by DNA
DNA Barcoding: A simple way of identifying species by DNADNA Barcoding: A simple way of identifying species by DNA
DNA Barcoding: A simple way of identifying species by DNAmarkstoeckle
 

Viewers also liked (6)

Molecular murder mysteries 2013
Molecular murder mysteries 2013Molecular murder mysteries 2013
Molecular murder mysteries 2013
 
Many Notes pitch for App Circus at BlackBerry 10 Jam 2012
Many Notes pitch for App Circus at BlackBerry 10 Jam 2012Many Notes pitch for App Circus at BlackBerry 10 Jam 2012
Many Notes pitch for App Circus at BlackBerry 10 Jam 2012
 
Grandfather Paradox
Grandfather ParadoxGrandfather Paradox
Grandfather Paradox
 
Goldy ABRCMS Poster Final
Goldy ABRCMS Poster FinalGoldy ABRCMS Poster Final
Goldy ABRCMS Poster Final
 
Cytochrome c Oxidase Assay
Cytochrome c Oxidase AssayCytochrome c Oxidase Assay
Cytochrome c Oxidase Assay
 
DNA Barcoding: A simple way of identifying species by DNA
DNA Barcoding: A simple way of identifying species by DNADNA Barcoding: A simple way of identifying species by DNA
DNA Barcoding: A simple way of identifying species by DNA
 

Similar to Guidelines for non-CO1 selection

DNA Barcoding and its application in species identification
DNA Barcoding and its application in species identificationDNA Barcoding and its application in species identification
DNA Barcoding and its application in species identificationsupriya k
 
Use of DNA barcoding and its role in the plant species/varietal Identifica...
Use of DNA  barcoding  and its role in the plant species/varietal  Identifica...Use of DNA  barcoding  and its role in the plant species/varietal  Identifica...
Use of DNA barcoding and its role in the plant species/varietal Identifica...Senthil Natesan
 
DNA barcoding and Insect Diversity Coservation
DNA barcoding and Insect Diversity CoservationDNA barcoding and Insect Diversity Coservation
DNA barcoding and Insect Diversity Coservationvishnugm
 
Johannes Bergsten Dna Barcoding
Johannes Bergsten Dna BarcodingJohannes Bergsten Dna Barcoding
Johannes Bergsten Dna Barcodingbioinfocourse
 
Gene gain and loss: aCGH. ISACGH
Gene gain and loss: aCGH. ISACGHGene gain and loss: aCGH. ISACGH
Gene gain and loss: aCGH. ISACGHRafael C. Jimenez
 
Giab for jax long read 190917
Giab for jax long read 190917Giab for jax long read 190917
Giab for jax long read 190917GenomeInABottle
 
DNA cell cycle by flow cytometry
DNA cell cycle by flow cytometryDNA cell cycle by flow cytometry
DNA cell cycle by flow cytometryRichard Hastings
 
GIAB and long reads for bio it world 190417
GIAB and long reads for bio it world 190417GIAB and long reads for bio it world 190417
GIAB and long reads for bio it world 190417GenomeInABottle
 
Genome in a Bottle - Towards new benchmarks for the “dark matter” of the huma...
Genome in a Bottle - Towards new benchmarks for the “dark matter” of the huma...Genome in a Bottle - Towards new benchmarks for the “dark matter” of the huma...
Genome in a Bottle - Towards new benchmarks for the “dark matter” of the huma...GenomeInABottle
 
El proyecto 1000 genomas
El proyecto 1000 genomas El proyecto 1000 genomas
El proyecto 1000 genomas Ultramolecular
 
Microarray @ujjwal sirohi
Microarray @ujjwal sirohiMicroarray @ujjwal sirohi
Microarray @ujjwal sirohiujjwal sirohi
 
491-1487159777.pdf
491-1487159777.pdf491-1487159777.pdf
491-1487159777.pdfawsadil29
 
491-1487159777.pdf
491-1487159777.pdf491-1487159777.pdf
491-1487159777.pdfawsadil29
 
Microbial Phylogenomics (EVE161) Class 7: rRNA PCR and Major Groups
Microbial Phylogenomics (EVE161) Class 7: rRNA PCR and Major Groups Microbial Phylogenomics (EVE161) Class 7: rRNA PCR and Major Groups
Microbial Phylogenomics (EVE161) Class 7: rRNA PCR and Major Groups Jonathan Eisen
 
Exploratory cox1 analyses unveil operational biases and blurry species bounda...
Exploratory cox1 analyses unveil operational biases and blurry species bounda...Exploratory cox1 analyses unveil operational biases and blurry species bounda...
Exploratory cox1 analyses unveil operational biases and blurry species bounda...Leonardo Gonçalves
 
MCQs on DNA MicroArray.pdf
MCQs on DNA MicroArray.pdfMCQs on DNA MicroArray.pdf
MCQs on DNA MicroArray.pdfRajendraChavhan3
 

Similar to Guidelines for non-CO1 selection (20)

DNA Barcoding and its application in species identification
DNA Barcoding and its application in species identificationDNA Barcoding and its application in species identification
DNA Barcoding and its application in species identification
 
Use of DNA barcoding and its role in the plant species/varietal Identifica...
Use of DNA  barcoding  and its role in the plant species/varietal  Identifica...Use of DNA  barcoding  and its role in the plant species/varietal  Identifica...
Use of DNA barcoding and its role in the plant species/varietal Identifica...
 
DNA barcoding and Insect Diversity Coservation
DNA barcoding and Insect Diversity CoservationDNA barcoding and Insect Diversity Coservation
DNA barcoding and Insect Diversity Coservation
 
Johannes Bergsten Dna Barcoding
Johannes Bergsten Dna BarcodingJohannes Bergsten Dna Barcoding
Johannes Bergsten Dna Barcoding
 
Gene gain and loss: aCGH. ISACGH
Gene gain and loss: aCGH. ISACGHGene gain and loss: aCGH. ISACGH
Gene gain and loss: aCGH. ISACGH
 
Giab for jax long read 190917
Giab for jax long read 190917Giab for jax long read 190917
Giab for jax long read 190917
 
Dr Robert Hanner - Barcode Data standards for animals, plants & fungi
Dr Robert Hanner - Barcode Data standards for animals, plants & fungiDr Robert Hanner - Barcode Data standards for animals, plants & fungi
Dr Robert Hanner - Barcode Data standards for animals, plants & fungi
 
DNA cell cycle by flow cytometry
DNA cell cycle by flow cytometryDNA cell cycle by flow cytometry
DNA cell cycle by flow cytometry
 
GIAB and long reads for bio it world 190417
GIAB and long reads for bio it world 190417GIAB and long reads for bio it world 190417
GIAB and long reads for bio it world 190417
 
Genome in a Bottle - Towards new benchmarks for the “dark matter” of the huma...
Genome in a Bottle - Towards new benchmarks for the “dark matter” of the huma...Genome in a Bottle - Towards new benchmarks for the “dark matter” of the huma...
Genome in a Bottle - Towards new benchmarks for the “dark matter” of the huma...
 
El proyecto 1000 genomas
El proyecto 1000 genomas El proyecto 1000 genomas
El proyecto 1000 genomas
 
Variant analysis and whole exome sequencing
Variant analysis and whole exome sequencingVariant analysis and whole exome sequencing
Variant analysis and whole exome sequencing
 
Microarray @ujjwal sirohi
Microarray @ujjwal sirohiMicroarray @ujjwal sirohi
Microarray @ujjwal sirohi
 
Microsatellite
MicrosatelliteMicrosatellite
Microsatellite
 
491-1487159777.pdf
491-1487159777.pdf491-1487159777.pdf
491-1487159777.pdf
 
491-1487159777.pdf
491-1487159777.pdf491-1487159777.pdf
491-1487159777.pdf
 
Microbial Phylogenomics (EVE161) Class 7: rRNA PCR and Major Groups
Microbial Phylogenomics (EVE161) Class 7: rRNA PCR and Major Groups Microbial Phylogenomics (EVE161) Class 7: rRNA PCR and Major Groups
Microbial Phylogenomics (EVE161) Class 7: rRNA PCR and Major Groups
 
Exploratory cox1 analyses unveil operational biases and blurry species bounda...
Exploratory cox1 analyses unveil operational biases and blurry species bounda...Exploratory cox1 analyses unveil operational biases and blurry species bounda...
Exploratory cox1 analyses unveil operational biases and blurry species bounda...
 
MCQs on DNA MicroArray.pdf
MCQs on DNA MicroArray.pdfMCQs on DNA MicroArray.pdf
MCQs on DNA MicroArray.pdf
 
Shotgun (2) metagenomics
Shotgun (2) metagenomicsShotgun (2) metagenomics
Shotgun (2) metagenomics
 

Guidelines for non-CO1 selection

  • 1. Non-COI Barcode Regions — Guidelines for CBOL Approval The Consortium for the Barcode of Life (CBOL) has so far accepted COI (mitochondrial encoded cytochrome oxidase 1) as the default DNA barcode region for vertebrates and insects and promotes its use in as many other clades as possible. This widespread adoption of COI as barcode region offers significant benefits to researchers and barcode users. The International Nucleotide Sequence Database Collaboration (INSDC, consisting of GenBank, the European Molecular Biology Laboratory and the DNA Data Bank of Japan) has adopted the data standards proposed by CBOL for BARCODE data records, and has empowered CBOL to decide which gene regions can be given BARCODE status. In addition to promoting standardization of barcode regions, CBOL also seeks extending the application of DNA barcoding across all eukaryotic life. CBOL recognizes that: • COI does not vary in some taxonomic groups, or can be prone to exceptional molecular evolutionary processes in ways preventing it from being an effective barcode region; • COI may not be able to resolve species-level differences in all subgroups of a taxonomic group, and additional sequence data may be needed from a second or even third region in such cases; and • Researchers may have already gathered significant volumes of data using a different gene region in a particular taxonomic group which would, if properly vouchered, provide good DNA barcoding potential. For these reasons, CBOL has developed the following guidelines for the adoption of gene regions other than COI as the barcode region for a particular clade. These guidelines specify the documentation that must be submitted to CBOL as an application for BARCODE status in INSDC. Proposals will be reviewed by CBOL’s Scientific Advisory Board, which will provide its advice to CBOL’s Executive Committee, which will reach a final decision. In order to support adopting non-COI regions for DNA barcoding the following questions need to be addressed: a) Has COI been proven ineffective as a barcode region for the clade under consideration? b) Have alternative candidate regions been tested, screened, and compared in a systematic manner, i.e. can they recognize sisters in (as many as possible) species pairs within the clade? c) There may be clade-specific biological reasons for adopting an alternative method of assigning barcode regions. What is the rationale and performance of the proposed method? d) Does the proposed gene region work effectively as a barcode across the clade under consideration and is it easily PCR amplified even from degraded tissues? e) Is universality of primers expected to be feasible for this region and clade? In order to standardize the assessment of non-CO1 regions as much as possible we ask proposers to use the following guidelines when preparing their proposals:
  • 2. 1. Rejection of COI. Before CBOL will consider a non-COI region, applicants must document the ineffectiveness of COI as a barcode region in the taxonomic group of interest. Proposers must provide evidence that address the following: a) PCR problems. In case COI is rejected as barcode region owing to the inability to extract or amplify COI, the proposer must document his/her efforts to: i) test different extraction methods and amplification protocols; ii) develop new primers; and iii) consult with other barcode researchers. b) Pattern of intra and inter specific variation. Using data from INSDC, or other public databases, proposers should collect sequences of the COI from several groups of sibling species across the clade of interest. Sequence divergence d should be estimated with a model of evolution appropriate at that level of variation (e.g. K2P). Intra- and inter specific variation should be compared and expressed as the ratio of the two values, dintra/dinter, and plotted as in Fig. 1. Proposers should also provide a Neighbor-Joining tree of the sequence distances in order to demonstrate the failure of specific clustering. Finally, if applicable, a description of possible variation due to the presence of indels should be included. c) Resolving power. Using data from INSDC or other public databases, proposers should document the incapacity of COI to discriminate between as many sibling species pair as possible, with each species represented by multiple individuals from different geographical areas of its range. Individuals should be sampled following the criteria already established by CBOL’s Database Working Group (clear sample locations, taxonomic identifications, availability of vouchers). 2. Selection of non-COI barcode region. Proposers must document the process used to identify the proposed region as the optimal barcode region for the taxonomic group under consideration. CBOL will not accept a proposal based only on the volume of sequence data that has been collected for a gene region in the past. What other candidate regions have been tested? How were they screened and compared? In any case at least K2P-based Neighbor Joining should be applied to test their effectiveness as barcodes. 3. Performance of the Non-COI Barcode Region and /or alternative selection method. Proposers must present the following evidence that the proposed region works effectively as a barcode across the taxonomic group under consideration (see Table 1): a) Pattern of intra and inter specific variation. Using data from INSDC, or other public databases, proposers should collect sequence of the new marker from several groups of sibling species across the clade of interest. Sequence divergence d should be estimated with a model of evolution appropriate at that level of variation (e.g. K2P). Intra- and inter specific variation should be compared and expressed as the ratio of the two values, dintra/dinter, and plotted as in Fig. 1. Ideally the presence of a ‘barcode gap’ (i.e., interspecific divergences that are clearly greater than intraspecific variation) would emerge from this, however this is not an absolute requirement for approval. In case of absence of a barcode gap,
  • 3. proposers should provide a Neighbor-Joining tree of the sequence distances as well in order to demonstrate specific clustering. In any case, a description of possible variation due to the presence of indels should be included. b) Resolving power. Using data from INSDC or other public databases, proposers should document the capacity of the new marker and the chosen method to discriminate between as many sibling species pairs as possible, with each species represented by multiple individuals from different geographical areas of the species range. Individuals should be sampled following the criteria already established by CBOL’s Database Working Group (clear sample locations, taxonomic identifications, availability of vouchers). c) Universality. The effectiveness of the best primer pair for the proposed region, and the return on investment in developing extra customized primers for generating barcodes for species included in the targeted clade, i.e. will it be worth while developing truely universal primers in my clade?, should be documented (see also Table 1). Implementation. The current protocols will be adopted for a period of 6 months during which CBOL is open to suggestions for improvement from the community. If for instance, alternative methods of barcode region selection are proposed, the rationale for doing so should be documented. For example, different clades could have different reproductive, life history, and/or molecular evolutionary features such that some approaches are more effective than others. Proposers should document their analysis as described in point 3. We would encourage proposers to publish their alternative marker along with the evidence following from these guidelines so that the entire community has a chance to be aware of the intent. For instance, PLoS One would be ideal where the community can offer feedback to the publication. After the nomination paper, CBOL in consultation with INSDC and the scientific community, will act on it and ensure the new barcode region is adopted by GenBank.
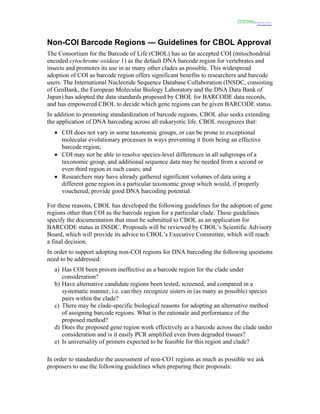
  • 4. Fig 1. Presence/Absence of barcode gap. Sequence divergence for different gene regions across the same species 20% Shapes are species pairs Colors are gene regions Barcode Gap Minimum percent interspecific divergence 1:1 line No Barcode Gap Maximum intraspecific divergence 10% Table 1. Summary presented separately for each subclade and for entire clade Region A Region B Region C Region D Number of species pairs tested (please indicate the number of specimens tested per species) % species successfully amplified % species successfully identified + minimum number of regions required for successful ID of all species in the clade Range of intraspecific Min-Max Min-Max Min-Max Min-Max variation1 Median % intraspecific variation1 Range of minimum Min-Max Min-Max Min-Max Min-Max interspecific divergence (i.e. 1 between sibling species pairs) Median % minimum interspecific divergence1 1 based on average appropriate distance across multiple specimens representing the biogeographical range of the species