Guide D Transportation Systems In Buildings 2010 Cibse Guide 4th Revised Edition Cibse
Guide D Transportation Systems In Buildings 2010 Cibse Guide 4th Revised Edition Cibse
Guide D Transportation Systems In Buildings 2010 Cibse Guide 4th Revised Edition Cibse


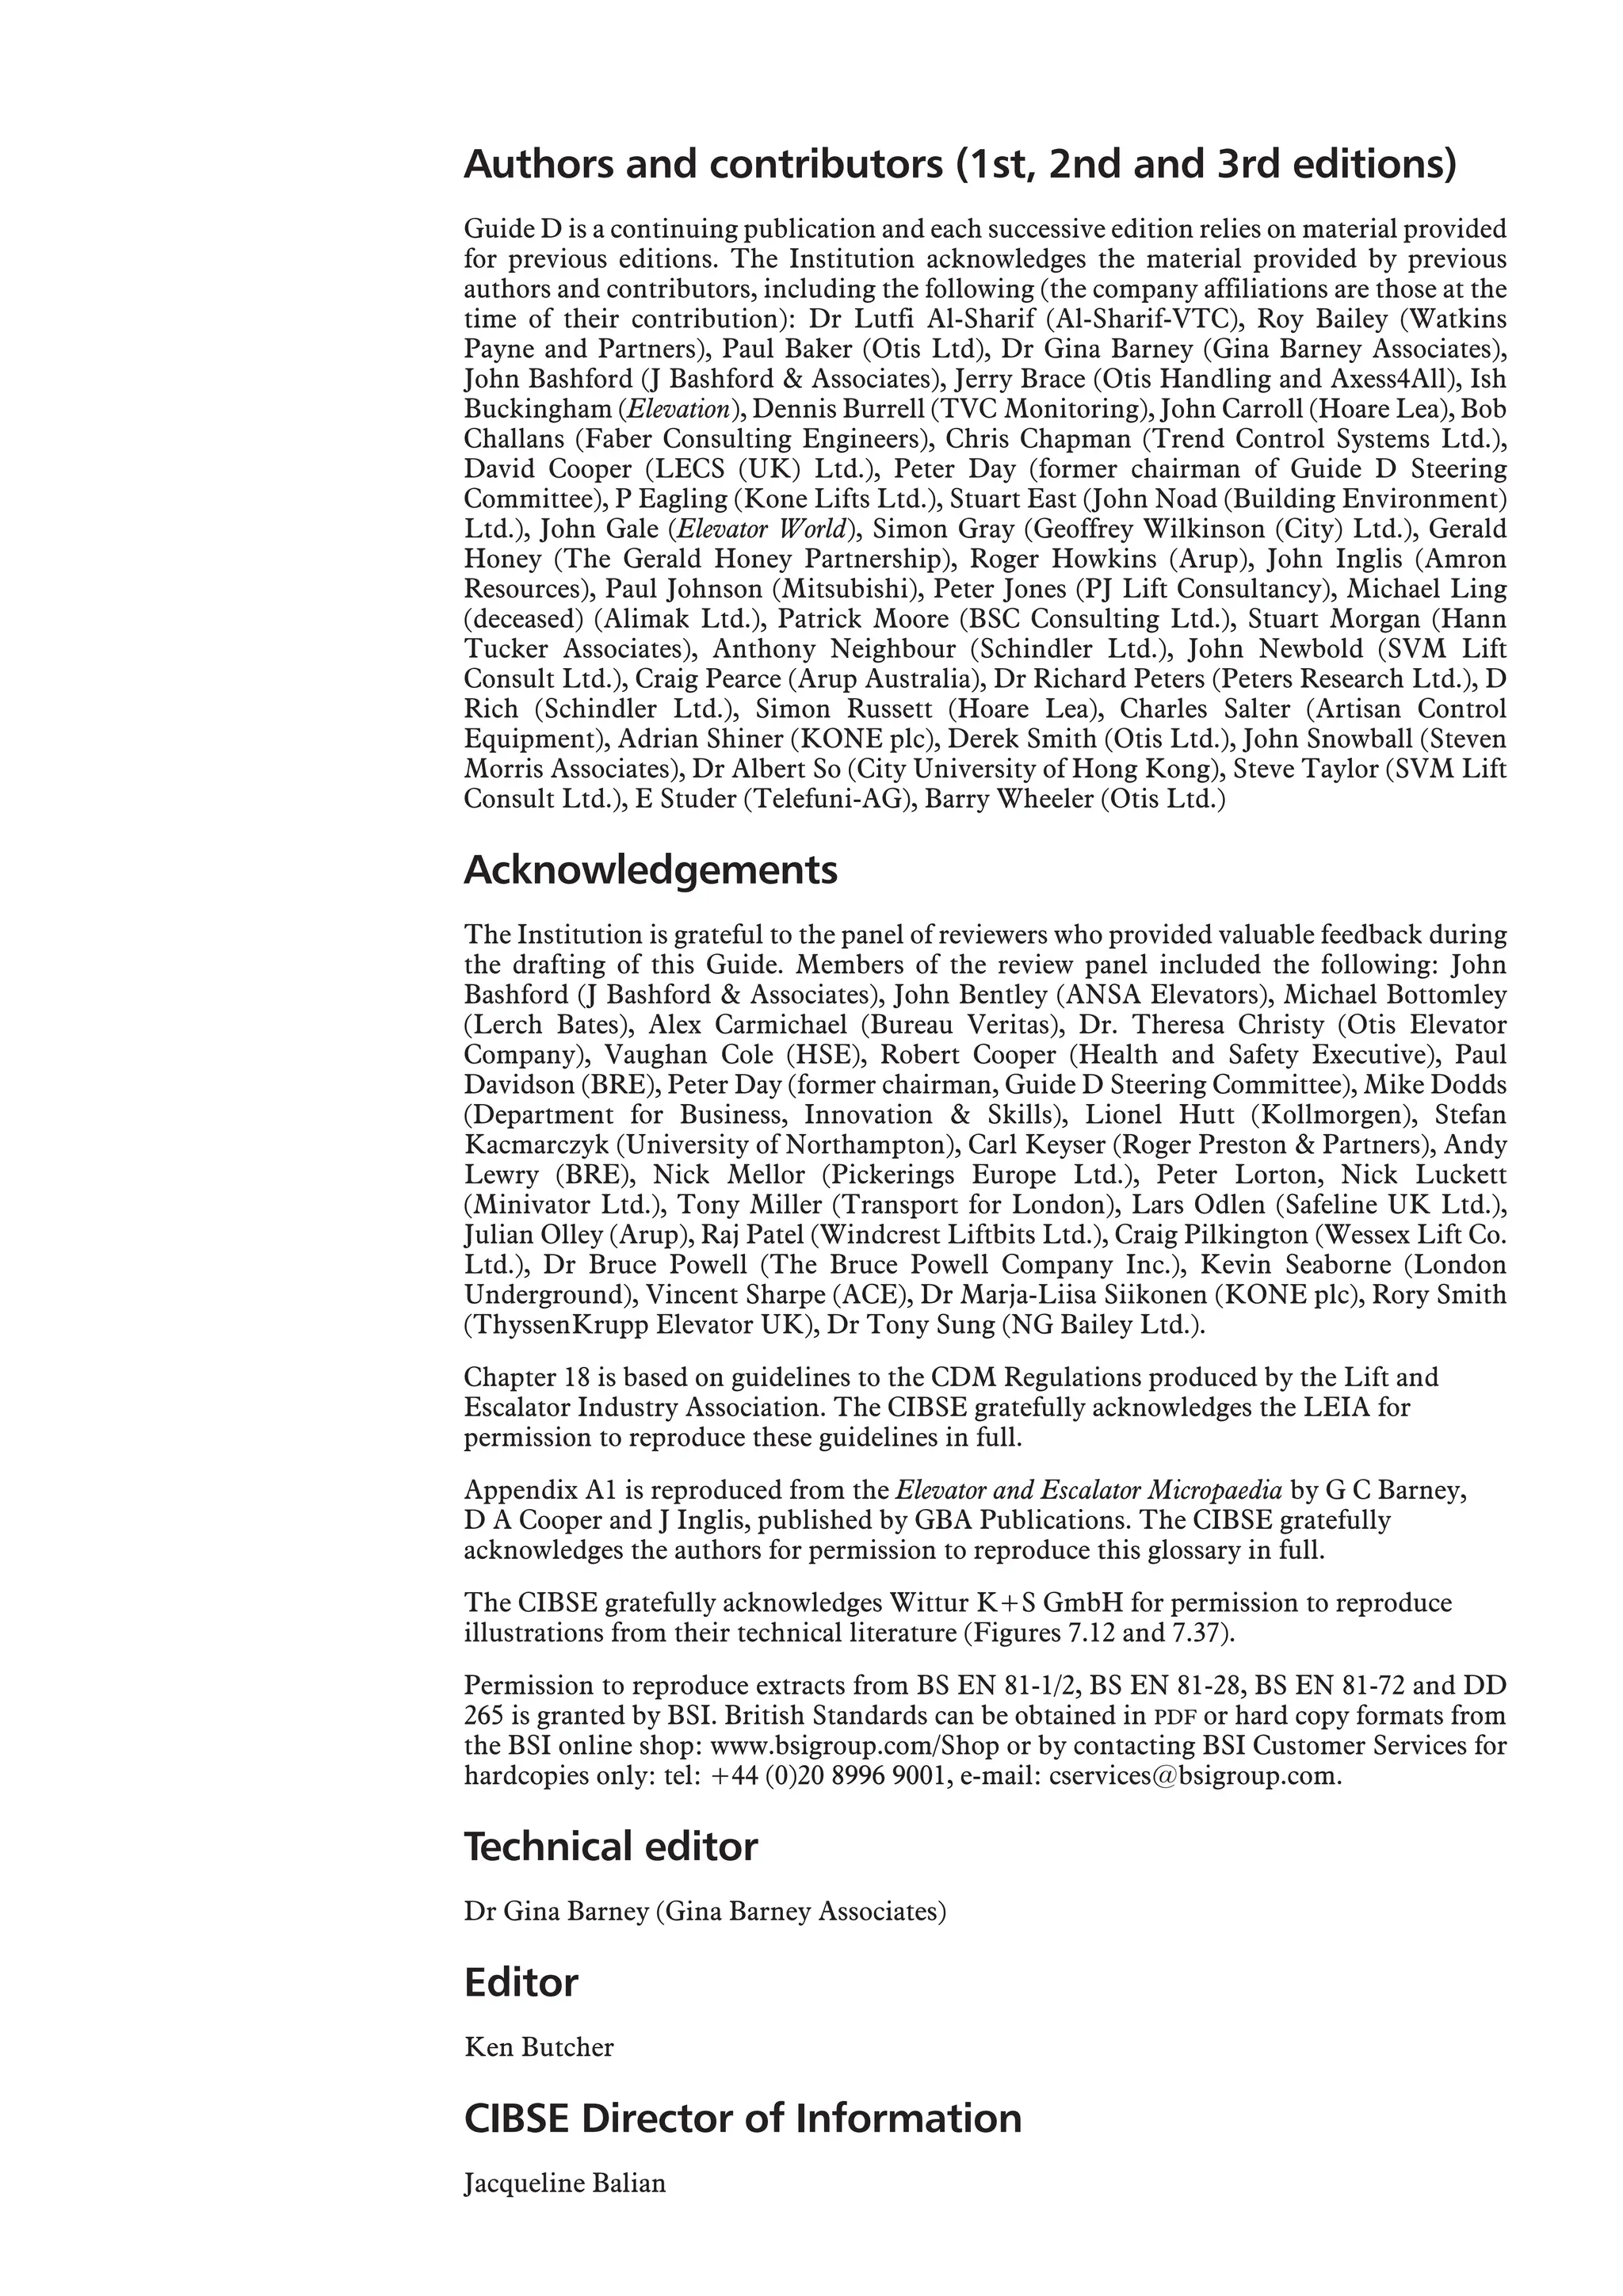


![Traffic planning and selection of lift equipment and performance 3-9
— Single floor flight time (tf(1)): 5.5 s
— Door close time (tc): 3.0 s
— Door open time (to): 2.0 s
— Advance door opening (tad): 1.0 s
— Start delay (tsd): 0.5 s
— Assumed one way passenger transfer time (tp): 1.0 s
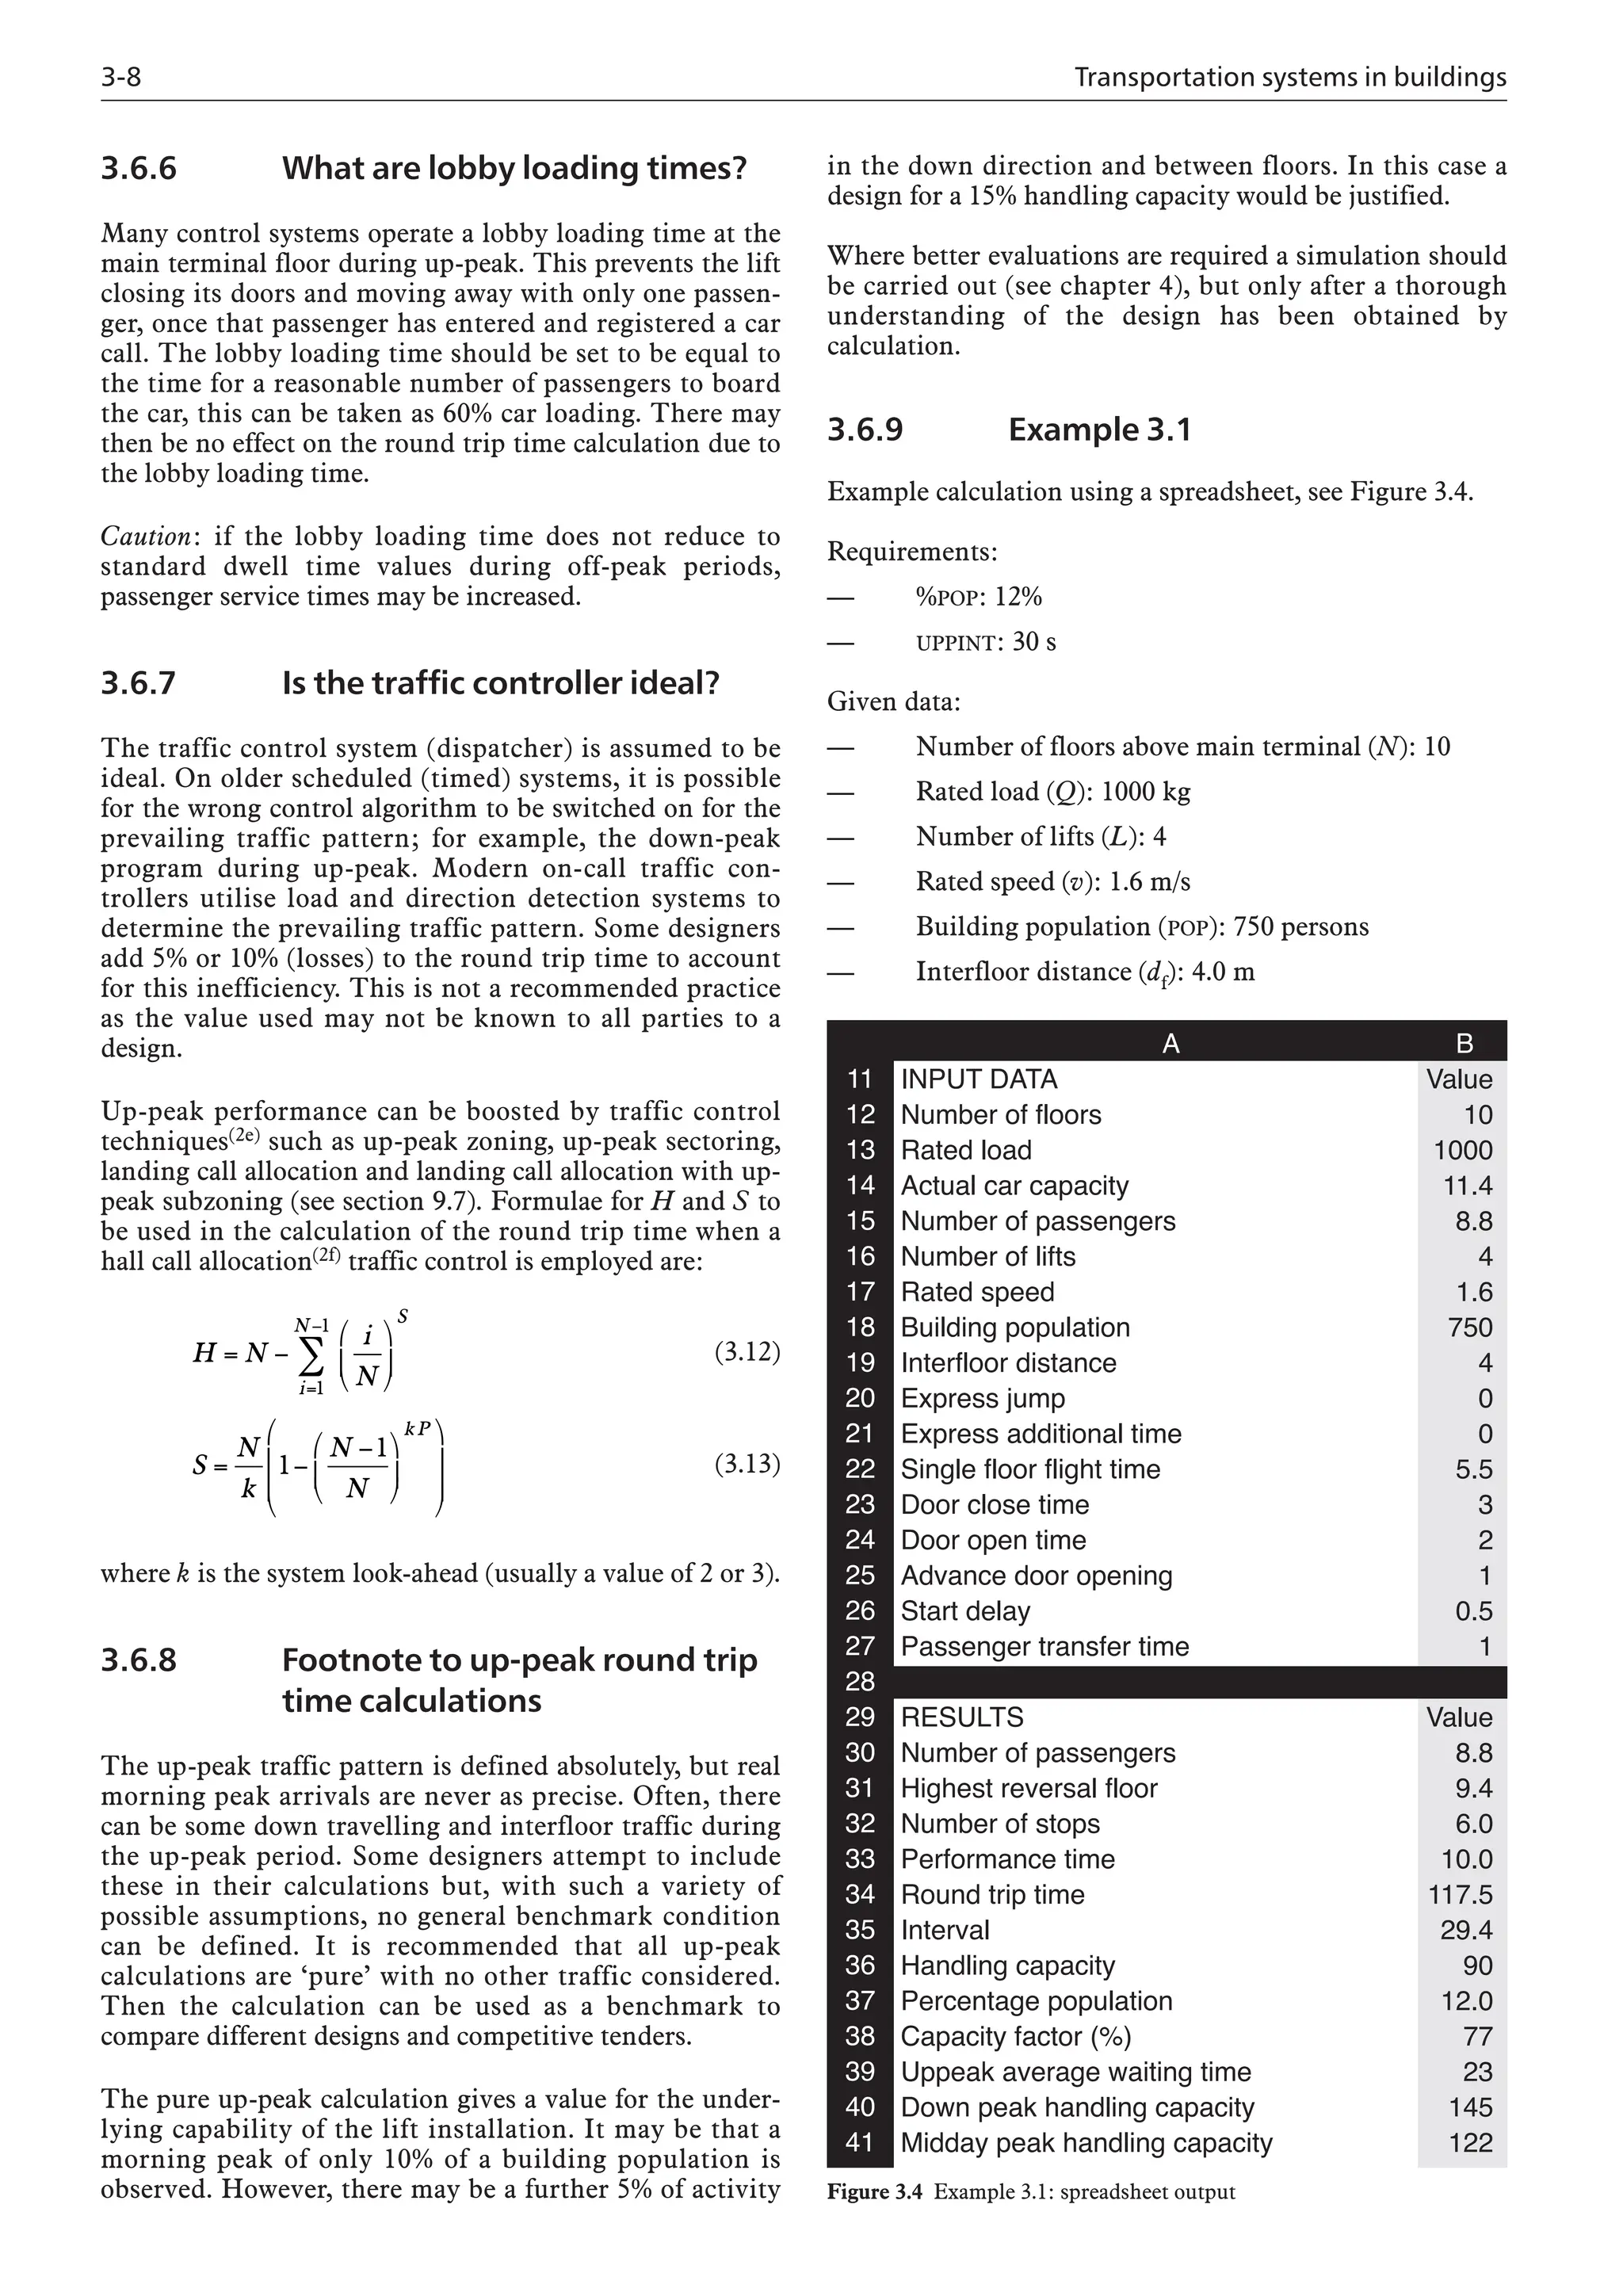
Procedure:
(1) Enter data into cells B12, B13.
(2) From Table 3.1 select actual car capacity (11.4) and
the value for P (9.1) and enter into input cells B14,
B15. Note that results cells B30–B32 (P
, H, S) are
updated.
(3) Enter data into cells B16–19, B22–B27. Note
results cells B33–B38 (T, RTT, UPPINT, UPPHC,
%POP, %CF) are updated.
(4) Set input cells B20–B21 as zero.
(5) Adjust value of P in input cell B15 from 9.1 to 8.8
to achieve a %POP served of 12% in results cell B37.
Derived data:
— %POP = 12.0% (cell B37)
— UPPINT = 117.5 / 4 = 29.4 s (cell B35)
— RTT = 117.5 s (cell B34)
— UPPHC = 90.0 persons/5-minutes (cell B36)
Note: percentage capacity factor by area (results cell B38)
is 77%, which is slightly below the target of 80%.
Ignore results cells B39–B41, see sections 3.7.1, 3.9.1 and
3.9.2.
3.7 Passenger times during
up-peak traffic demand
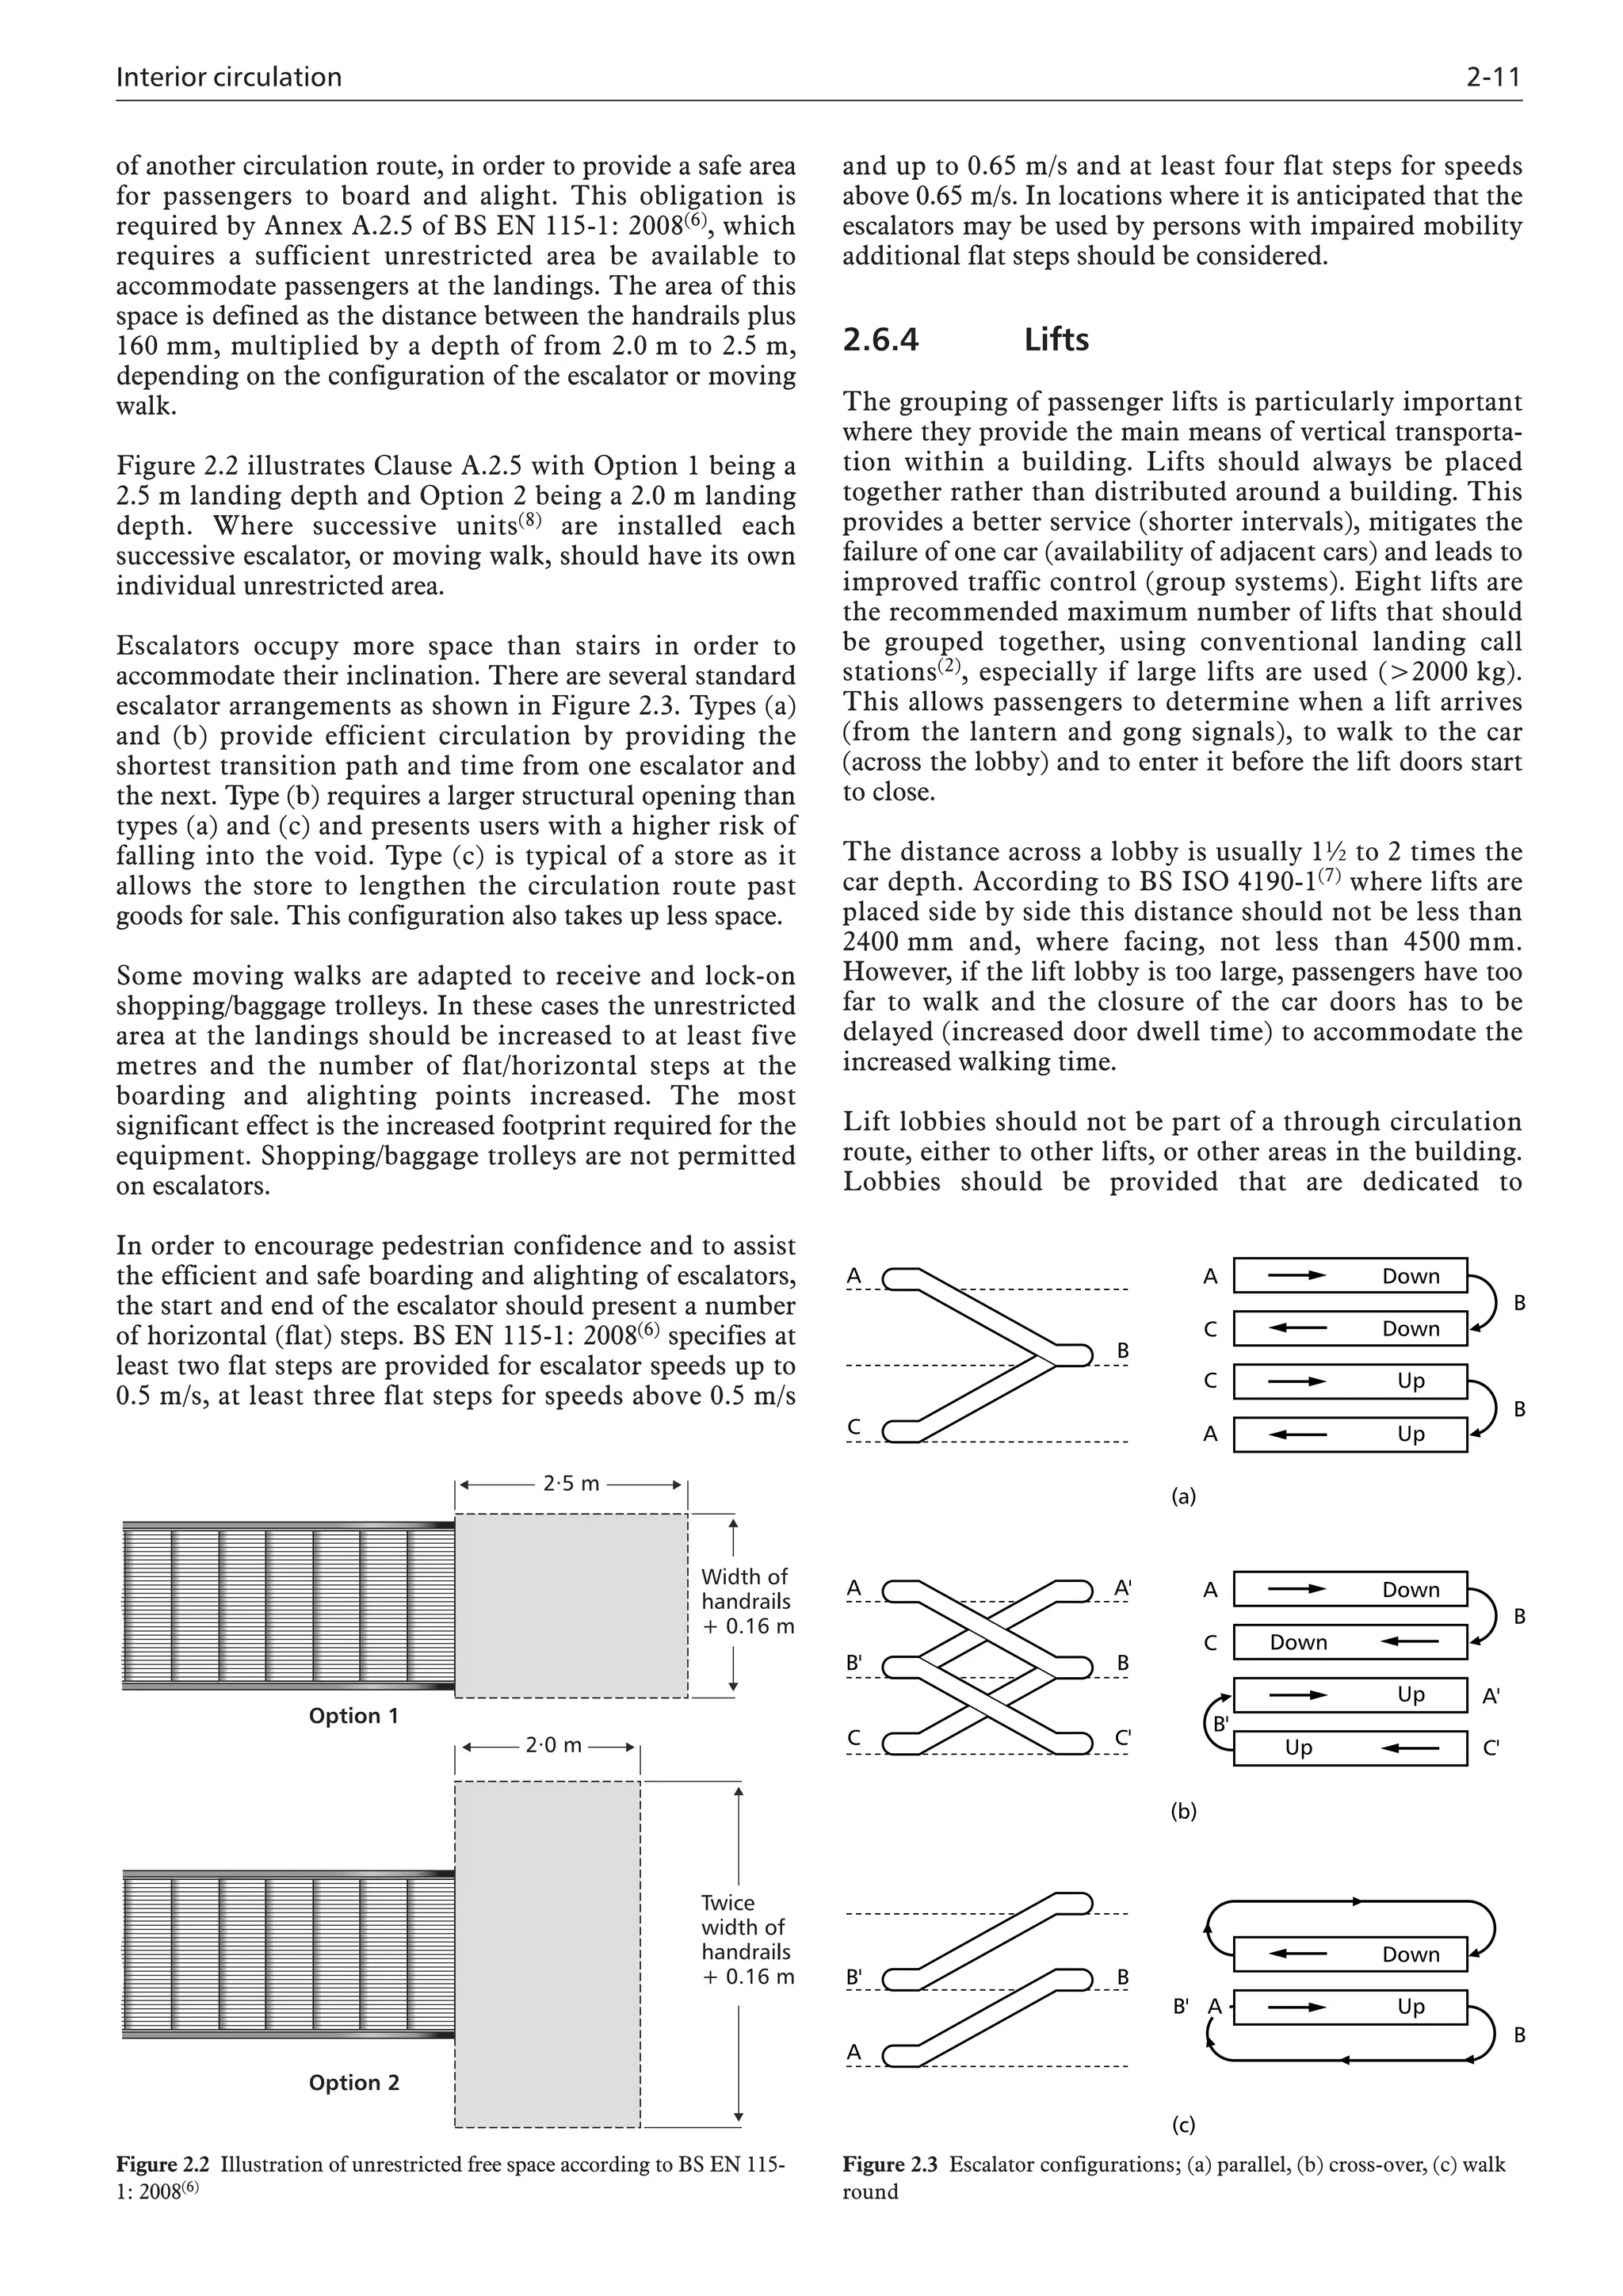
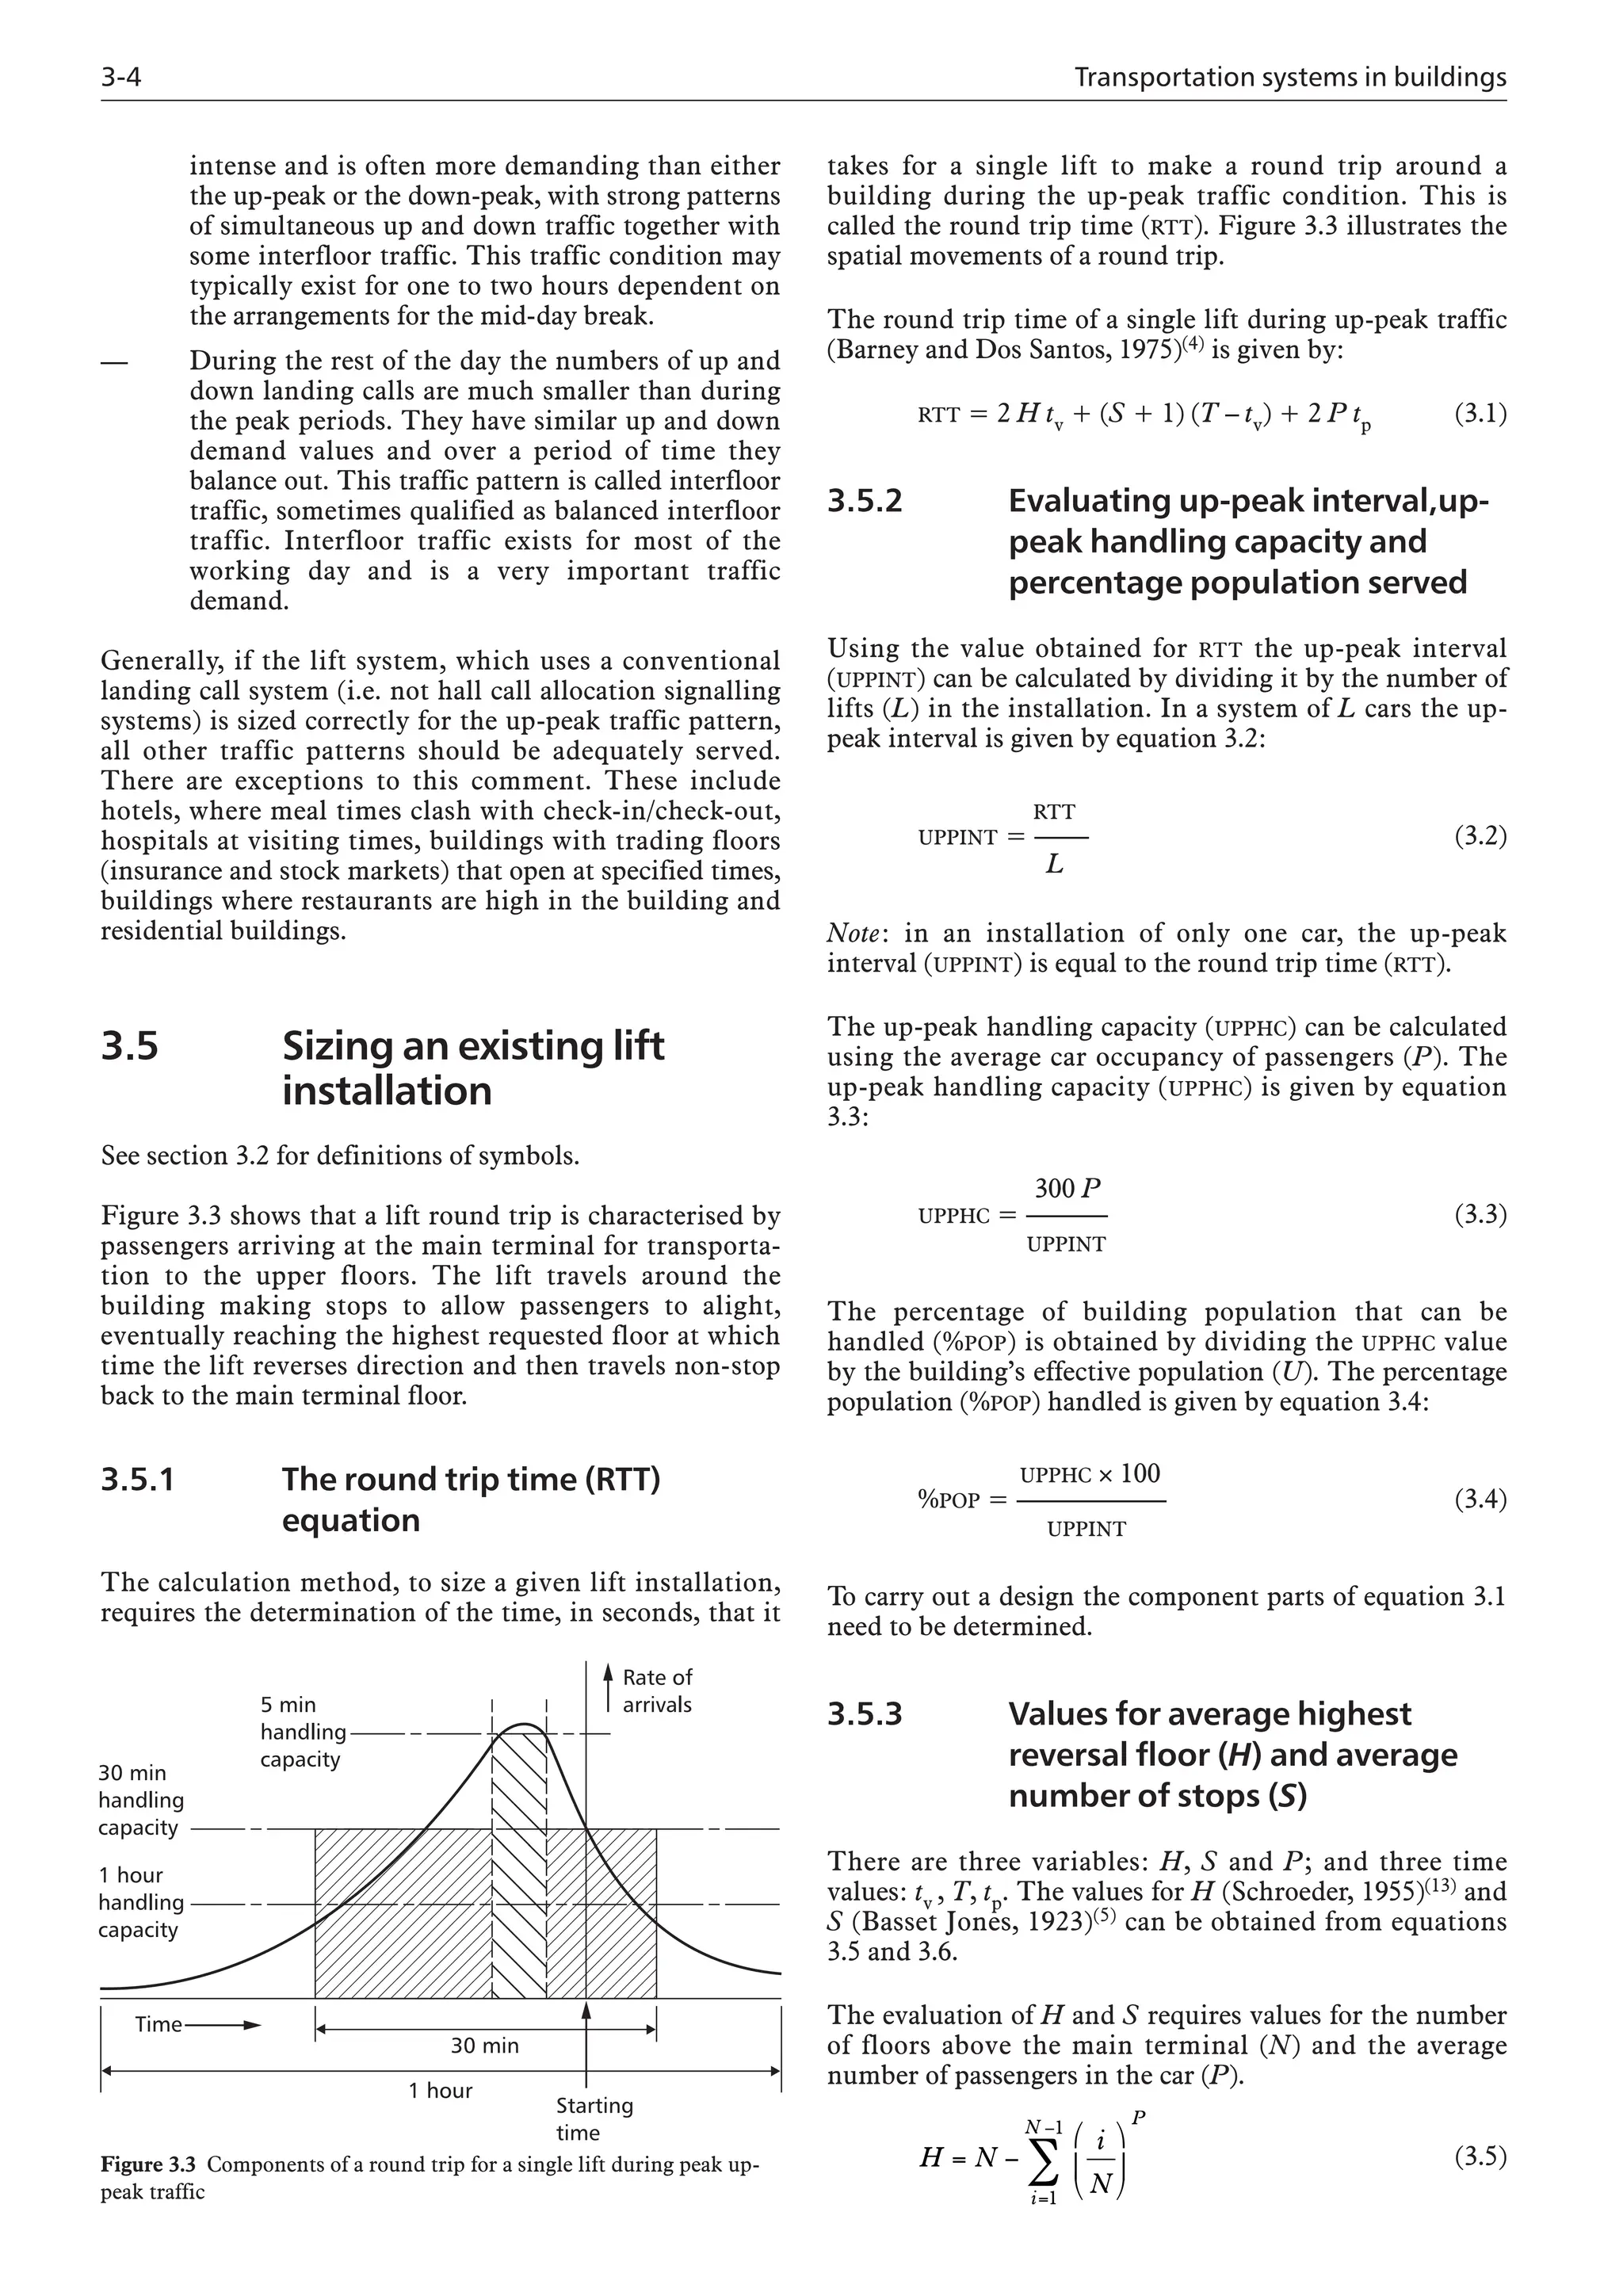
Figure 3.1 illustrates the relationships between the
passenger times.
Caution: all the formulae below are based on a math-
ematical model. To determine more accurate time values a
simulation study should be carried out, see chapter 4.
3.7.1 Passenger average waiting
time (AWT)
An equation can be derived for the passenger average
passenger waiting time(2g). For passenger loads (P) from
50% to 80% of rated capacity (CC), AWT is given by:
AWT = [0.4 + (1.8 P / CC – 0.77)2] INT (3.14)
For car loads less than 50%, AWT is 40% of the interval
(INT). Car loads above 80% are not considered.
On the spreadsheets for Examples 3.1 and 3.3 a value of
AWT is presented in cell B39.
Caution: some lift companies state AWT as half the interval.
Others state incorrectly that the time for the lift to
respond to a first landing call registered, sometimes called
system response time (SRT), is the passenger average
waiting time. These times are often inaccurate as some lift
companies cancel the call registration as much as eight
seconds before the lift actually starts to open its doors at a
landing.
3.7.2 Passenger average transit
time (ATT)(2h)
An estimate of how long it takes the average passenger to
reach their destination whilst in the car is obtained by
calculating ATT to the midpoint of the local travel for any
group of lifts. This implies travel for a distance of H/2
with the number of stops being S/2 and a transfer of P
passengers boarding the lift and P/2 passengers alighting
before the average passenger alights. The formula is:
ATT = 0.5 H tv + 0.5 S ts + 1.5 P tp (3.15)
3.7.3 Passenger average travel time to
destination (ATTD)(2i)
The average time it would take for an average passenger to
reach their destination floor is obtained by adding the
primary physiological consideration of average passenger
waiting time (AWT) to the secondary physiological
consideration of average passenger transit time (ATT) to
give a average passenger time to destination (ATTD). The
formula is:
ATT = 0.5 H tv + 0.5 S ts + 1.5 P tp+ AWT (3.16)
3.7.4 Passenger average journey
time (AJT)
This is longer than the passenger average travel time to
destination (ATTD) by the time required to open the lift
doors and the passenger to cross the threshold.
3.7.5 Target passenger times and lift
system response times
To achieve satisfactory passenger experiences the target
times shown in Table 3.7 are recommended.
The times indicated in Table 3.7 can be calculated, but
more reliable values may be obtained by simulation.
The grade of service provided by an installed lift system in
an office building can be expressed as either the
percentage of calls answered in specified time intervals, or
the time to answer a specified percentage of calls.
Table 3.7 Target passenger average times for office
buildings
Passenger time Target Poor
Average waiting time (AWT) <25 s >30 s
Average transit time (ATT) <60 s >70 s
Average journey time (AJT) <80 s > 90 s](https://image.slidesharecdn.com/16991071-250519033941-972a8df1/75/Guide-D-Transportation-Systems-In-Buildings-2010-Cibse-Guide-4th-Revised-Edition-Cibse-49-2048.jpg)


![This ebook is for the use of anyone anywhere in the United
States and most other parts of the world at no cost and with
almost no restrictions whatsoever. You may copy it, give it away
or re-use it under the terms of the Project Gutenberg License
included with this ebook or online at www.gutenberg.org. If you
are not located in the United States, you will have to check the
laws of the country where you are located before using this
eBook.
Title: Johnny Ludlow, Second Series
Author: Mrs. Henry Wood
Release date: October 3, 2012 [eBook #40928]
Most recently updated: October 23, 2024
Language: English
Credits: E-text prepared by David Edwards, eagkw, and the
Online Distributed Proofreading Team
(http://www.pgdp.net) from page images generously
made available by Internet Archive (http://archive.org)
*** START OF THE PROJECT GUTENBERG EBOOK JOHNNY
LUDLOW, SECOND SERIES ***](https://image.slidesharecdn.com/16991071-250519033941-972a8df1/75/Guide-D-Transportation-Systems-In-Buildings-2010-Cibse-Guide-4th-Revised-Edition-Cibse-60-2048.jpg)