kinds of graph
•Download as DOCX, PDF•
0 likes•144 views

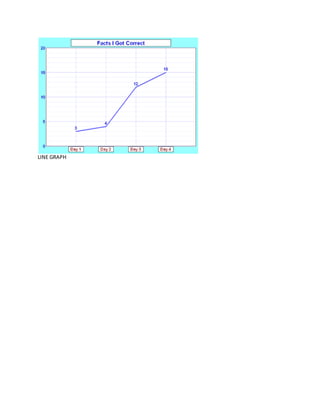
The document appears to be a line graph showing data points connected by lines over a period of time. It likely displays how a variable or variables changed over sequential time periods. The graph format allows viewers to see trends and patterns in the way the values increased or decreased from the beginning to the end of the time span shown.
Report
Share
Report
Share
Recommended
3 d pac man street art 2
A street artist in London created a 3D Pac-Man mural using stencils and spray paint. The mural shows Pac-Man navigating a maze on the side of a building, appearing to jump out from the wall. Passersby can interact with the mural by controlling Pac-Man's movement through the maze using a smartphone app.
OVERVIEWOF GOVERNMENTPERFORMANCEMANAGEMENTSYSTEMININDIA
The document provides an overview of India's government performance management system. Some key points:
1. India implemented a Results Framework Document (RFD) system to improve government accountability and performance. RFDs define departments' objectives, actions, and success indicators with targets.
2. RFDs are prepared annually, monitored during the year, and used to evaluate performance. They include prioritized objectives, outcome-oriented indicators, and independent scrutiny of targets.
3. The system was inspired by international examples and aims to address issues like unclear goals and priorities by clarifying expectations and increasing accountability for results.
4. Preliminary evidence suggests the RFD system has increased certain outcomes like reducing grievances and
Centro escolar insa
El documento describe la preparación y presentación de coplas por los alumnos de la Sección "E". Los compañeros trabajaron juntos en grupos para practicar y perfeccionar las coplas, y también colaboraron en los arreglos para la presentación para que saliera bien y poder mostrar su trabajo a los compañeros de otras secciones a través de su participación. Gracias al trabajo en equipo y esfuerzo de todos, la presentación fue un éxito.
Laboratorio de computo lll
El documento define el trabajo en equipo y discute sus ventajas y desventajas. Las ventajas del trabajo en equipo incluyen compartir ideas, mayor productividad y facilitar la dirección del trabajo. Las desventajas son posibles conflictos entre miembros del equipo, que puede tomar más tiempo y puede haber confusión entre los miembros. En general, el trabajo en equipo tiene ventajas pero también desventajas.
Mi palabra favorita
El documento presenta varias definiciones de palabras favoritas de estudiantes. Algunas de las palabras mencionadas son "beso", "amistad", "amor", "sueño", "recuerdo", "mañana", "música", "productor", "cacería", "tempestad", "dinero", "viaje", "vacaciones" y "educación". Cada estudiante explica brevemente por qué le gusta esa palabra en particular y qué significado tiene para ellos.
Leccion 09 DICIPULAR A LOS PODEROSOS
Este documento presenta varias lecciones sobre cómo discipular a personas poderosas. Se analizan encuentros de Jesús con líderes religiosos y autoridades romanas como el centurión. A pesar de la hostilidad, Jesús siempre trató de alcanzarlos con misericordia y apelando a las Escrituras. Los primeros discípulos también testificaron ante autoridades, a veces enfrentando persecución. Se enfatiza la necesidad de perseverar en el testimonio a pesar de los rechazos, confiando en que Dios usa nuestros es
Pared decorada
The document discusses the benefits of exercise for mental health. Regular physical activity can help reduce anxiety and depression and improve mood and cognitive functioning. Exercise causes chemical changes in the brain that may help protect against mental illness and improve symptoms.
Agendas ocultas 11 3
El documento resume varios eventos políticos y sociales complejos del año 2013, incluyendo las revelaciones de Edward Snowden sobre vigilancia masiva, las negociaciones nucleares con Irán, y la traición percibida de Estados Unidos a sus aliados en Medio Oriente. También menciona un "joven héroe" que se enfrentó a "los malvados" y critica el papel de Estados Unidos y sus aliados en el conflicto sirio.
Arcticulo Sitio Web.Ultima
Este documento describe un estudio que evaluó el efecto de usar un sitio web como estrategia de enseñanza de química en comparación con una estrategia tradicional. Se dividió a los estudiantes en dos grupos, uno recibió instrucción a través del sitio web y el otro con métodos tradicionales. Los resultados mostraron que el grupo del sitio web tuvo un rendimiento académico significativamente mayor en la posprueba. Por lo tanto, el uso de sitios web se recomienda como una estrategia efectiva para la ense
Planificación 25 de Mayo
El documento presenta un plan para una actividad con niños con motivo de la celebración del 25 de Mayo. La actividad consistirá en narrar un relato sobre acontecimientos y personajes de la Revolución de Mayo acompañado de imágenes, con el objetivo de que los niños puedan comprender la significación de la efeméride e identificar similitudes y diferencias entre la época colonial y su realidad actual.
Proyecto de vida karen
O documento repete a frase "autoestima valores" seguida de "Debilidades: sensible" várias vezes, indicando que trata-se de um texto sobre autoestima e sensibilidade como uma fraqueza.
Vvvvvv
Las cuatro creencias fundamentales de las Asambleas de Dios son: 1) la salvación por medio de Jesucristo, 2) la sanidad divina, 3) el bautismo en el Espíritu Santo, y 4) la segunda venida de Cristo. Estas cuatro doctrinas impregnan toda la enseñanza y predicación de la iglesia.
csx 2006_Merrill_Lynch_Presentation_FINAL-REF22975
This presentation discusses CSX Corporation's strategies and financial outlook. It summarizes that CSX's core strategies around revenue impact, operational discipline, and performance culture are gaining momentum. It also notes that the transportation environment remains strong and CSX's capacity projects position it for future growth and volume momentum. The presentation provides financial targets for CSX over the next 5 years including 10-12% annual growth in surface transportation operating income and earnings per share, and an improvement of the operating ratio to the mid-70% range.
Jesús in the House
El deseo de Dios para nustras vida es que seamos felices, que nuestra casa sea bendecida y tenga PAZ (Sal 128). Abre las puertas de tu casa, como hijo, para que el Señor Jesús entre en ella, quizá hay sufrimiento pero Él sanará tus heridas. Su amor inundará tu hogar y restaurará tu familia.
I artificial
El documento presenta una introducción a la inteligencia artificial aplicada a la gestión de empresas. Explica brevemente cuatro temas clave: sistemas expertos, computación evolutiva, redes neuronales artificiales e inteligencia artificial en general y sus subáreas.
Guilhermi slide
A Terceira Cruzada foi lançada em resposta à conquista de Jerusalém por Saladino em 1187. Liderada pelos reis da Inglaterra, França e pelo imperador do Sacro Império Romano-Germânico, a cruzada reuniu um grande exército, mas falhou em seu objetivo principal de recuperar Jerusalém. A cruzada promoveu maior tolerância entre cristãos e muçulmanos e marcou a participação dos cavaleiros teutônicos.
Doc4
El documento describe los objetivos de estudiar la materia, el movimiento y las caídas para comprender mejor los temas científicos. También busca adquirir habilidades prácticas mediante experimentos y resolver problemas cotidianos, a la vez que se forman actitudes éticas y responsables hacia uno mismo, el ambiente y la sociedad.
Diaposssss3
Un hombre cae en desgracia después de que su hermano lo engaña y se queda con la herencia familiar. Se convierte en un vagabundo y vive en la calle durante años, sufriendo las inclemencias del invierno y el calor del verano. Un día, una mujer lo ayuda y lo lleva a su casa, donde empiezan una relación, pero resulta que el marido de la mujer es el hermano del vagabundo. El hermano lo golpea brutalmente cuando los descubre. Más tarde, cuando la mujer los deja a ambos por otro hombre
Science technology
An atom consists of a small, positively charged nucleus surrounded by electrons. The nucleus contains over 99% of the atom's mass and is made up of protons and neutrons held together by the strong nuclear force. Radioactive decay occurs when an unstable nucleus emits radiation, changing into a different element. There are three main types of decay: alpha decay which emits a helium nucleus, beta decay which emits an electron or positron, and gamma decay which emits high energy photons during nuclear excitation.
kinds of flowers
Flowers are the reproductive organs of seed-bearing plants. They typically have four parts arranged in concentric rings: pistil, stamens, petals, and sepals. The pistil is located in the center and contains the stigma, style, and ovary where ovules develop into seeds. Surrounding the pistil are the stamens which contain anthers that produce pollen. Outside the stamens are brightly colored petals which attract pollinators. The outermost whorl is made up of sepals which protect the developing flower bud.
More Related Content
Viewers also liked
Centro escolar insa
El documento describe la preparación y presentación de coplas por los alumnos de la Sección "E". Los compañeros trabajaron juntos en grupos para practicar y perfeccionar las coplas, y también colaboraron en los arreglos para la presentación para que saliera bien y poder mostrar su trabajo a los compañeros de otras secciones a través de su participación. Gracias al trabajo en equipo y esfuerzo de todos, la presentación fue un éxito.
Laboratorio de computo lll
El documento define el trabajo en equipo y discute sus ventajas y desventajas. Las ventajas del trabajo en equipo incluyen compartir ideas, mayor productividad y facilitar la dirección del trabajo. Las desventajas son posibles conflictos entre miembros del equipo, que puede tomar más tiempo y puede haber confusión entre los miembros. En general, el trabajo en equipo tiene ventajas pero también desventajas.
Mi palabra favorita
El documento presenta varias definiciones de palabras favoritas de estudiantes. Algunas de las palabras mencionadas son "beso", "amistad", "amor", "sueño", "recuerdo", "mañana", "música", "productor", "cacería", "tempestad", "dinero", "viaje", "vacaciones" y "educación". Cada estudiante explica brevemente por qué le gusta esa palabra en particular y qué significado tiene para ellos.
Leccion 09 DICIPULAR A LOS PODEROSOS
Este documento presenta varias lecciones sobre cómo discipular a personas poderosas. Se analizan encuentros de Jesús con líderes religiosos y autoridades romanas como el centurión. A pesar de la hostilidad, Jesús siempre trató de alcanzarlos con misericordia y apelando a las Escrituras. Los primeros discípulos también testificaron ante autoridades, a veces enfrentando persecución. Se enfatiza la necesidad de perseverar en el testimonio a pesar de los rechazos, confiando en que Dios usa nuestros es
Pared decorada
The document discusses the benefits of exercise for mental health. Regular physical activity can help reduce anxiety and depression and improve mood and cognitive functioning. Exercise causes chemical changes in the brain that may help protect against mental illness and improve symptoms.
Agendas ocultas 11 3
El documento resume varios eventos políticos y sociales complejos del año 2013, incluyendo las revelaciones de Edward Snowden sobre vigilancia masiva, las negociaciones nucleares con Irán, y la traición percibida de Estados Unidos a sus aliados en Medio Oriente. También menciona un "joven héroe" que se enfrentó a "los malvados" y critica el papel de Estados Unidos y sus aliados en el conflicto sirio.
Arcticulo Sitio Web.Ultima
Este documento describe un estudio que evaluó el efecto de usar un sitio web como estrategia de enseñanza de química en comparación con una estrategia tradicional. Se dividió a los estudiantes en dos grupos, uno recibió instrucción a través del sitio web y el otro con métodos tradicionales. Los resultados mostraron que el grupo del sitio web tuvo un rendimiento académico significativamente mayor en la posprueba. Por lo tanto, el uso de sitios web se recomienda como una estrategia efectiva para la ense
Planificación 25 de Mayo
El documento presenta un plan para una actividad con niños con motivo de la celebración del 25 de Mayo. La actividad consistirá en narrar un relato sobre acontecimientos y personajes de la Revolución de Mayo acompañado de imágenes, con el objetivo de que los niños puedan comprender la significación de la efeméride e identificar similitudes y diferencias entre la época colonial y su realidad actual.
Proyecto de vida karen
O documento repete a frase "autoestima valores" seguida de "Debilidades: sensible" várias vezes, indicando que trata-se de um texto sobre autoestima e sensibilidade como uma fraqueza.
Vvvvvv
Las cuatro creencias fundamentales de las Asambleas de Dios son: 1) la salvación por medio de Jesucristo, 2) la sanidad divina, 3) el bautismo en el Espíritu Santo, y 4) la segunda venida de Cristo. Estas cuatro doctrinas impregnan toda la enseñanza y predicación de la iglesia.
csx 2006_Merrill_Lynch_Presentation_FINAL-REF22975
This presentation discusses CSX Corporation's strategies and financial outlook. It summarizes that CSX's core strategies around revenue impact, operational discipline, and performance culture are gaining momentum. It also notes that the transportation environment remains strong and CSX's capacity projects position it for future growth and volume momentum. The presentation provides financial targets for CSX over the next 5 years including 10-12% annual growth in surface transportation operating income and earnings per share, and an improvement of the operating ratio to the mid-70% range.
Jesús in the House
El deseo de Dios para nustras vida es que seamos felices, que nuestra casa sea bendecida y tenga PAZ (Sal 128). Abre las puertas de tu casa, como hijo, para que el Señor Jesús entre en ella, quizá hay sufrimiento pero Él sanará tus heridas. Su amor inundará tu hogar y restaurará tu familia.
I artificial
El documento presenta una introducción a la inteligencia artificial aplicada a la gestión de empresas. Explica brevemente cuatro temas clave: sistemas expertos, computación evolutiva, redes neuronales artificiales e inteligencia artificial en general y sus subáreas.
Guilhermi slide
A Terceira Cruzada foi lançada em resposta à conquista de Jerusalém por Saladino em 1187. Liderada pelos reis da Inglaterra, França e pelo imperador do Sacro Império Romano-Germânico, a cruzada reuniu um grande exército, mas falhou em seu objetivo principal de recuperar Jerusalém. A cruzada promoveu maior tolerância entre cristãos e muçulmanos e marcou a participação dos cavaleiros teutônicos.
Doc4
El documento describe los objetivos de estudiar la materia, el movimiento y las caídas para comprender mejor los temas científicos. También busca adquirir habilidades prácticas mediante experimentos y resolver problemas cotidianos, a la vez que se forman actitudes éticas y responsables hacia uno mismo, el ambiente y la sociedad.
Diaposssss3
Un hombre cae en desgracia después de que su hermano lo engaña y se queda con la herencia familiar. Se convierte en un vagabundo y vive en la calle durante años, sufriendo las inclemencias del invierno y el calor del verano. Un día, una mujer lo ayuda y lo lleva a su casa, donde empiezan una relación, pero resulta que el marido de la mujer es el hermano del vagabundo. El hermano lo golpea brutalmente cuando los descubre. Más tarde, cuando la mujer los deja a ambos por otro hombre
Viewers also liked (20)
csx 2006_Merrill_Lynch_Presentation_FINAL-REF22975
csx 2006_Merrill_Lynch_Presentation_FINAL-REF22975
More from sandra sophia acosta
Science technology
An atom consists of a small, positively charged nucleus surrounded by electrons. The nucleus contains over 99% of the atom's mass and is made up of protons and neutrons held together by the strong nuclear force. Radioactive decay occurs when an unstable nucleus emits radiation, changing into a different element. There are three main types of decay: alpha decay which emits a helium nucleus, beta decay which emits an electron or positron, and gamma decay which emits high energy photons during nuclear excitation.
kinds of flowers
Flowers are the reproductive organs of seed-bearing plants. They typically have four parts arranged in concentric rings: pistil, stamens, petals, and sepals. The pistil is located in the center and contains the stigma, style, and ovary where ovules develop into seeds. Surrounding the pistil are the stamens which contain anthers that produce pollen. Outside the stamens are brightly colored petals which attract pollinators. The outermost whorl is made up of sepals which protect the developing flower bud.
God heals us
God heals all diseases and forgives all sins according to the memory verse from Psalms 103:2-3. The story of Naaman in 2 Kings 5:1-16 illustrates this, where Naaman, a commander with leprosy, was healed after following Elisha's instruction to wash 7 times in the Jordan River. Although initially skeptical, Naaman obeyed and was cured of his leprosy. The document encourages putting faith in God, who still has the power to heal sickness today.
God forgives our sins
The document discusses God's forgiveness of sins according to the Bible. It tells the parable of the prodigal son from Luke 15:11-31, where a father forgives his younger son who had wasted his inheritance and returned home in poverty. The father sees his son while he is still far off and runs to embrace him. When the son asks for forgiveness, the father readily grants it. The father in the story represents God, who is a forgiving father always ready to forgive our sins if we are truly sorry for them.
God answers our prayers
God answers the prayers of those who have faith, like Jabez. Jabez was born into pain and ridiculed for his name, which meant "pain", but he prayed to God for blessings, protection from danger, and to avoid hurting others. God heard Jabez's prayer, helped him with his problems, and blessed his life so much that he no longer lived in pain and people stopped mocking him. The passage encourages readers that if they have complete trust in God, they too will see answers to their prayers as their lives are changed.
The shining face of moses
God spoke to Moses on Mount Sinai, introducing himself as a loving God and establishing an agreement with the Israelites containing important rules written as the Ten Commandments. When Moses returned to the people after 40 days on the mountain, his face shone brightly because he had been in God's presence, serving as a reminder that meeting with God transforms people.
A man of great faith
Abraham demonstrated great faith in God by his willingness to sacrifice his son Isaac as commanded. When God told Abraham to sacrifice Isaac on Mount Moriah, Abraham obeyed without question. As Abraham was about to kill Isaac, God stopped him and provided a ram to sacrifice instead. Abraham's complete faith and obedience to God's command was rewarded with wealth and many descendants, as God had promised. His example shows that those who truly believe in God will be rewarded.
Symbiotic relationships
The document discusses symbiotic relationships between different species. It defines symbiosis as a close, long-term relationship between two organisms where at least one benefits. There are several types of symbiotic relationships including mutualism, where both species benefit; commensalism, where one benefits and the other is not affected; and parasitism, where one harms the host. Examples given include relationships between bees and flowers, cattle egrets and livestock, and intestinal parasites and humans. Symbiosis is described as an important process for species survival and a fundamental part of ecosystems.
Ingredients
The document provides recipes for several Filipino desserts and dishes, including halayang ube (purple yam pudding), macapuno coconut custard, coconut macaroons, leche flan, puto cheese, brazo de Mercedes, and moist banana cake. The recipes include lists of ingredients and step-by-step instructions for preparing each food item.
The trail of blood
This document provides an introduction to J.M. Carroll's book "The Trail of Blood" which traces the history of Baptist churches from the time of Christ to the present day. It outlines some key distinguishing characteristics or "marks" of the original Christian church established by Christ, including that it had only two ordinances (baptism and communion), a congregational polity, and was independent of government. The introduction asserts that through history there have always been churches bearing these marks, despite periods of persecution, fulfilling Christ's promise that the gates of hell will not prevail against his church.
The bible
The document is about the book of Genesis from the Bible. It describes how in the beginning God created heaven and earth when the earth was formless and empty with darkness covering the deep. God said "Let there be light" and there was light. God saw that the light was good and separated the light from the darkness, calling the light "Day" and the darkness "Night". The evening and morning constituted the first day.
More from sandra sophia acosta (12)
Recently uploaded
Pollock and Snow "DEIA in the Scholarly Landscape, Session One: Setting Expec...
Pollock and Snow "DEIA in the Scholarly Landscape, Session One: Setting Expec...National Information Standards Organization (NISO)
This presentation was provided by Steph Pollock of The American Psychological Association’s Journals Program, and Damita Snow, of The American Society of Civil Engineers (ASCE), for the initial session of NISO's 2024 Training Series "DEIA in the Scholarly Landscape." Session One: 'Setting Expectations: a DEIA Primer,' was held June 6, 2024.The simplified electron and muon model, Oscillating Spacetime: The Foundation...
Discover the Simplified Electron and Muon Model: A New Wave-Based Approach to Understanding Particles delves into a groundbreaking theory that presents electrons and muons as rotating soliton waves within oscillating spacetime. Geared towards students, researchers, and science buffs, this book breaks down complex ideas into simple explanations. It covers topics such as electron waves, temporal dynamics, and the implications of this model on particle physics. With clear illustrations and easy-to-follow explanations, readers will gain a new outlook on the universe's fundamental nature.
How to Build a Module in Odoo 17 Using the Scaffold Method
Odoo provides an option for creating a module by using a single line command. By using this command the user can make a whole structure of a module. It is very easy for a beginner to make a module. There is no need to make each file manually. This slide will show how to create a module using the scaffold method.
What is Digital Literacy? A guest blog from Andy McLaughlin, University of Ab...
What is Digital Literacy? A guest blog from Andy McLaughlin, University of Aberdeen
PCOS corelations and management through Ayurveda.
This presentation includes basic of PCOS their pathology and treatment and also Ayurveda correlation of PCOS and Ayurvedic line of treatment mentioned in classics.
Advanced Java[Extra Concepts, Not Difficult].docx
This is part 2 of my Java Learning Journey. This contains Hashing, ArrayList, LinkedList, Date and Time Classes, Calendar Class and more.
How to Add Chatter in the odoo 17 ERP Module
In Odoo, the chatter is like a chat tool that helps you work together on records. You can leave notes and track things, making it easier to talk with your team and partners. Inside chatter, all communication history, activity, and changes will be displayed.
Your Skill Boost Masterclass: Strategies for Effective Upskilling
Your Skill Boost Masterclass: Strategies for Effective UpskillingExcellence Foundation for South Sudan
Strategies for Effective Upskilling is a presentation by Chinwendu Peace in a Your Skill Boost Masterclass organisation by the Excellence Foundation for South Sudan on 08th and 09th June 2024 from 1 PM to 3 PM on each day.Natural birth techniques - Mrs.Akanksha Trivedi Rama University
Natural birth techniques - Mrs.Akanksha Trivedi Rama UniversityAkanksha trivedi rama nursing college kanpur.
Natural birth techniques are various type such as/ water birth , alexender method, hypnosis, bradley method, lamaze method etcChapter 4 - Islamic Financial Institutions in Malaysia.pptx
Chapter 4 - Islamic Financial Institutions in Malaysia.pptxMohd Adib Abd Muin, Senior Lecturer at Universiti Utara Malaysia
This slide is special for master students (MIBS & MIFB) in UUM. Also useful for readers who are interested in the topic of contemporary Islamic banking.
Walmart Business+ and Spark Good for Nonprofits.pdf
"Learn about all the ways Walmart supports nonprofit organizations.
You will hear from Liz Willett, the Head of Nonprofits, and hear about what Walmart is doing to help nonprofits, including Walmart Business and Spark Good. Walmart Business+ is a new offer for nonprofits that offers discounts and also streamlines nonprofits order and expense tracking, saving time and money.
The webinar may also give some examples on how nonprofits can best leverage Walmart Business+.
The event will cover the following::
Walmart Business + (https://business.walmart.com/plus) is a new shopping experience for nonprofits, schools, and local business customers that connects an exclusive online shopping experience to stores. Benefits include free delivery and shipping, a 'Spend Analytics” feature, special discounts, deals and tax-exempt shopping.
Special TechSoup offer for a free 180 days membership, and up to $150 in discounts on eligible orders.
Spark Good (walmart.com/sparkgood) is a charitable platform that enables nonprofits to receive donations directly from customers and associates.
Answers about how you can do more with Walmart!"
South African Journal of Science: Writing with integrity workshop (2024)
South African Journal of Science: Writing with integrity workshop (2024)Academy of Science of South Africa
A workshop hosted by the South African Journal of Science aimed at postgraduate students and early career researchers with little or no experience in writing and publishing journal articles.বাংলাদেশ অর্থনৈতিক সমীক্ষা (Economic Review) ২০২৪ UJS App.pdf
বাংলাদেশের অর্থনৈতিক সমীক্ষা ২০২৪ [Bangladesh Economic Review 2024 Bangla.pdf] কম্পিউটার , ট্যাব ও স্মার্ট ফোন ভার্সন সহ সম্পূর্ণ বাংলা ই-বুক বা pdf বই " সুচিপত্র ...বুকমার্ক মেনু 🔖 ও হাইপার লিংক মেনু 📝👆 যুক্ত ..
আমাদের সবার জন্য খুব খুব গুরুত্বপূর্ণ একটি বই ..বিসিএস, ব্যাংক, ইউনিভার্সিটি ভর্তি ও যে কোন প্রতিযোগিতা মূলক পরীক্ষার জন্য এর খুব ইম্পরট্যান্ট একটি বিষয় ...তাছাড়া বাংলাদেশের সাম্প্রতিক যে কোন ডাটা বা তথ্য এই বইতে পাবেন ...
তাই একজন নাগরিক হিসাবে এই তথ্য গুলো আপনার জানা প্রয়োজন ...।
বিসিএস ও ব্যাংক এর লিখিত পরীক্ষা ...+এছাড়া মাধ্যমিক ও উচ্চমাধ্যমিকের স্টুডেন্টদের জন্য অনেক কাজে আসবে ...
Azure Interview Questions and Answers PDF By ScholarHat
Azure Interview Questions and Answers PDF By ScholarHat
How to Fix the Import Error in the Odoo 17
An import error occurs when a program fails to import a module or library, disrupting its execution. In languages like Python, this issue arises when the specified module cannot be found or accessed, hindering the program's functionality. Resolving import errors is crucial for maintaining smooth software operation and uninterrupted development processes.
RPMS TEMPLATE FOR SCHOOL YEAR 2023-2024 FOR TEACHER 1 TO TEACHER 3
RPMS Template 2023-2024 by: Irene S. Rueco
Digital Artifact 1 - 10VCD Environments Unit
Digital Artifact 1 - 10VCD Environments Unit - NGV Pavilion Concept Design
Recently uploaded (20)
Pollock and Snow "DEIA in the Scholarly Landscape, Session One: Setting Expec...
Pollock and Snow "DEIA in the Scholarly Landscape, Session One: Setting Expec...
The simplified electron and muon model, Oscillating Spacetime: The Foundation...
The simplified electron and muon model, Oscillating Spacetime: The Foundation...
How to Build a Module in Odoo 17 Using the Scaffold Method
How to Build a Module in Odoo 17 Using the Scaffold Method
What is Digital Literacy? A guest blog from Andy McLaughlin, University of Ab...
What is Digital Literacy? A guest blog from Andy McLaughlin, University of Ab...
Your Skill Boost Masterclass: Strategies for Effective Upskilling
Your Skill Boost Masterclass: Strategies for Effective Upskilling
Natural birth techniques - Mrs.Akanksha Trivedi Rama University
Natural birth techniques - Mrs.Akanksha Trivedi Rama University
Chapter 4 - Islamic Financial Institutions in Malaysia.pptx
Chapter 4 - Islamic Financial Institutions in Malaysia.pptx
Walmart Business+ and Spark Good for Nonprofits.pdf
Walmart Business+ and Spark Good for Nonprofits.pdf
South African Journal of Science: Writing with integrity workshop (2024)
South African Journal of Science: Writing with integrity workshop (2024)
বাংলাদেশ অর্থনৈতিক সমীক্ষা (Economic Review) ২০২৪ UJS App.pdf
বাংলাদেশ অর্থনৈতিক সমীক্ষা (Economic Review) ২০২৪ UJS App.pdf
Azure Interview Questions and Answers PDF By ScholarHat
Azure Interview Questions and Answers PDF By ScholarHat
RPMS TEMPLATE FOR SCHOOL YEAR 2023-2024 FOR TEACHER 1 TO TEACHER 3
RPMS TEMPLATE FOR SCHOOL YEAR 2023-2024 FOR TEACHER 1 TO TEACHER 3
kinds of graph
- 1. LINE GRAPH