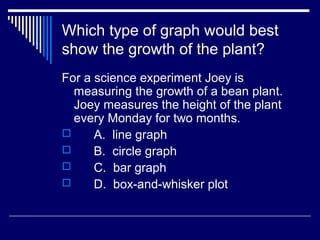
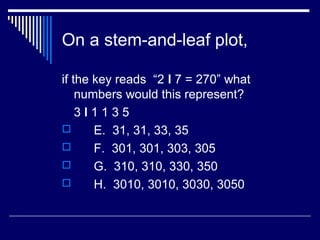
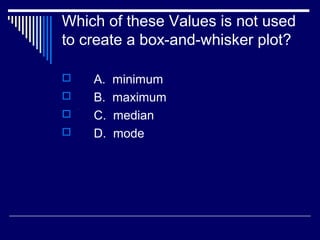
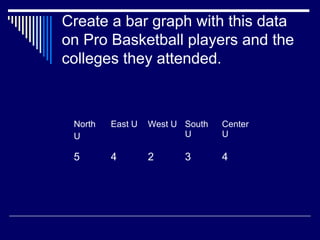
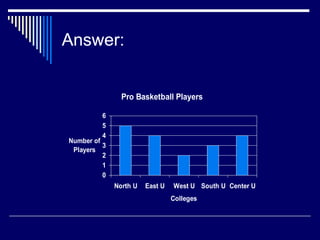
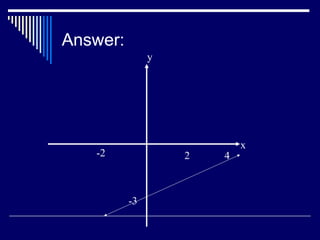
Graphs
Gr. 8
Presenting data to show
relationships using charts.
Which type of graph would best
show the growth of the plant?
For a science experiment Joey is
measuring the growth of a bean plant.
Joey measures the height of the plant
every Monday for two months.
 A. line graph
 B. circle graph
 C. bar graph
 D. box-and-whisker plot
Answer:
 A. line graph
On a stem-and-leaf plot,
if the key reads “2 l 7 = 270” what
numbers would this represent?
3 l 1 1 3 5
 E. 31, 31, 33, 35
 F. 301, 301, 303, 305
 G. 310, 310, 330, 350
 H. 3010, 3010, 3030, 3050
Answer:
G. 310, 310, 330, 350
Which of these Values is not used
to create a box-and-whisker plot?
 A. minimum
 B. maximum
 C. median
 D. mode
Answer:
D. mode
Create a bar graph with this data
on Pro Basketball players and the
colleges they attended.
North
U
East U West U South
U
Center
U
5 4 2 3 4
Answer:
Pro Basketball Players
0
1
2
3
4
5
6
North U East U West U South U Center U
Colleges
Number of
Players
Sketch a graph of this equation:
 y = ½ x – 3
Answer:
-3
2 4-2
y
x

Graphs