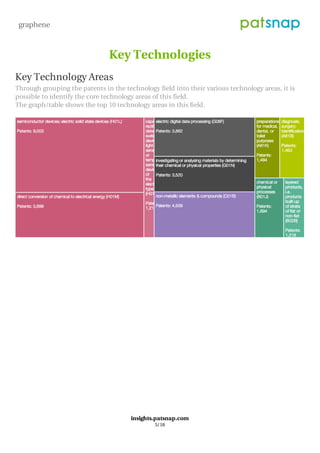
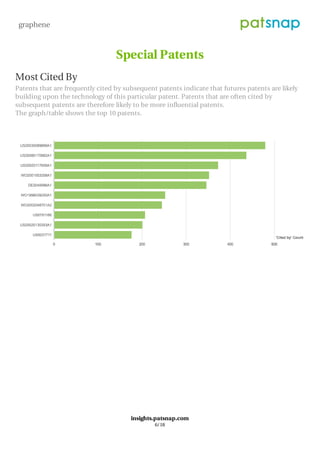
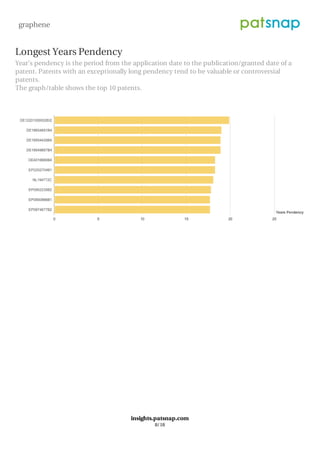
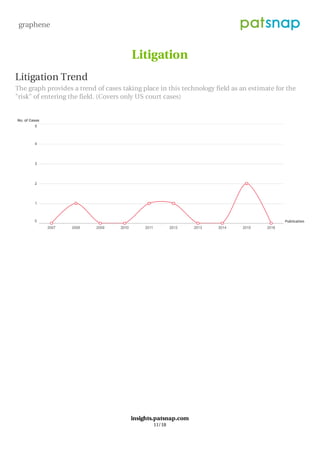
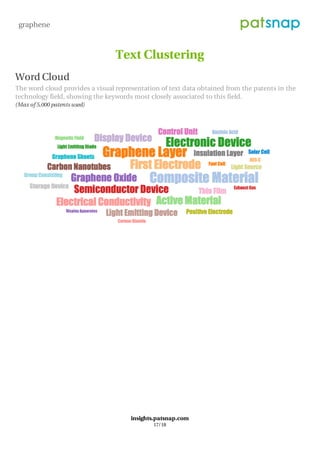
Technology Dashboard
graphene
Mar 22, 2016
insights.patsnap.com
Innovation Profile
Patent Portfolio Overview
The series of pie charts show the status and makeup of the patents in the technology field.
Innovation Rate
The graph/table shows the yearly patenting trend for the technology field which can be
approximated to the innovation rate for the technology field.
graphene
insights.patsnap.com
2/18
Geographic Breakdown
Geographic Breakdown Map
By showing the geographic breakdown of the patents in the technology field, it is possible to
determine the territorial markets which the technology field is prominent in or which markets
have opportunities for development.
Geographic Breakdown By Year
graphene
insights.patsnap.com
3/18
Geographic Breakdown By Year
This analysis shows the yearly trend of published patents by geography, providing an indicator
of the markets in which the technology field is growing. The graph/table shows the top 5
countries.
graphene
insights.patsnap.com
4/18
Key Technologies
Key Technology Areas
Through grouping the patents in the technology field into their various technology areas, it is
possible to identify the core technology areas of this field.
The graph/table shows the top 10 technology areas in this field.
graphene
insights.patsnap.com
5/18
Special Patents
Most Cited By
Patents that are frequently cited by subsequent patents indicate that futures patents are likely
building upon the technology of this particular patent. Patents that are often cited by
subsequent patents are therefore likely to be more influential patents.
The graph/table shows the top 10 patents.
Largest Family Size
graphene
insights.patsnap.com
6/18
Largest Family Size
Patents which have many other family members, including foreign counterparts, divisional and
continuations, are usually more valuable as the invention is protected in the global market.
The graph/table shows the top 10 patents.
Most Number Of Claims
The number of claims is one of the factors to evaluate a patent’s value. However, a patent with
more claims and large technical coverage has a higher possibility of encountering infringement
action.
The graph/table shows the top 10 patents.
graphene
insights.patsnap.com
7/18
Longest Years Pendency
Year’s pendency is the period from the application date to the publication/granted date of a
patent. Patents with an exceptionally long pendency tend to be valuable or controversial
patents.
The graph/table shows the top 10 patents.
graphene
insights.patsnap.com
8/18
Inventors
Top Inventors
Inventors are a key resource in the generation of patents and it is therefore important to
understand who are the top inventors and their corresponding contribution to the technology
field. The graph/table shows the top 10 inventors.
graphene
insights.patsnap.com
9/18
Renewal & Abandonment
Abandonment Rate
The graph/table shows the abandonment rate for the patents in the technology field, providing
an avenue to monitor the renewal and abandonment trends in this field. (Covers US patents
only)
graphene
insights.patsnap.com
10/18
Litigation
Litigation Trend
The graph provides a trend of cases taking place in this technology field as an estimate for the
"risk" of entering the field. (Covers only US court cases)
graphene
insights.patsnap.com
11/18
Most Valuable Patents
Valuable Patents
The graph/table shows the most valuable patents in the technology field. Valuation calculated
represents the value for a simple patent family.
graphene
insights.patsnap.com
12/18
Main Companies
Patenting Activity By Year
graphene
insights.patsnap.com
13/18
Patenting Activity By Year
The graph/table shows the top companies in this technology field based on their patent output,
providing an approximation of their innovation rate
Patenting Activity By Geography
graphene
insights.patsnap.com
14/18
Patenting Activity By Geography
The graph/table shows the top companies in this technology field and identifies the
geographical markets that they are focusing on.
Patenting Activity By Technology Area
graphene
insights.patsnap.com
15/18
Patenting Activity By Technology Area
The graph/table shows the top companies in this technology field and identifies the top
technology areas for these companies.
graphene
insights.patsnap.com
16/18
Text Clustering
Word Cloud
The word cloud provides a visual representation of text data obtained from the patents in the
technology field, showing the keywords most closely associated to this field.
(Max of 5,000 patents used)
Circle Chart
graphene
insights.patsnap.com
17/18
Circle Chart
Circle Chart uses a 2-level hierarchical representation of patent text data to provide an in-depth
analysis of the technology field, based on these keywords.
(Max of 5,000 patents used)
graphene
insights.patsnap.com
18/18

Graphene

  • 1.
    Technology Dashboard graphene Mar 22,2016 insights.patsnap.com
  • 2.
    Innovation Profile Patent PortfolioOverview The series of pie charts show the status and makeup of the patents in the technology field. Innovation Rate The graph/table shows the yearly patenting trend for the technology field which can be approximated to the innovation rate for the technology field. graphene insights.patsnap.com 2/18
  • 3.
    Geographic Breakdown Geographic BreakdownMap By showing the geographic breakdown of the patents in the technology field, it is possible to determine the territorial markets which the technology field is prominent in or which markets have opportunities for development. Geographic Breakdown By Year graphene insights.patsnap.com 3/18
  • 4.
    Geographic Breakdown ByYear This analysis shows the yearly trend of published patents by geography, providing an indicator of the markets in which the technology field is growing. The graph/table shows the top 5 countries. graphene insights.patsnap.com 4/18
  • 5.
    Key Technologies Key TechnologyAreas Through grouping the patents in the technology field into their various technology areas, it is possible to identify the core technology areas of this field. The graph/table shows the top 10 technology areas in this field. graphene insights.patsnap.com 5/18
  • 6.
    Special Patents Most CitedBy Patents that are frequently cited by subsequent patents indicate that futures patents are likely building upon the technology of this particular patent. Patents that are often cited by subsequent patents are therefore likely to be more influential patents. The graph/table shows the top 10 patents. Largest Family Size graphene insights.patsnap.com 6/18
  • 7.
    Largest Family Size Patentswhich have many other family members, including foreign counterparts, divisional and continuations, are usually more valuable as the invention is protected in the global market. The graph/table shows the top 10 patents. Most Number Of Claims The number of claims is one of the factors to evaluate a patent’s value. However, a patent with more claims and large technical coverage has a higher possibility of encountering infringement action. The graph/table shows the top 10 patents. graphene insights.patsnap.com 7/18
  • 8.
    Longest Years Pendency Year’spendency is the period from the application date to the publication/granted date of a patent. Patents with an exceptionally long pendency tend to be valuable or controversial patents. The graph/table shows the top 10 patents. graphene insights.patsnap.com 8/18
  • 9.
    Inventors Top Inventors Inventors area key resource in the generation of patents and it is therefore important to understand who are the top inventors and their corresponding contribution to the technology field. The graph/table shows the top 10 inventors. graphene insights.patsnap.com 9/18
  • 10.
    Renewal & Abandonment AbandonmentRate The graph/table shows the abandonment rate for the patents in the technology field, providing an avenue to monitor the renewal and abandonment trends in this field. (Covers US patents only) graphene insights.patsnap.com 10/18
  • 11.
    Litigation Litigation Trend The graphprovides a trend of cases taking place in this technology field as an estimate for the "risk" of entering the field. (Covers only US court cases) graphene insights.patsnap.com 11/18
  • 12.
    Most Valuable Patents ValuablePatents The graph/table shows the most valuable patents in the technology field. Valuation calculated represents the value for a simple patent family. graphene insights.patsnap.com 12/18
  • 13.
    Main Companies Patenting ActivityBy Year graphene insights.patsnap.com 13/18
  • 14.
    Patenting Activity ByYear The graph/table shows the top companies in this technology field based on their patent output, providing an approximation of their innovation rate Patenting Activity By Geography graphene insights.patsnap.com 14/18
  • 15.
    Patenting Activity ByGeography The graph/table shows the top companies in this technology field and identifies the geographical markets that they are focusing on. Patenting Activity By Technology Area graphene insights.patsnap.com 15/18
  • 16.
    Patenting Activity ByTechnology Area The graph/table shows the top companies in this technology field and identifies the top technology areas for these companies. graphene insights.patsnap.com 16/18
  • 17.
    Text Clustering Word Cloud Theword cloud provides a visual representation of text data obtained from the patents in the technology field, showing the keywords most closely associated to this field. (Max of 5,000 patents used) Circle Chart graphene insights.patsnap.com 17/18
  • 18.
    Circle Chart Circle Chartuses a 2-level hierarchical representation of patent text data to provide an in-depth analysis of the technology field, based on these keywords. (Max of 5,000 patents used) graphene insights.patsnap.com 18/18