Download to read offline
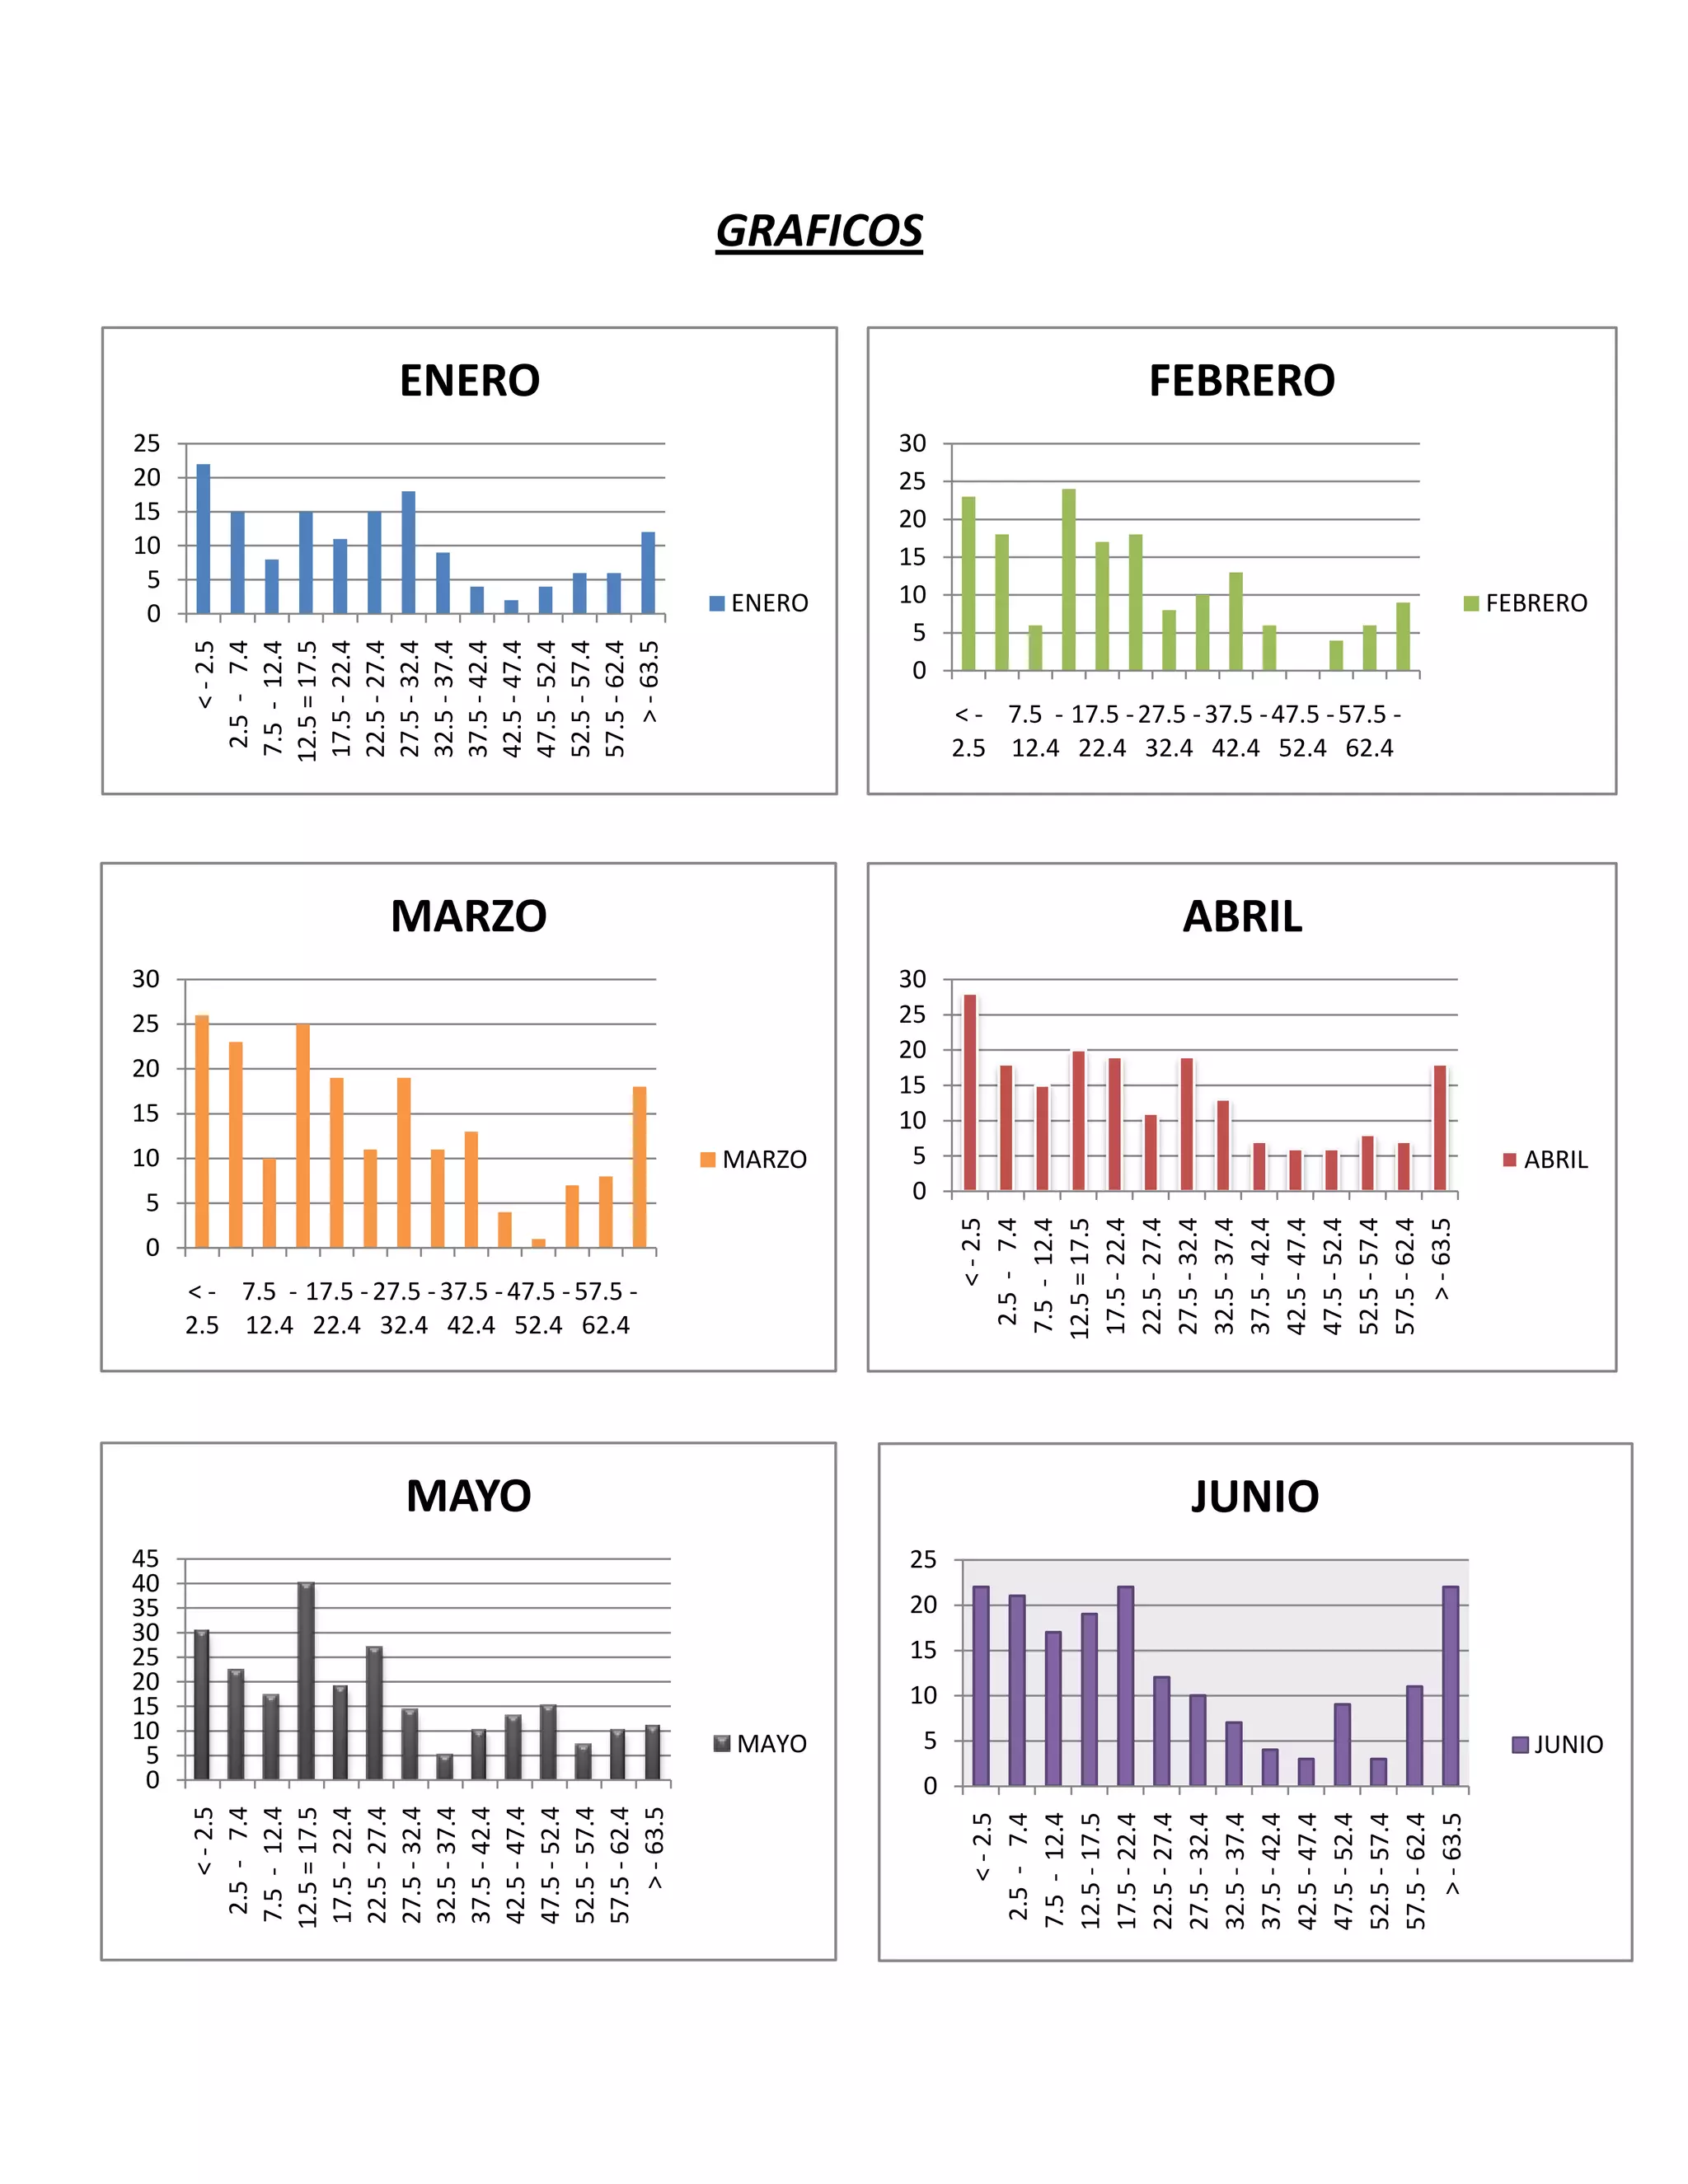
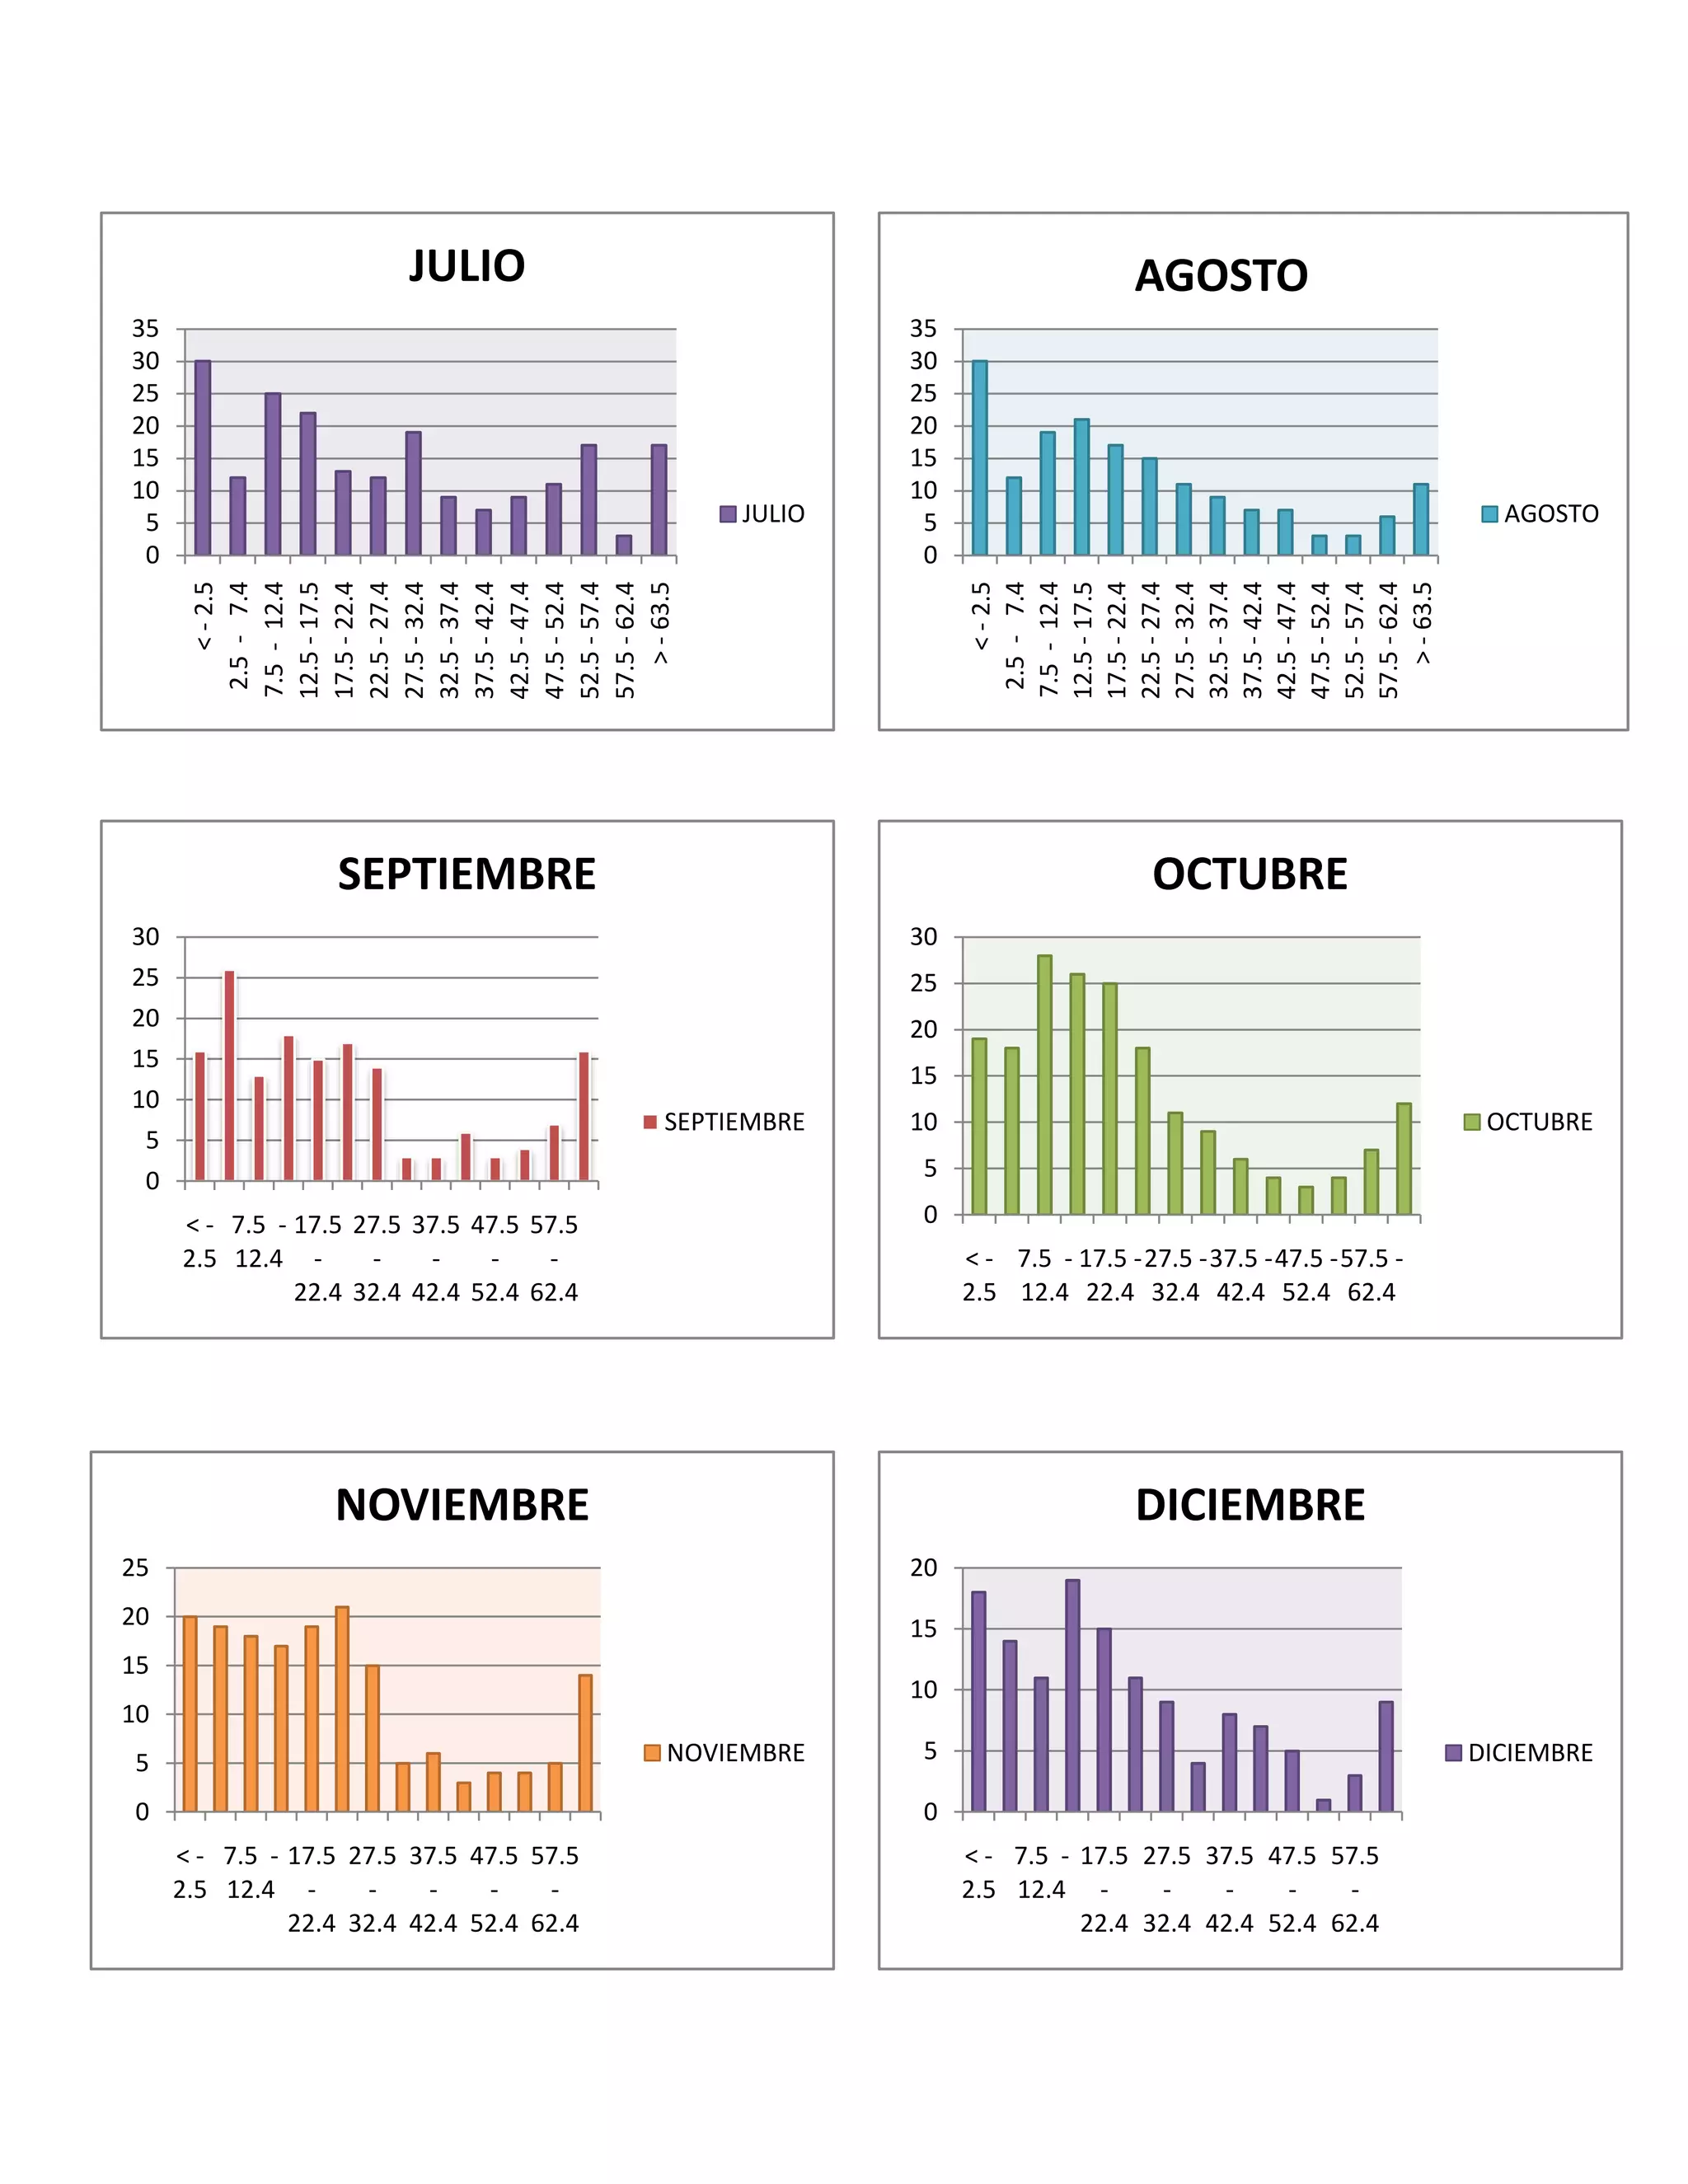

The document contains bar graphs showing temperature data for each month of the year. The graphs bin temperature ranges in Celsius from below -2.5 to above 63.5, with bars indicating the number of days that fell within each temperature range for each month.


