More Related Content
Similar to GM_Sales & Production_Production Schedule
Similar to GM_Sales & Production_Production Schedule (20)
More from Manya Mohan (20)
GM_Sales & Production_Production Schedule
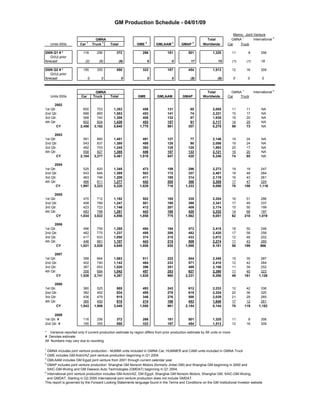
- 1. GM Production Schedule - 04/01/09
Memo: Joint Venture
5
1
International
GMNA Total GMNA
1 1 2 3 4
Units 000s Car Truck Total GME GMLAAM GMAP Worldwide Car Truck
2009 Q1 # * 116 256 372 266 181 501 1,320 11 8 356
O/(U) prior
forecast (2) (6) (8) 6 0 17 15 (1) (1) 16
2009 Q2 # * 195 355 550 322 187 454 1,513 12 16 309
O/(U) prior
forecast 0 0 0 0 0 (8) (8) 0 0 0
5
1
International
GMNA Total GMNA
Units 000s Car Truck Total GME GMLAAM GMAP Worldwide Car Truck
2002
1st Qtr. 600 753 1,353 456 131 65 2,005 11 11 NA
2nd Qtr. 688 865 1,553 453 141 74 2,221 15 17 NA
3rd Qtr. 568 740 1,308 408 132 87 1,935 19 20 NA
4th Qtr. 602 824 1,426 453 157 81 2,117 14 25 NA
CY 2,458 3,182 5,640 1,770 561 307 8,278 59 73 NA
2003
1st Qtr. 591 860 1,451 491 127 77 2,146 19 24 NA
2nd Qtr. 543 837 1,380 488 128 90 2,086 19 24 NA
3rd Qtr. 492 753 1,245 393 135 120 1,893 20 17 NA
4th Qtr. 558 827 1,385 446 157 133 2,121 16 20 NA
CY 2,184 3,277 5,461 1,818 547 420 8,246 74 85 NA
2004
1st Qtr. 525 820 1,345 473 159 296 2,273 19 19 247
2nd Qtr. 543 846 1,389 503 172 337 2,401 18 48 284
3rd Qtr. 463 746 1,209 411 185 314 2,119 16 43 261
4th Qtr. 466 811 1,277 442 200 386 2,305 17 47 324
CY 1,997 3,223 5,220 1,829 716 1,333 9,098 70 158 1,116
2005
1st Qtr. 470 712 1,182 502 185 335 2,204 16 51 286
2nd Qtr. 458 789 1,247 501 195 398 2,341 17 49 337
3rd Qtr. 423 723 1,146 412 207 409 2,174 15 50 199
4th Qtr. 483 798 1,281 443 188 420 2,332 14 68 197
CY 1,834 3,022 4,856 1,858 775 1,562 9,051 62 218 1,019
2006
1st Qtr. 496 759 1,255 494 194 472 2,415 18 50 246
2nd Qtr. 462 775 1,237 495 206 482 2,420 17 58 258
3rd Qtr. 417 633 1,050 374 215 433 2,072 12 48 202
4th Qtr. 446 661 1,107 443 215 509 2,274 11 43 260
CY 1,821 2,828 4,649 1,806 830 1,896 9,181 58 199 966
2007
1st Qtr. 399 664 1,063 511 222 544 2,340 15 35 287
2nd Qtr. 402 740 1,142 464 233 571 2,410 12 42 264
3rd Qtr. 367 653 1,020 396 251 489 2,156 11 39 252
4th Qtr. 358 684 1,042 457 253 627 2,380 11 45 323
CY 1,526 2,741 4,267 1,828 960 2,231 9,286 49 161 1,126
2008
1st Qtr. 360 525 885 493 243 612 2,233 12 42 336
2nd Qtr. 382 452 834 495 276 619 2,224 20 36 320
3rd Qtr. 436 479 915 348 276 500 2,039 21 29 265
4th Qtr. 365 450 815 214 166 453 1,648 17 12 261
CY 1,543 1,906 3,449 1,550 961 2,184 8,144 70 119 1,182
2009
1st Qtr. # 116 256 372 266 181 501 1,320 11 8 356
2nd Qtr. # 195 355 550 322 187 454 1,513 12 16 309
* Variance reported only if current production estimate by region differs from prior production estimate by 5K units or more
# Denotes estimate
All Numbers may vary due to rounding
1
GMNA includes joint venture production - NUMMI units included in GMNA Car; HUMMER and CAMI units included in GMNA Truck
2
GME includes GM-AvtoVAZ joint venture production beginning in Q1 2004
3
GMLAAM includes GM Egypt joint venture from 2001 through current calendar year
4
GMAP includes joint venture production: Shanghai GM Norsom Motors (formerly Jinbei GM) and Shanghai GM beginning in 2000 and
SAIC-GM-Wuling and GM Daewoo Auto Technologies (GMDAT) beginning in Q1 2004.
5
International joint venture production includes GM-AvtoVAZ, GM Egypt, Shanghai GM Norsom Motors, Shanghai GM, SAIC-GM-Wuling,
and GMDAT. Starting in Q3 2005 International joint venture production does not include GMDAT.
This report is governed by the Forward Looking Statements language found in the Terms and Conditions on the GM Institutional Investor website.