How R Developers Can Build and Share Data and AI Applications that Scale with...Databricks
Historically it has been challenging for R developers to build and share data products that use Apache Spark. In this talk, learn how you can publish Shiny apps that leverage the scale and speed of Databricks, Spark and Delta Lake, so your stakeholders can better leverage insights from your data in their decision making.
Revolution Analytics - Presentation at Hortonworks Booth - Strata 2014Hortonworks
Join Revolution Analytics and Hortonworks during this interactive presentation to discuss how customers are using Hadoop and R in the real world. We’ll show an end-to-end customer churn analytics demonstration (leveraging Revolution Analytics, Hortonworks and Tableau) serving three user personas: a website visitor, a data scientist and a business analyst.
Conquer Architectural Challenges with End-to-End JavaScript - enterJS 2014Alexandre Morgaut
Conquer Architectural Challenges with End-to-End JavaScript
● Decrease complexity and reduce your time-to-market;
● Show a powerful a NoSQL business object datastore;
● Build hybrid or native mobile-apps with an API-centric backend.
● Play with third-party libraries in reusable drag-and-drop widgets;
● Use our AngularJS connector to develop the front end
Portable Scalable Data Visualization Techniques for Apache Spark and Python N...Databricks
Python Notebooks are great for communicating data analysis & research but how do you port these data visualizations between the many available platforms (Jupyter, Databricks, Zeppelin, Colab,…). Also learn about how to scale up your visualizations using Spark
New languages, platforms, and technologies are emerging very rapidly like never before.
What software technologies are out there? What is hot right now? Which ones should you
learn?
This presentation helps you navigate the maze of new technologies out there. We will go
through a broad overview of hot technologies in mobile, web, cloud, big data, IoT, and
other areas. We will leave with a map of the tech landscape, giving you a starting point to dive deeper into whatever technology interests you!
Information can be displayed in many ways tables, graphs, or paragraphs, but the perspective given by a map is hard to beat. Maps provide a great visualization of data that is quick to understand and easy to read.Previously setting up web maps by hand involved sending the data with difficulties of choosing data format and transporting large amount of data. Or setting up a web service to publish the data and creating your own web map requires knowledge of different technologies such as WMS, TMS, OpenLayers and Leaflet.We happy to present an alternative:We are going to demo the QGIS Web App Builder, and explore some of the underlying technologies behind this great feature.As a developer you can also use this declarative approach directly which will be the focus of our talk.We will explore modern web technology and components. Looking at how React (a declarative framework for defining javascript web components) and OpenLayers (popular GIS focused visualization library) can be used together.These are leveraged by a “web sdk” responsible for generating a web application from a simple description.We are excited to show you how building an interactive web map can be quick, easy and fun!
Data Analysis and Visualization: R WorkflowOlga Scrivner
The lecture introduces to R project set-up, planning and deploying as well as to the concept of tidy data (Wickham and Grolemund, 2017).
Visual Insights Talks 2018 at
http://ivmooc.cns.iu.edu/
http://cns.iu.edu/
Angular (v2 and up) - Morning to understand - LinagoraLINAGORA
Slides of the talk about Angular, at the "Matinée Pour Comprendre" organized by Linagora the 22/03/17.
Discover what's new in Angular, why is it more than just a framework (platform) and how to manage your data with RxJs and Redux.
Web Development Agency in Noida – In today’s digital age, a strong online presence is essential for individuals and businesses alike. Web development is the key to unlocking the vast potential of the internet. Whether you’re a beginner looking to dive into the world of coding or an experienced developer aiming to stay updated with the latest trends, this comprehensive guide will provide valuable insights and guidance on web development.
Decoupled Drupal and Gatsby in the Real WorldMediacurrent
Drupal and Gatsby are a proven power couple for decoupled websites, offering incredible flexibility, security, and performance. At Mediacurrent, we’ve refined our decoupled approach through real-world experience, starting as early adopters on our own site.
In this webinar, we'll explore tips, pros and cons, and our lessons learned from a first-hand Drupal/Gatsby case study.
Smart TV Buyer Insights Survey 2024 by 91mobiles.pdf91mobiles
91mobiles recently conducted a Smart TV Buyer Insights Survey in which we asked over 3,000 respondents about the TV they own, aspects they look at on a new TV, and their TV buying preferences.
Observability Concepts EVERY Developer Should Know -- DeveloperWeek Europe.pdfPaige Cruz
Monitoring and observability aren’t traditionally found in software curriculums and many of us cobble this knowledge together from whatever vendor or ecosystem we were first introduced to and whatever is a part of your current company’s observability stack.
While the dev and ops silo continues to crumble….many organizations still relegate monitoring & observability as the purview of ops, infra and SRE teams. This is a mistake - achieving a highly observable system requires collaboration up and down the stack.
I, a former op, would like to extend an invitation to all application developers to join the observability party will share these foundational concepts to build on:
GraphSummit Singapore | The Art of the Possible with Graph - Q2 2024Neo4j
Neha Bajwa, Vice President of Product Marketing, Neo4j
Join us as we explore breakthrough innovations enabled by interconnected data and AI. Discover firsthand how organizations use relationships in data to uncover contextual insights and solve our most pressing challenges – from optimizing supply chains, detecting fraud, and improving customer experiences to accelerating drug discoveries.
Transcript: Selling digital books in 2024: Insights from industry leaders - T...BookNet Canada
The publishing industry has been selling digital audiobooks and ebooks for over a decade and has found its groove. What’s changed? What has stayed the same? Where do we go from here? Join a group of leading sales peers from across the industry for a conversation about the lessons learned since the popularization of digital books, best practices, digital book supply chain management, and more.
Link to video recording: https://bnctechforum.ca/sessions/selling-digital-books-in-2024-insights-from-industry-leaders/
Presented by BookNet Canada on May 28, 2024, with support from the Department of Canadian Heritage.
In his public lecture, Christian Timmerer provides insights into the fascinating history of video streaming, starting from its humble beginnings before YouTube to the groundbreaking technologies that now dominate platforms like Netflix and ORF ON. Timmerer also presents provocative contributions of his own that have significantly influenced the industry. He concludes by looking at future challenges and invites the audience to join in a discussion.
Encryption in Microsoft 365 - ExpertsLive Netherlands 2024Albert Hoitingh
In this session I delve into the encryption technology used in Microsoft 365 and Microsoft Purview. Including the concepts of Customer Key and Double Key Encryption.
Unlocking Productivity: Leveraging the Potential of Copilot in Microsoft 365, a presentation by Christoforos Vlachos, Senior Solutions Manager – Modern Workplace, Uni Systems
PHP Frameworks: I want to break free (IPC Berlin 2024)Ralf Eggert
In this presentation, we examine the challenges and limitations of relying too heavily on PHP frameworks in web development. We discuss the history of PHP and its frameworks to understand how this dependence has evolved. The focus will be on providing concrete tips and strategies to reduce reliance on these frameworks, based on real-world examples and practical considerations. The goal is to equip developers with the skills and knowledge to create more flexible and future-proof web applications. We'll explore the importance of maintaining autonomy in a rapidly changing tech landscape and how to make informed decisions in PHP development.
This talk is aimed at encouraging a more independent approach to using PHP frameworks, moving towards a more flexible and future-proof approach to PHP development.
Elevating Tactical DDD Patterns Through Object CalisthenicsDorra BARTAGUIZ
After immersing yourself in the blue book and its red counterpart, attending DDD-focused conferences, and applying tactical patterns, you're left with a crucial question: How do I ensure my design is effective? Tactical patterns within Domain-Driven Design (DDD) serve as guiding principles for creating clear and manageable domain models. However, achieving success with these patterns requires additional guidance. Interestingly, we've observed that a set of constraints initially designed for training purposes remarkably aligns with effective pattern implementation, offering a more ‘mechanical’ approach. Let's explore together how Object Calisthenics can elevate the design of your tactical DDD patterns, offering concrete help for those venturing into DDD for the first time!
GraphSummit Singapore | The Future of Agility: Supercharging Digital Transfor...Neo4j
Leonard Jayamohan, Partner & Generative AI Lead, Deloitte
This keynote will reveal how Deloitte leverages Neo4j’s graph power for groundbreaking digital twin solutions, achieving a staggering 100x performance boost. Discover the essential role knowledge graphs play in successful generative AI implementations. Plus, get an exclusive look at an innovative Neo4j + Generative AI solution Deloitte is developing in-house.
A tale of scale & speed: How the US Navy is enabling software delivery from l...sonjaschweigert1
Rapid and secure feature delivery is a goal across every application team and every branch of the DoD. The Navy’s DevSecOps platform, Party Barge, has achieved:
- Reduction in onboarding time from 5 weeks to 1 day
- Improved developer experience and productivity through actionable findings and reduction of false positives
- Maintenance of superior security standards and inherent policy enforcement with Authorization to Operate (ATO)
Development teams can ship efficiently and ensure applications are cyber ready for Navy Authorizing Officials (AOs). In this webinar, Sigma Defense and Anchore will give attendees a look behind the scenes and demo secure pipeline automation and security artifacts that speed up application ATO and time to production.
We will cover:
- How to remove silos in DevSecOps
- How to build efficient development pipeline roles and component templates
- How to deliver security artifacts that matter for ATO’s (SBOMs, vulnerability reports, and policy evidence)
- How to streamline operations with automated policy checks on container images
Epistemic Interaction - tuning interfaces to provide information for AI supportAlan Dix
Paper presented at SYNERGY workshop at AVI 2024, Genoa, Italy. 3rd June 2024
https://alandix.com/academic/papers/synergy2024-epistemic/
As machine learning integrates deeper into human-computer interactions, the concept of epistemic interaction emerges, aiming to refine these interactions to enhance system adaptability. This approach encourages minor, intentional adjustments in user behaviour to enrich the data available for system learning. This paper introduces epistemic interaction within the context of human-system communication, illustrating how deliberate interaction design can improve system understanding and adaptation. Through concrete examples, we demonstrate the potential of epistemic interaction to significantly advance human-computer interaction by leveraging intuitive human communication strategies to inform system design and functionality, offering a novel pathway for enriching user-system engagements.
DevOps and Testing slides at DASA ConnectKari Kakkonen
My and Rik Marselis slides at 30.5.2024 DASA Connect conference. We discuss about what is testing, then what is agile testing and finally what is Testing in DevOps. Finally we had lovely workshop with the participants trying to find out different ways to think about quality and testing in different parts of the DevOps infinity loop.
SAP Sapphire 2024 - ASUG301 building better apps with SAP Fiori.pdfPeter Spielvogel
Building better applications for business users with SAP Fiori.
• What is SAP Fiori and why it matters to you
• How a better user experience drives measurable business benefits
• How to get started with SAP Fiori today
• How SAP Fiori elements accelerates application development
• How SAP Build Code includes SAP Fiori tools and other generative artificial intelligence capabilities
• How SAP Fiori paves the way for using AI in SAP apps
SAP Sapphire 2024 - ASUG301 building better apps with SAP Fiori.pdf
RBrowserPlugin Project (Gabriel Becker)
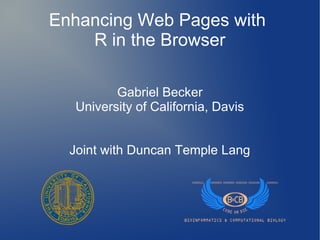
1. Enhancing Web Pages with
R in the Browser
Gabriel Becker
University of California, Davis
Joint with Duncan Temple Lang
2. Outline
● Introduction
● Examples
– Combining R with Web Technologies
– Interactive R plots
● Beyond Graphics
– Reproducing Research
– Interactive Analysis Documents
● Technical Details
– Bi-Directional Communication Model
– API
– Marshalling Objects
● Conclusion
3. Interactivity
● Interactive plots and data explorations are
becoming more and more popular
– New York Times
– Election Coverage
● How can we create these experiences with R?
– Server solutions: rook, shiny, Rserve, OpenCPU
– Pre-creation solutions: SVGAnnotation,
gridSVG, kmlDevice
– In R solutions: rggobi, iPlots, cranvas
4. The Big Picture
● We should want to be in the Web browser
– De facto standard platform for viewing
interactive/multimedia content
– Ubiquitous
– Actively being developed
● Standards (HTML5, DOM)
● Software (browsers, JavaScript Viz libraries, etc)
– Potential for mobile devices (Android)
● Running R in the browser is one way to do this
– RBrowserPlugin
Enhancing Web Pages with R in the Browser - Gabriel Becker - Bay Area useR Group - San Francisco - Nov. 13, 2012 4
5. High Level Use-cases
● Narrative documents containing interactive viz.
– NYTimes dataviz articles
● Interactive training tools for statistical concepts
● R as a powerful JavaScript Library
● Explorable interactive documents
– Reflect entire research process
– Allow viewers to change parameters and
recompute results
Enhancing Web Pages with R in the Browser - Gabriel Becker - Bay Area useR Group - San Francisco - Nov. 13, 2012 5
6. What We Can Do
● Some examples of what RbrowserPlugin
allows us to do
Enhancing Web Pages with R in the Browser - Gabriel Becker - Bay Area useR Group - San Francisco - Nov. 13, 2012 6
7. Combining R with Web
Technologies
● (Virtually) All Web technologies contain a
JavaScript interface
– This means we can now control them from R
● Google Maps
● Audio/Video content (HTML5, Youtube)
● Flash content
Enhancing Web Pages with R in the Browser - Gabriel Becker - Bay Area useR Group - San Francisco - Nov. 13, 2012 7
8. R and Google Maps
● R and Google Maps mashup example
Enhancing Web Pages with R in the Browser - Gabriel Becker - Bay Area useR Group - San Francisco - Nov. 13, 2012 8
9. R and Google Maps
● Google Maps
– Visualize geographical data
– select location for detailed summary
● R
– Import data
– Subset data based on selected area
– create graphic about selected area
● Each technology used for its strengths
Enhancing Web Pages with R in the Browser - Gabriel Becker - Bay Area useR Group - San Francisco - Nov. 13, 2012 9
10. Interactive Graphics Device
● Prototyped using RGraphicsDevice package (all R code)
– Rewritten in C for performance
● Raphael JavaScript library
● SVG Based
● Each element represented by an JS object reference (points,
lines, etc) retained at drawing time
– Add interaction/animation
– Edit
– Remove
● Live graphics device which is update-able without complete
redraw
Enhancing Web Pages with R in the Browser - Gabriel Becker - Bay Area useR Group - San Francisco - Nov. 13, 2012 10
11. R and Video Content
● R and video content mashup example
Enhancing Web Pages with R in the Browser - Gabriel Becker - Bay Area useR Group - San Francisco - Nov. 13, 2012 11
12. Handling User Interaction with R
Functions
● Linked R Plots
Enhancing Web Pages with R in the Browser - Gabriel Becker - Bay Area useR Group - San Francisco - Nov. 13, 2012 12
13. Linked Plots
● Two R plots drawn to different canvases
● Event handlers added to each point in both
plots using R code (sapply)
● When we mouse over a point
– R Function is called to determine which points
to color
– Color is added to chosen points through
Javascript Properties (using R code)
● Any two types of plot can be linked this way
Enhancing Web Pages with R in the Browser - Gabriel Becker - Bay Area useR Group - San Francisco - Nov. 13, 2012 13
14. Showing Closest Earthquakes
● Adding (and removing) points to an existing plot
Enhancing Web Pages with R in the Browser - Gabriel Becker - Bay Area useR Group - San Francisco - Nov. 13, 2012 14
15. Closest Earthquakes
● Coded (almost) entirely in R
● Background (map) is only drawn one
● Points are added and removed from existing
plot
– Added via points function
– Removed via function provided by
RBrowserPlugin
● Neighbor lookup performed in R via
SearchTrees
Enhancing Web Pages with R in the Browser - Gabriel Becker - Bay Area useR Group - San Francisco - Nov. 13, 2012 15
16. Setting Nuisance Parameters
● Using HTML5 controls to set value of nuisance
parameters
Enhancing Web Pages with R in the Browser - Gabriel Becker - Bay Area useR Group - San Francisco - Nov. 13, 2012 16
17. The Election!
● How could a statistician resist?
Enhancing Web Pages with R in the Browser - Gabriel Becker - Bay Area useR Group - San Francisco - Nov. 13, 2012 17
18. Combining Viz. And Narrative
● Trivial to add text to HTML document
– Static (article text)
– Dynamic (output from statistical methodology)
● Used to place interactive graphics within larger
context
– Eg within HTML versions of published journal
articles
Enhancing Web Pages with R in the Browser - Gabriel Becker - Bay Area useR Group - San Francisco - Nov. 13, 2012 18
19. Reproducing Research
● Sweave, knitr, etc style dynamic documents
– Reproduce results but NOT research process!
● Data analysis is not a linear, first time is a
charm affair
– Often try multiple methods
– Different data cleaning/implementation
strategies
– Answering different questions
Enhancing Web Pages with R in the Browser - Gabriel Becker - Bay Area useR Group - San Francisco - Nov. 13, 2012 19
20. Reproducing Research Con't
● Non-linear structure of research not easily
handled by Sweave, knitr, etc
● We need a more general, structured type of
dynamic document
– Exists in Duncan Temple Lang's XDynDocs
package
– Documents are sub-settable, queriable, etc
– I won't belabor the package here
Enhancing Web Pages with R in the Browser - Gabriel Becker - Bay Area useR Group - San Francisco - Nov. 13, 2012 20
21. What Does RbrowserPlugin Bring to
the Table?
● Interactively choose between alternate
approaches
– Evaluate code and insert results into Web Page
● Visualize the structure of the document/analysis
as a graph
– Use to navigate within the analysis
● Code is run on client machine at viewing time
Enhancing Web Pages with R in the Browser - Gabriel Becker - Bay Area useR Group - San Francisco - Nov. 13, 2012 21
22. Interactive Data Analysis
Documents
● Tech Demo 4: Interactive data analysis
document
Enhancing Web Pages with R in the Browser - Gabriel Becker - Bay Area useR Group - San Francisco - Nov. 13, 2012 22
23. Vizualising Analyses as Data
● Tech Demo 5: Dependency explorer for
complex analysis document
Enhancing Web Pages with R in the Browser - Gabriel Becker - Bay Area useR Group - San Francisco - Nov. 13, 2012 23
24. Why The Browser (Details)
● HTML5
– Emerging standard for adding interactivity, graphics, and
multimedia to Web pages
– Standardized, easy-to-use GUI controls
● Buttons, sliders, checkboxes, text input, etc
– MathML
● LaTeX quality typesetting for mathematical formulae
– <canvas> element
● Standardized raster-style JavaScript “graphics device”
● JavaScript
– Complete control over the loaded HTML page
– Event Handlers for Web page interactions
– Impressive emerging Viz. technologies (D3, Raphael, etc)
Enhancing Web Pages with R in the Browser - Gabriel Becker - Bay Area useR Group - San Francisco - Nov. 13, 2012 24
25. Bi-Directional Communication
● JavaScript ↔ R
● Each language able to
– see objects in other language
– Get local reference to objects in other language
– Directly manipulate objects in other language
● Change value/properties of object
– Directly call functions/methods in other
language
– Copy objects into local language when desired
Enhancing Web Pages with R in the Browser - Gabriel Becker - Bay Area useR Group - San Francisco - Nov. 13, 2012 25
26. Javascript – R Communication
● Javascript ↔ R
– Full control of HTML pages from R (via
Javascript)
● Write model summaries directly to HTML page
– R functions as HTML5/JavaScript event
handlers
● Refit model after slider value changes
– R code in script tags in HTML documents
● Define functions, perform initial fits
● R is now a powerful JS Library
Enhancing Web Pages with R in the Browser - Gabriel Becker - Bay Area useR Group - San Francisco - Nov. 13, 2012 26
27. Accessing R from JavaScript
● R engine is represented by the R object
– R functions accessed as methods of this object
– R variables accessed as properties of this
object
● Analogous to the existing Math Javascript
object
● R object is created automatically via provided
JavaScript file
Enhancing Web Pages with R in the Browser - Gabriel Becker - Bay Area useR Group - San Francisco - Nov. 13, 2012 27
28. JS → R Example Code
● Calling R functions
var rands = R.rnorm(10);
● Calling R functions with named arguments
var rands2 = R.rnorm(args({n:10, sd:5}));
● Calling R functions with empty arguments
var rands3 = R.rnorm(10, emptyArg, 7);
● Accessing R variables by name
var rpi = R.pi;
Enhancing Web Pages with R in the Browser - Gabriel Becker - Bay Area useR Group - San Francisco - Nov. 13, 2012 28
29. Accessing JS from R
● Global JavaScript object represented by JS
object in R global evironment
– Global JS variables are properties of this object
– Global JS functions are methods on this object
● All references to JavaScript objects in R expose
their methods and properties
– Methods/Functions are accessed via $
– Variables/Properties are accsesed via [[
Enhancing Web Pages with R in the Browser - Gabriel Becker - Bay Area useR Group - San Francisco - Nov. 13, 2012 29
30. R → JS Example Code
● Call a function defined in a script tag
ret = JS$myjsfun()
● Access a global variable
dom = JS[[“document”]]
● Call an object method
div = dom$getElementById(“mydiv”)
● Access an object property
div[[“innerHTML”]] = “R says hello!”
Enhancing Web Pages with R in the Browser - Gabriel Becker - Bay Area useR Group - San Francisco - Nov. 13, 2012 30
31. Marshalling Objects
● Objects marshalled in a sensible way by default
● Scalar values copied between languages
● Non-scalar values passed by reference
– References are interactable as if native objects
● Directly call R function references in JS
● Select elements from R lists/vector references by
name or position in JS
● Set properties of JS objects via familiar
[[ mechanic in R
● Directly call JS object methods via $
● Direct copying can be forced if desired
Enhancing Web Pages with R in the Browser - Gabriel Becker - Bay Area useR Group - San Francisco - Nov. 13, 2012 31
32. Future Work
● Add security layer
● Authoring tools
● browserpaint – package to offer Web page
based backend for R interactive graphics
– With Michael Lawrence
● Allow plugin to install R if not already present
on system
Enhancing Web Pages with R in the Browser - Gabriel Becker - Bay Area useR Group - San Francisco - Nov. 13, 2012 32
33. Acknowledgements
● Duncan Temple Lang
● Deborah Nolan
● Michael Lawrence
● Nicholas Lewin-Koh
● Current development version of
RBrowserPlugin is available at:
http://www.github.com/gmbecker/RFirefox
● Parts of this work were generously funded by Genentech Research and
Early Development
Enhancing Web Pages with R in the Browser - Gabriel Becker - Bay Area useR Group - San Francisco - Nov. 13, 2012 33
34. Interactive Documents
● Similar to the powerful Dynamic Documents
formula
– SWeave, odfWeave, XdynDocs, knitr
● HTML page contains exposition, code chunks,
and result blocks
– Page can be interacted with to change
parameters to the code.
– Code is then executed and new results inserted
into the page
Enhancing Web Pages with R in the Browser - Gabriel Becker - Bay Area useR Group - San Francisco - Nov. 13, 2012 34
35. Types of Documents
● Dynamic Documents
– Author is in control, viewer is passive
– Code is rerun but view is set; confirmatory
– Code has hardcoded values for tuning
parameters, etc
● Interactive Documents
– Author sets possible parameters
– Viewer is in control; exploratory
– Code is designed to accept input from viewer
Enhancing Web Pages with R in the Browser - Gabriel Becker - Bay Area useR Group - San Francisco - Nov. 13, 2012 35
36. Applications of Interactive Docs
● Pedagogy
– Interactive tutorials show the code actually
running, resetting parameters
– Electronic versions of textbooks.
● Electronic Publishing
– Reproducible Research
– Delivers code as well as results
– Confirm results are correct and up-to-date
– Prove robustness to tuning parameter choice
Enhancing Web Pages with R in the Browser - Gabriel Becker - Bay Area useR Group - San Francisco - Nov. 13, 2012 36
37. Browser vs Server
Browser Server
Arbitrary R code Arbitrary R
executed on local code executed
Security Machine on Server
Less powerful More powerful
machine, only 1 machine, many
Performance request requests
Private data can be Data must be
stored on local stored on
Privacy machine server
Each viewer must Single instance
download/obtain of data on
Data data server
Enhancing Web Pages with R in the Browser - Gabriel Becker - Bay Area useR Group - San Francisco - Nov. 13, 2012 37
38. Real-Time and Pre- Computation
● Real-Time Computation
– R is available
– Unlimited amount of alternate views
– Computations can take time
● Pre-Computation
– We can use the R functions save() and load()
– Pre-compute arbitrary objects (eg model fits)
and load them when needed
Enhancing Web Pages with R in the Browser - Gabriel Becker - Bay Area useR Group - San Francisco - Nov. 13, 2012 38