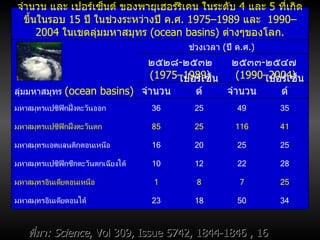
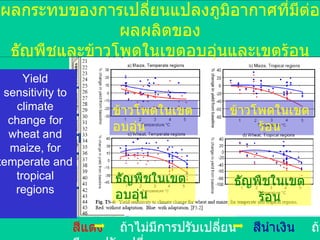
What in theWorld Is Going On? NATIONALGEOGRAPHIC.COM / /MAGAZINE SEPTEMBER 2004 Signs from Earth Carbon Dioxide Levels Rise: Mercury Climbs: Oceans Warm: Glaciers Melt: Sea Level Rises: Sea Ice Thins: Permafrost Thaws: Wildfires Increase: Lakes Shrink: Lakes Freeze Up Later: Ice Shelves Collapse: Droughts Linger: Precipitation Increases: Mountain Streams Run Dry: Winter Loses Its Bite: Spring Arrives Earlier: Autumn Comes Later: Plants Flower Sooner: Migration Times Vary: Habitats Change: Birds Nest Earlier: Diseases Spread: Coral Reefs Bleach: Snowpacks Decline: Exotic Species Invade: Amphibians Disappear: Coastlines Erode: Cloud Forests Dry: Temperatures Spike At High Latitudes: Signs from Earth พ . ศ . 2547
2.
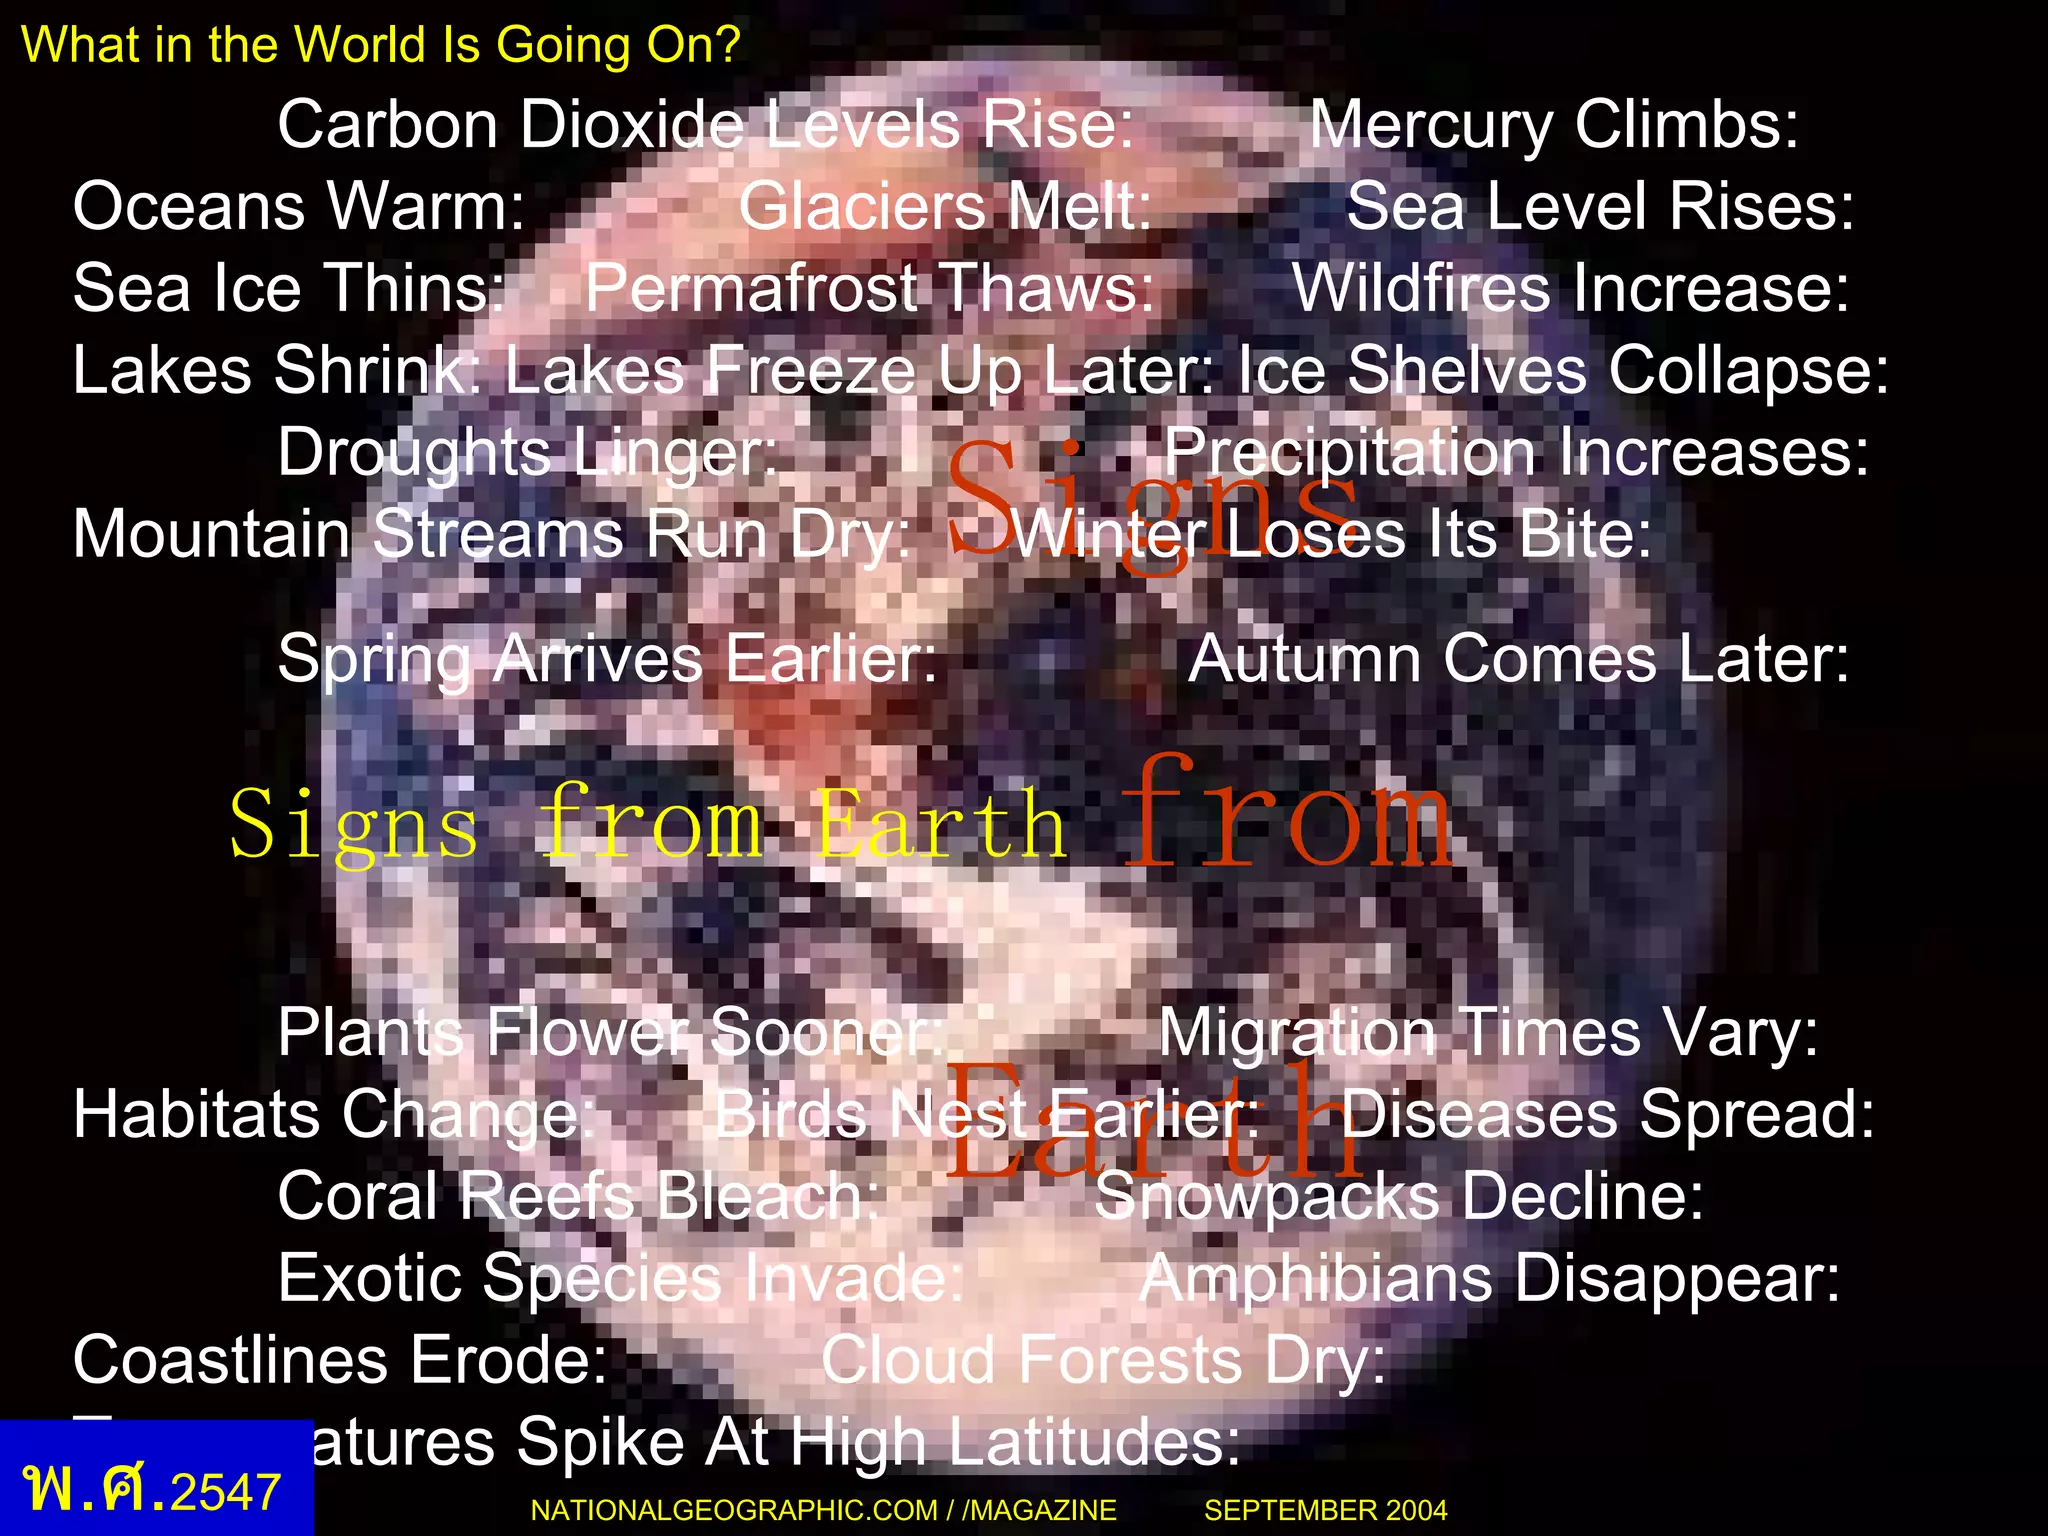
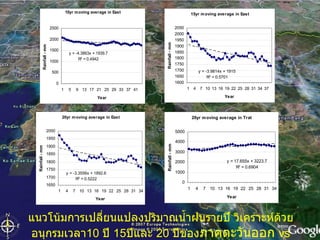
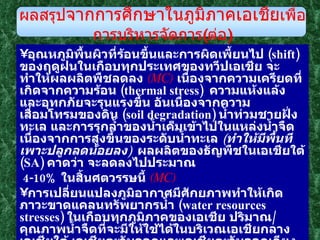
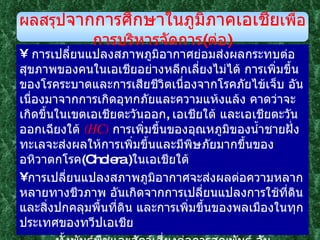
ก่อนมีคำว่า “ภูมิอากาศเปลี่ยนแปลง และ โลกร้อน ” พ . ศ . 2517: องค์ความรู้จากวิชา อุตุนิยมวิทยาป่าไม้ใกล้ผิวดิน (Forest Microclimatology) จาก PSU Human activities can also change the climate . The atmospheric amounts of many greenhouse gases are increasing, especially that of carbon dioxide, which has increased by 30% over the last 200 years, primarily as a result of changes in land use ( e . g . , deforestation ) and of burning coal, oil, and natural gas ( e . g . , in automobiles, industry, and electricity generation ). Forty years ago scientists provided the first direct evidence that combustion of fossil fuels was causing a buildup of carbon dioxide and thereby diluting radioactive carbon in the atmosphere by measuring the decreasing fraction of radioactive carbon-14 captured in tree rings, each year between 1800 and 1950 . พ . ศ . 2510 Secondly , scientists began making precise measurements of the total amount of carbon dioxide in the atmosphere at Mauna Loa, Hawaii, and at the South Pole in the late 1950s . They have since expanded their observations to many other locations . Their data show convincingly that the levels of carbon dioxide have increased each year worldwide . Furthermore, these increases are consistent with other estimates of the rise of carbon dioxide emissions due to human activity over this period . A third line of evidence has been added since 1980 . Ice buried below the surface of the Greenland and Antarctic ice caps contains bubbles of air trapped when the ice originally formed . Measurements from the youngest and most shallow segments of the ice cores, which contain air from only a few decades ago, produce carbon dioxide concentrations nearly identical to those that were measured directly in the atmosphere at the time the ice formed. But the older parts of the cores show that carbon dioxide amounts were about 25% lower than today for the ten thousand years previous to the onset of industrialization, and over that period changed little พ . ศ . 2493 พ . ศ . 2523 http :// www . gcrio . org / ipcc / qa / 05 . html
3.
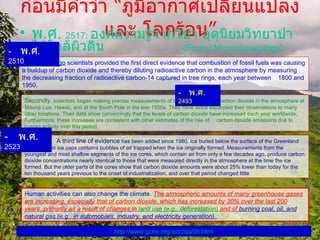
Figure 5.1 Measured amounts of carbon dioxide in the atmosphere . A third line of evidence has been added since 1980 . Ice buried below the surface of the Greenland and Antarctic ice caps contains bubbles of air trapped when the ice originally formed . These samples of fossil air, some of them over 200,000 years old, have been retrieved by drilling deep into the ice . Measurements from the youngest and most shallow segments of the ice cores, which contain air from only a few decades ago, produce carbon dioxide concentrations nearly identical to those that were measured directly in the atmosphere at the time the ice formed . But the older parts of the cores show that carbon dioxide amounts were about 25% lower than today for the ten thousand years previous to the onset of industrialization, and over that period changed little ( Figure 5.1 ). The final line of evidence comes from the geographic pattern of carbon dioxide measured in air . Observations show that there is slightly more carbon dioxide in the northern hemisphere than in the southern hemisphere . The difference arises because most of the human activities that produce carbon dioxide are in the north and it takes about a year for northern hemispheric emissions to circulate through the atmosphere and reach southern latitudes . http :// www . gcrio . org / ipcc / qa / 05 . html พ . ศ . 2523 http://www.aip.org/history/climate/rapid.htm
4.
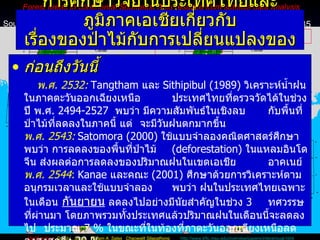
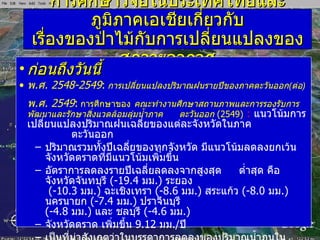
การศึกษาวิจัยในประเทศไทยและภูมิภาคเอเชีย เกี่ยวกับ เรื่องของป่า ไม้กับการเปลี่ยนแปลงของสภาวะอากาศ ก่อนถึงวันนี้ พ . ศ . 2532: Tangtham และ Sithipibul (1989) วิเคราะห์น้ำฝนในภาคตะวันออกเฉียงเหนือ ประเทศไทยที่ตรวจวัดได้ในช่วงปี พ . ศ . 2494-2527 พบว่า มีความสัมพันธ์ในเชิงลบ กับพื้นที่ป่าไม้ที่ลดลงในภาคนี้ แต่ จะมีวันฝนตกมากขึ้น พ . ศ . 2543: Satomora (2000) ใช้แบบจำลองคณิตศาสตร์ศึกษาพบว่า การลดลงของพื้นที่ป่าไม้ (deforestation) ในแหลมอินโดจีน ส่งผลต่อการลดลงของปริมาณฝนในเขตเอเชีย อาคเนย์ พ . ศ . 2544 : Kanae และคณะ (2001) ศึกษาด้วยการวิเคราะห์ตามอนุกรมเวลาและใช้แบบจำลอง พบว่า ฝนในประเทศไทยเฉพาะในเดือน กันยายน ลดลงไปอย่างมีนัยสำคัญในช่วง 3 ทศวรรษที่ผ่านมา โดยภาพรวมทั้งประเทศแล้วปริมาณฝนในเดือนนี้จะลดลงไป ประมาณ 7 % ในขณะที่ในท้องที่ภาตะวันออกเฉียงเหนือลดลงสูงสุดถึง 29 % Southeast Asia Forest Cover - 1973 Southeast Asia Forest Cover - 1985 Modified from: David L. Skole William A. Salas Chaowalit Silapathong http :// www . trfic . msu . edu / overview / papers / interannual . html 5.25 Mha Forest areas in continental Southeast Asia resulted from satellite data analysis Mha=Million hectares 22.56 Mha 48.71 Mha 18.28 Mha 19.92 Mha 3.98 Mha 16.74 Mha 44.82 Mha 16.15 Mha 16.52 Mha 114.70 Mha 98.21 Mha ก่อนถึงวันนี้
5.
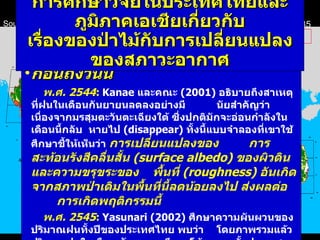
ก่อนถึงวันนี้ พ . ศ . 2544 : Kanae และคณะ (2001) อธิบายถึงสาเหตุที่ฝนในเดือนกันยายนลดลงอย่างมี นัยสำคัญว่า เนื่องจากมรสุมตะวันตะเฉียงใต้ ซึ่งปกติมักจะอ่อนกำลังในเดือนนี้กลับ หายไป (disappear) ทั้งนี้แบบจำลองที่เขาใช้ศึกษาชี้ให้เห็นว่า การเปลี่ยนแปลงของ การสะท้อนรังสีคลื่นสั้น (surface albedo) ของผิวดินและความขรุขระของ พื้นที่ (roughness) อันเกิดจากสภาพป่าเดิมในพื้นที่นี้ลดน้อยลงไป ส่งผลต่อ การเกิดพฤติกรรมนี้ พ . ศ . 2545 : Yasunari (2002) ศึกษาความผันผวนของปริมาณฝนทั้งปีของประเทศไทย พบว่า โดยภาพรวมแล้ว ปริมาณฝนในเดือน กันยายน มีแนวโน้มลดลงทั้งประเทศอย่างชัดเจน นับตั้งแต่ปี ค . ศ .1950 เป็นต้นมา แต่ไม่ส่งผลต่อปริมาณฝนในเดือนกรกฎาคม - สิงหาคม อันเป็นช่วงที่ลมมรสุมตะวันตกเฉียงใต้ยังพัดแรงอยู่ การศึกษาวิจัยในประเทศไทยและภูมิภาคเอเชีย เกี่ยวกับ เรื่องของ ป่า ไม้กับการเปลี่ยนแปลงของสภาวะอากาศ Southeast Asia Forest Cover - 1973 Southeast Asia Forest Cover - 1985 Modified from: David L. Skole William A. Salas Chaowalit Silapathong http :// www . trfic . msu . edu / overview / papers / interannual . html 5.25 Mha Forest areas in continental Southeast Asia resulted from satellite data analysis Mha=Million hectares 22.56 Mha 48.71 Mha 18.28 Mha 19.92 Mha 3.98 Mha 16.74 Mha 44.82 Mha 16.15 Mha 16.52 Mha 114.70 Mha 98.21 Mha ก่อนถึงวันนี้
6.
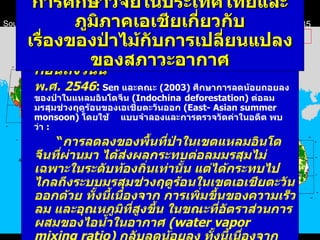
ก่อนถึงวันนี้ พ .ศ . 2546 : Sen และคณะ (2003) ศึกษาการลดน้อยถอยลงของป่าในแหลมอินโดจีน (Indochina deforestation) ต่อลมมรสุมช่วงฤดูร้อนของเอเชียตะวันออก (East- Asian summer monsoon) โดยใช้ แบบจำลองและการตรวจวัดค่าในอดีต พบว่า : “ การลดลงของพื้นที่ป่าในเขตแหลมอินโดจีนที่ผ่านมา ได้ส่งผลกระทบต่อลมมรสุมไม่เฉพาะในระดับท้องถิ่นเท่านั้น แต่ได้กระทบไปไกลถึงระบบมรสุมช่วงฤดูร้อนในเขตเอเชียตะวันออกด้วย ทั้งนี้เนื่องจาก การเพิ่มขึ้นของความเร็วลม และอุณหภูมิที่สูงขึ้น ในขณะที่อัตราส่วนการผสมของไอน้ำในอากาศ (water vapor mixing ratio) กลับลดน้อยลง ทั้งนี้เนื่องจาก ความหนาแน่นของ ไอน้ำในอากาศที่ระดับความสูง ณ ความดันอากาศ 850 มิลลิบาร์ ( ประมาณ 1 กม . เหนือ ผิวดิน ) บริเวณป่าที่ถูกทำลาย ลด น้อยลงไป ” การศึกษาวิจัยในประเทศไทยและภูมิภาคเอเชีย เกี่ยวกับ เรื่องของ ป่า ไม้กับการเปลี่ยนแปลงของสภาวะอากาศ Southeast Asia Forest Cover - 1973 Southeast Asia Forest Cover - 1985 Modified from: David L. Skole William A. Salas Chaowalit Silapathong http :// www . trfic . msu . edu / overview / papers / interannual . html 5.25 Mha Forest areas in continental Southeast Asia resulted from satellite data analysis Mha=Million hectares 22.56 Mha 48.71 Mha 18.28 Mha 19.92 Mha 3.98 Mha 16.74 Mha 44.82 Mha 16.15 Mha 16.52 Mha 114.70 Mha 98.21 Mha ก่อนถึงวันนี้
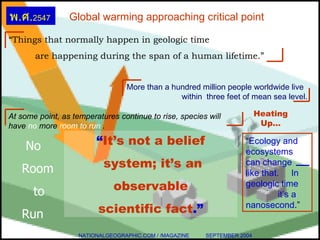
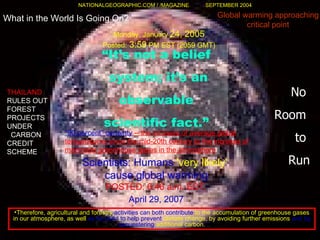
Global warming approachingcritical point “ It’s not a belief system; it’s an observable scientific fact .” No Room to Run NATIONALGEOGRAPHIC.COM / /MAGAZINE SEPTEMBER 2004 Heating Up… “ Things that normally happen in geologic time are happening during the span of a human lifetime.” More than a hundred million people worldwide live within three feet of mean sea level. At some point, as temperatures continue to rise, species will have no more room to run . “ Ecology and ecosystems can change like that. In geologic time it’s a nanosecond .” พ . ศ . 2547
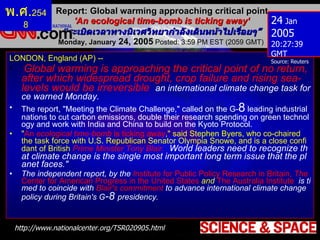
Report: Global warmingapproaching critical point 'An ecological time-bomb is ticking away‘ “ ระเบิดเวลาทางนิเวศวิทยากำลังเดินหน้าไปเรื่อยๆ ” Monday, January 24, 2005 Posted: 3:59 PM EST (2059 GMT) http :// www . nationalcenter . org / TSR020905 . html 24 Jan 2005 20:27:39 GMT Source: Reuters พ . ศ . 2548 LONDON, England (AP) -- Global warming is approaching the critical point of no return, after which widespread drought, crop failure and rising sea-levels would be irreversible , an international climate change task force warned Monday. The report, "Meeting the Climate Challenge," called on the G- 8 leading industrial nations to cut carbon emissions, double their research spending on green technology and work with India and China to build on the Kyoto Protocol. " An ecological time-bomb is ticking away ," said Stephen Byers, who co-chaired the task force with U.S. Republican Senator Olympia Snowe, and is a close confidant of British Prime Minister Tony Blair. " World leaders need to recognize that climate change is the single most important long term issue that the planet faces." The independent report, by the I nstitute for Public Policy Research in Britain, T he Center for American Progress in the United States and The Australia Institute , is timed to coincide with Blair's commitment to advance international climate change policy during Britain's G -8 presidency.
13.
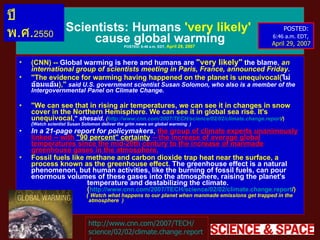
Scientists : Humans 'very likely' cause global warming POSTED : 6:46 a . m . EDT, April 29, 2007 ( CNN ) -- Global warming is here and humans are " very likely " the blame , an international group of scientists meeting in Paris, France, announced Friday . " The evidence for warming having happened on the planet is unequivocal( ไม่อ้อมแอ้ม ) , " said U . S . government scientist Susan Solomon, who also is a member of the Intergovernmental Panel on Climate Change . " We can see that in rising air temperatures, we can see it in changes in snow cover in the Northern Hemisphere . We can see it in global sea rise . It's unequivocal, " shesaid . ( http :// www . cnn . com / 2007 / TECH / science / 02/02 / climate . change . report / ) ( Watch scientist Susan Solomon deliver the grim news on global warming ) In a 21-page report for policymakers , the group of climate experts unanimously linked -- with " 90 percent " certainty -- the increase of average global temperatures since the mid-20th century to the increase of manmade greenhouse gases in the atmosphere . Fossil fuels like methane and carbon dioxide trap heat near the surface, a process known as the greenhouse effect . The greenhouse effect is a natural phenomenon, but human activities, like the burning of fossil fuels, can pour enormous volumes of these gases into the atmosphere, raising the planet's temperature and destabilizing the climate . ( http :// www . cnn . com / 2007 / TECH / science / 02/02 / climate . change . report / ) ( Watch what happens to our planet when manmade emissions get trapped in the atmosphere ) http :// www . cnn . com / 2007 / TECH / science / 02/02 / climate . change . report / POSTED : 6:46 a . m . EDT, April 29, 2007 ปี พ . ศ . 2550
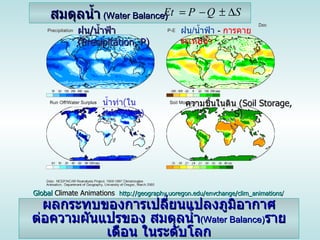
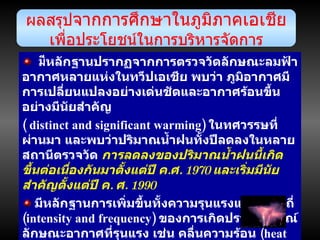
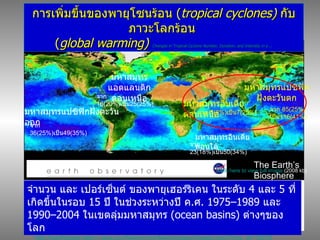
การเสียสมดุลของพลังงานความร้อนของโลก ( Earth'sEnergy Out of Balance ) Global Climate Animations การเสียสมดุลของพลังงานความร้อนของโลกจนถึงปัจจุบันถือได้ว่าอยู่ในระดับสูงตามมาตรฐานของประวัติศาสตร์โลก ทั้งนี้พอยกเป็นตัวอย่างได้ว่า “ การเสียสมดุลพลังงานความร้อนของโลกเพียง 1 วัตต์ - ปี ต่อ ตารางเมตร ติดต่อกันตลอด 10,000 ปีที่ผ่านมา จะมีพลังงานความร้อนมากพอที่จะละลายน้ำแข็งได้จนทำให้ระดับน้ำทะเลสูงขึ้นถึง 1 กิโลเมตร ( ถ้ามีน้ำแข็งที่จะให้ละลายได้มากถึงขนาดนั้น ) หรือ จะเพิ่มอุณหภูมิของมหาสมุทร์ในชั้น thermocline [ the boundary layer between the warm surface waters and the deep ocean ] ได้มากกว่า 100°C” . รังสีคลื่นสั้น รังสีคลื่นยาว รังสีความร้อนสุทธิ พลังงานความร้อนเผาดินและอากาศ ( พลังงานความร้อนสุทธิที่โลกได้รับ ) พลังงานความร้อนเผาน้ำ พลังงานความร้อนที่ถูกเก็บกักไว้ NASA GISS : Research News : Earth's Energy Out of Balance NASA - Scientists Confirm Earth's Energy Is Out of Balance http :// geography . uoregon . edu / envchange / clim_animations /
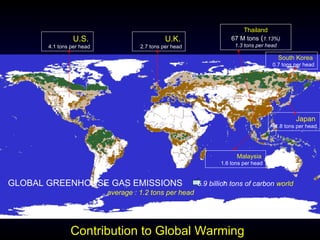
Thailand 67 Mtons ( 1.13%) 1.3 tons per head South Korea 0.7 tons per head U . S . 4.1 tons per head U . K . 2.7 tons per head Japan 1.8 tons per head Malaysia 1.6 tons per head GLOBAL GREENHOUSE GAS EMISSIONS 5.9 billion tons of carbon world average : 1.2 tons per head Contribution to Global Warming
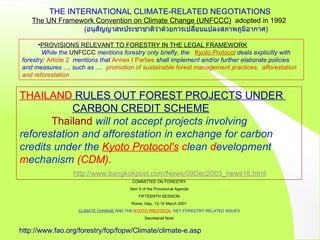
COMMITTEE ON FORESTRYItem 9 of the Provisional Agenda FIFTEENTH SESSION Rome, Italy, 12-16 March 2001 CLIMATE CHANGE AND THE KYOTO PROTOCOL : KEY FORESTRY-RELATED ISSUES Secretariat Note http://www.fao.org/forestry/fop/fopw/Climate/climate-e.asp THAILAND RULES OUT FOREST PROJECTS UNDER CARBON CREDIT SCHEME Thailand will not accept projects involving reforestation and afforestation in exchange for carbon credits under the Kyoto Protocol's c lean d evelopment m echanism (CDM). http://www.bangkokpost.com/News/09Dec2003_news18.html PROVISIONS RELEVANT TO FORESTRY IN THE LEGAL FRAMEWORK While the UNFCCC mentions forestry only briefly, the Kyoto Protocol deals explicitly with forestry: Article 2 mentions that Annex I Parties shall implement and/or further elaborate policies and measures .... such as .... promotion of sustainable forest management practices, afforestation and reforestation THE INTERNATIONAL CLIMATE-RELATED NEGOTIATIONS The UN Framework Convention on Climate Change (UNFCCC) adopted in 1992 ( อนุสัญญาสหประชาชาติว่าด้วยการเปลี่ยนแปลงสภาพภูมิอากาศ )
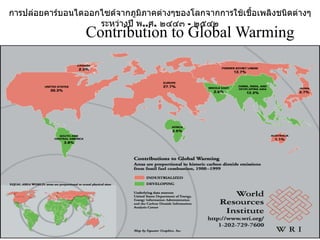
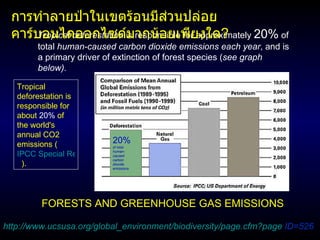
Tropical deforestation is responsible for approximately 20% of total human-caused carbon dioxide emissions each year , and is a primary driver of extinction of forest species ( see graph below). http://www.ucsusa.org/global_environment/biodiversity/page.cfm?page ID=526 FORESTS AND GREENHOUSE GAS EMISSIONS การทำลายป่าในเขตร้อนมีส่วนปล่อยคาร์บอนไดออกไซด์มากน้อยเพียงใด ? 20% of total human-caused carbon dioxide emissions Tropical deforestation is responsible for about 20% of the world's annual CO 2 emissions ( IPCC Special Report on LULUCF (2000) ).
41.
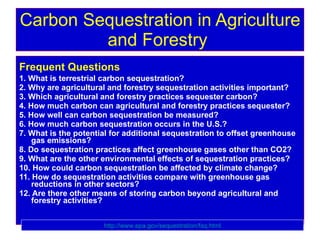
Frequent Questions 1. What is terrestrial carbon sequestration? 2. Why are agricultural and forestry sequestration activities important? 3. Which agricultural and forestry practices sequester carbon? 4. How much carbon can agricultural and forestry practices sequester? 5. How well can carbon sequestration be measured? 6. How much carbon sequestration occurs in the U.S.? 7. What is the potential for additional sequestration to offset greenhouse gas emissions? 8. Do sequestration practices affect greenhouse gases other than CO2? 9. What are the other environmental effects of sequestration practices? 10. How could carbon sequestration be affected by climate change? 11. How do sequestration activities compare with greenhouse gas reductions in other sectors? 12. Are there other means of storing carbon beyond agricultural and forestry activities? Carbon Sequestration in Agriculture and Forestry http :// www . epa . gov / sequestration / faq . html
42.
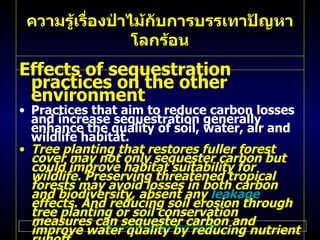
ความรู้เรื่องป่าไม้กับการบรรเทาปัญหาโลกร้อน Effects ofsequestration practices on the other environment Practices that aim to reduce carbon losses and increase sequestration generally enhance the quality of soil, water, air and wildlife habitat . Tree planting that restores fuller forest cover may not only sequester carbon but could improve habitat suitability for wildlife . Preserving threatened tropical forests may avoid losses in both carbon and biodiversity, absent any leakage effects . And reducing soil erosion through tree planting or soil conservation measures can sequester carbon and improve water quality by reducing nutrient runoff . In certain cases, there may be tradeoffs between carbon objectives and environmental quality . Replacing diverse ecosystems with single - species timber plantations may generate greater carbon accumulation, but could result in less biodiversity, at least at the scale of the plantation . For more information on some of the broader environmental effects of sequestration visit the Co-benefits section of this Web site . http :// www . epa . gov / sequestration / faq . html
43.
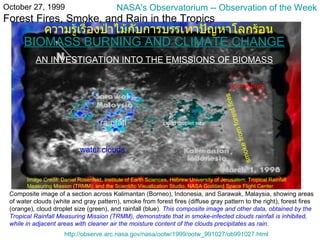
October 27, 1999Forest Fires, Smoke, and Rain in the Tropics Composite image of a section across Kalimantan ( Borneo ) , Indonesia, and Sarawak, Malaysia, showing areas of water clouds ( white and gray pattern ) , smoke from forest fires ( diffuse gray pattern to the right ) , forest fires ( orange ) , cloud droplet size ( green ) , and rainfall ( blue ). This composite image and other data, obtained by the Tropical Rainfall Measuring Mission ( TRMM ) , demonstrate that in smoke - infected clouds rainfall is inhibited, while in adjacent areas with cleaner air the moisture content of the clouds precipitates as rain . water clouds smoke from forest fires forest fires cloud droplet size rainfall NASA's Observatorium -- Observation of the Week http :// observe . arc . nasa . gov / nasa / ootw / 1999 / ootw_991027 / ob991027 . html Image Credit : Daniel Rosenfeld, Institute of Earth Sciences, Hebrew University of Jerusalem; Tropical Rainfall Measuring Mission ( TRMM ) ; and the Scientific Visualization Studio, NASA Goddard Space Flight Center . BIOMASS BURNING AND CLIMATE CHANGE AN INVESTIGATION INTO THE EMISSIONS OF BIOMASS ความรู้เรื่องป่าไม้กับการบรรเทาปัญหาโลกร้อน
44.
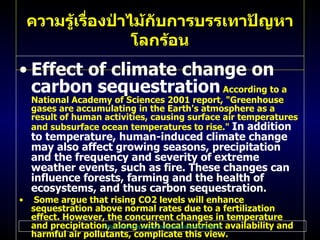
Effect of climatechange on carbon sequestration According to a National Academy of Sciences 2001 report, " Greenhouse gases are accumulating in the Earth's atmosphere as a result of human activities, causing surface air temperatures and subsurface ocean temperatures to rise ." In addition to temperature, human - induced climate change may also affect growing seasons, precipitation and the frequency and severity of extreme weather events, such as fire . These changes can influence forests, farming and the health of ecosystems, and thus carbon sequestration . Some argue that rising CO 2 levels will enhance sequestration above normal rates due to a fertilization effect . However, the concurrent changes in temperature and precipitation, along with local nutrient availability and harmful air pollutants, complicate this view . Furthermore, recent studies of pine forests fumigated with elevated CO 2 levels have shown that this fertilization effect may only be short - lived ( Schlesinger and Lichter 2001; Oren et al . 2001 ). Current projections of business - as - usual U . S . sequestration rates under various climate change scenarios show both increases and decreases in carbon storage depending on various assumptions . To date, few analyses of the potential for additional sequestration over time have considered the future effects of climate change . ความรู้เรื่องป่าไม้กับการบรรเทาปัญหาโลกร้อน http :// www . epa . gov / sequestration / faq . html
45.
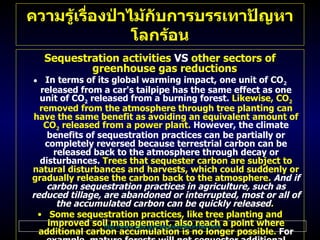
Sequestration activities VS other sectors of greenhouse gas reductions In terms of its global warming impact, one unit of CO 2 released from a car's tailpipe has the same effect as one unit of CO 2 released from a burning forest . Likewise, CO 2 removed from the atmosphere through tree planting can have the same benefit as avoiding an equivalent amount of CO 2 released from a power plant . However, the climate benefits of sequestration practices can be partially or completely reversed because terrestrial carbon can be released back to the atmosphere through decay or disturbances . Trees that sequester carbon are subject to natural disturbances and harvests, which could suddenly or gradually release the carbon back to the atmosphere . And if carbon sequestration practices in agriculture, such as reduced tillage, are abandoned or interrupted, most or all of the accumulated carbon can be quickly released . Some sequestration practices, like tree planting and improved soil management, also reach a point where additional carbon accumulation is no longer possible . For example, mature forests will not sequester additional carbon after the trees have fully grown . At this point, however, the mature trees or practices still need to be sustained to maintain the level of accumulated carbon . Addressing the issues of reversibility ( or duration ) and carbon saturation is important if sequestration benefits are to be compared to other greenhouse gas reductions . For more information on how the duration issue might be addressed for carbon sequestration projects, visit the Project Analysis section of this Web site . ความรู้เรื่องป่าไม้กับการบรรเทาปัญหาโลกร้อน http :// www . epa . gov / sequestration / faq . html
46.
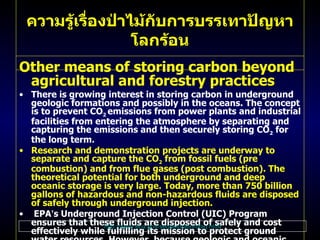
Other means ofstoring carbon beyond agricultural and forestry practices There is growing interest in storing carbon in underground geologic formations and possibly in the oceans . The concept is to prevent CO 2 emissions from power plants and industrial facilities from entering the atmosphere by separating and capturing the emissions and then securely storing CO 2 for the long term . Research and demonstration projects are underway to separate and capture the CO 2 from fossil fuels ( pre combustion ) and from flue gases ( post combustion ). The theoretical potential for both underground and deep oceanic storage is very large . Today, more than 750 billion gallons of hazardous and non - hazardous fluids are disposed of safely through underground injection . EPA ’ s Underground Injection Control ( UIC ) Program ensures that these fluids are disposed of safely and cost effectively while fulfilling its mission to protect ground water resources . However, because geologic and oceanic sequestration are emerging climate mitigation optionskey issues still need to be addressed, including the costs, energy requirements, long - term effectiveness, and ecological consequences, especially for oceanic storage . For more information on these options and EPA ’ s UIC program, visit DOE ’ s Office of Science , Office of Fossil Energy , National Energy Technology Laboratory , and EPA ’ s Office of Ground Water and Drinking Water . ความรู้เรื่องป่าไม้กับการบรรเทาปัญหาโลกร้อน http :// www . epa . gov / sequestration / faq . html
47.
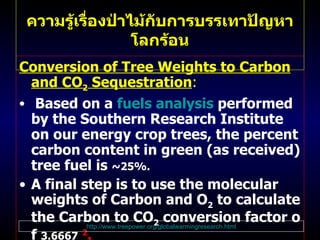
Conversion of TreeWeights to Carbon and CO 2 Sequestration : Based on a fuels analysis performed by the Southern Research Institute on our energy crop trees, the percent carbon content in green (as received) tree fuel is ~25%. A final step is to use the molecular weights of Carbon and O 2 to calculate the Carbon to CO 2 conversion factor of 3.6667 2 . 2 The molecular weight of Carbon to CO 2 ( C + O 2 = CO 2 ) equals 12 lbs . of carbon + 32 lbs . of O 2 = 44 lbs . of CO 2 . Dividing 44 lbs . of CO 2 by 12 lbs . of Carbon, results in a Carbon to CO 2 conversion factor of 3.6667 . ความรู้เรื่องป่าไม้กับการบรรเทาปัญหาโลกร้อน http :// www . treepower . org / globalwarmingresearch . html
48.
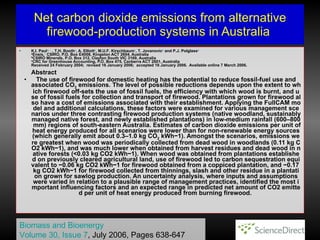
Net carbon dioxideemissions from alternative firewood - production systems in Australia K . I . Paul a , , , T . H . Booth a , A . Elliott b , M . U . F . Kirschbaum c , T . Jovanovic a and P . J . Polglase a a Ensis, 1 CSIRO, P.O. Box E4008, Kingston ACT 2604, Australia b CSIRO Minerals, P . O . Box 312, Clayton South VIC 3169, Australia c CRC for Greenhouse Accounting, P.O. Box 475, Canberra ACT 2601, Australia Received 24 February 2004; revised 16 January 2006; accepted 16 January 2006 . Available online 7 March 2006 . Abstract The use of firewood for domestic heating has the potential to reduce fossil-fuel use and associated CO 2 emissions. The level of possible reductions depends upon the extent to which firewood off-sets the use of fossil fuels, the efficiency with which wood is burnt, and use of fossil fuels for collection and transport of firewood. Plantations grown for firewood also have a cost of emissions associated with their establishment. Applying the FullCAM model and additional calculations, these factors were examined for various management scenarios under three contrasting firewood production systems (native woodland, sustainably managed native forest, and newly established plantations) in low-medium rainfall (600–800 mm) regions of south-eastern Australia. Estimates of carbon dioxide emissions per unit of heat energy produced for all scenarios were lower than for non-renewable energy sources (which generally emit about 0.3–1.0 kg CO 2 kWh −1 ). Amongst the scenarios, emissions were greatest when wood was periodically collected from dead wood in woodlands (0.11 kg CO 2 kWh −1 ), and was much lower when obtained from harvest residues and dead wood in native forests (<0.03 kg CO 2 kWh −1 ). When wood was obtained from plantations established on previously cleared agricultural land, use of firewood led to carbon sequestration equivalent to −0.06 kg CO 2 kWh −1 for firewood obtained from a coppiced plantation, and −0.17 kg CO 2 kWh −1 for firewood collected from thinnings, slash and other residue in a plantation grown for sawlog production. An uncertainty analysis, where inputs and assumptions were varied in relation to a plausible range of management practices, identified the most important influencing factors and an expected range in predicted net amount of CO 2 emitted per unit of heat energy produced from burning firewood. Biomass and Bioenergy Volume 30, Issue 7 , July 2006, Pages 638-647
49.
ThaiFlux Colloquium 200631 st October 2006 08.50-17.00 Princess Sirindhorn International Center for Research, Development and Tecnnology Transfer. Kasetsart University at Bangken, Bangkok Gas and Energy Fluxes in Ecosystems, Thailand
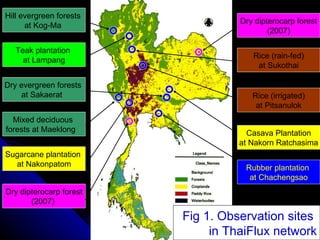
Rubber plantation at Chachengsao Dry dipterocarp forest (2007) Hill evergreen forests at Kog-Ma Dry evergreen forests at Sakaerat Mixed deciduous forests at Maeklong Rice (rain-fed) at Sukothai Rice (irrigated) at Pitsanulok Teak plantation at Lampang Casava Plantation at Nakorn Ratchasima Dry dipterocarp forest (2007) Sugarcane plantation at Nakonpatom Fig 1. Observation sites in ThaiFlux network
52.
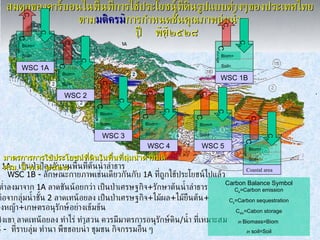
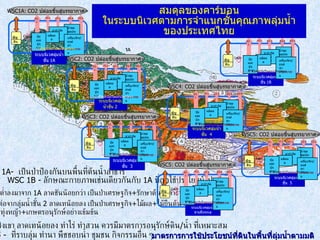
สมดุลของคาร์บอนในพื้นที่การใช้ประโยชน์ที่ดินรูปแบบต่างๆของประเทศไทยตาม มติครม การกำหนดชั้นคุณภาพลุ่มน้ำปีพศ๒๕๒๘ WSC 1A- เป็นป่าป้องกันบนพื้นที่ต้นน้ำลำธาร WSC 1B - ลักษณะกายภาพเช่นเดียวกันกับ 1A ที่ถูกใช้ประโยชน์ไปแล้ว WSC 3 - ต่อจากลุ่มน้ำชั้น 2 ลาดเทน้อยลง เป็นป่าเศรษฐกิจ + ไม้ผล + ไม้ยืนต้น + ทุ่งหญ้า + เกษตรอนุรักษ์อย่างเข้มข้น WSC 4 - เชิงเขา ลาดเทน้อยลง ทำไร่ ทำสวน ควรมีมาตรการอนุรักษ์ดิน / น้ำ ที่เหมาะสม WSC 5 - ที่ราบลุ่ม ทำนา พืชชอบน้ำ ชุมชน กิจกรรมอื่น ๆ WSC 2 - ต่ำลงมาจาก 1A ลาดชันน้อยกว่า เป็นป่าเศรษฐกิจ + รักษาต้นน้ำลำธาร Carbon Balance Symbol C e =Carbon emission C s =Carbon sequestration C sto =Cabon storage in Biomass=Biom in soil=Soil C e C s C storage Biom= Soil= C e C s C storage Biom= Soil= C e C s C storage Biom= Soil= C e C s C storage Biom= Soil= C e C s C storage Biom= Soil= C e C s C storage Biom= Soil= มาตรการการใช้ประโยชน์ที่ดินในพื้นที่ลุ่มน้ำตามมติ ครม . ปี พ . ศ . ๒๕๒๘ C e C s C storage Biom= Soil= WSC 1A WSC 1B WSC 2 WSC 3 WSC 4 WSC 5 Coastal area
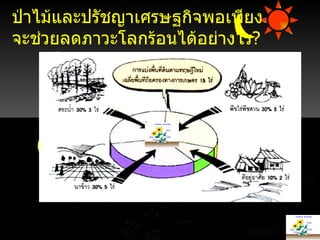
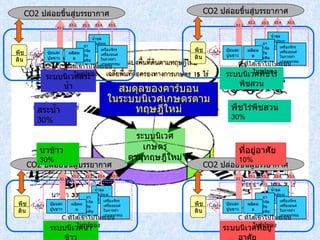
สระน้ำ 30% นาข้าว 30% พืชไร่พืชสวน 30% ที่อยู่อาศัย 10% ระบบนิเวศเกษตร ตามทฤษฎีใหม่ สมดุลของคาร์บอน ในระบบนิเวศเกษตรตามทฤษฎีใหม่ ระบบนิเวศสระน้ำ พืช ดิน CO2 ปล่อยขึ้นสู่บรรยากาศ X3.1 X3.2 X3.5 X3.3 X3.4 น้ำชลชลประทาน ยากำจัดวัชวัชพืช ผลิตผล ปุ๋ยและปูนขาว เครื่องจักรเครื่องยนต์ ในการทำเกษตรกรรม C ที่ใส่เข้าไปในระบบในรูปของ C ที่เก็บไว้ใน ระบบนิเวศพืชไร่พืชสวน พืช ดิน CO2 ปล่อยขึ้นสู่บรรยากาศ X3.1 X3.2 X3.5 X3.3 X3.4 น้ำชลชลประทาน ยากำจัดวัชวัชพืช ผลิตผล ปุ๋ยและปูนขาว เครื่องจักรเครื่องยนต์ ในการทำเกษตรกรรม C ที่ใส่เข้าไปในระบบในรูปของ C ที่เก็บไว้ใน ระบบนิเวศที่อยู่อาศัย พืช ดิน CO2 ปล่อยขึ้นสู่บรรยากาศ X3.1 X3.2 X3.5 X3.3 X3.4 น้ำชลชลประทาน ยากำจัดวัชวัชพืช ผลิตผล ปุ๋ยและปูนขาว เครื่องจักรเครื่องยนต์ ในการทำเกษตรกรรม C ที่ใส่เข้าไปในระบบในรูปของ C ที่เก็บไว้ใน ระบบนิเวศนาข้าว พืช ดิน CO2 ปล่อยขึ้นสู่บรรยากาศ X3.1 X3.2 X3.5 X3.3 X3.4 น้ำชลชลประทาน ยากำจัดวัชวัชพืช ผลิตผล ปุ๋ยและปูนขาว เครื่องจักรเครื่องยนต์ ในการทำเกษตรกรรม C ที่ใส่เข้าไปในระบบในรูปของ C ที่เก็บไว้ใน
55.
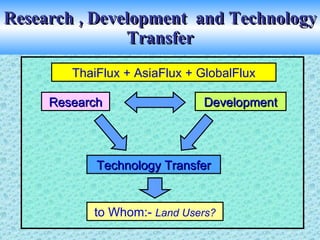
Research , Development and Technology Transfer Research Development Technology Transfer to Whom:- Land Users? ThaiFlux + AsiaFlux + GlobalFlux
56.
What in theWorld Is Going On? “ It’s not a belief system; it’s an observable scientific fact.” No Room to Run Global warming approaching critical point NATIONALGEOGRAPHIC.COM / /MAGAZINE SEPTEMBER 2004 Scientists : Humans 'very likely' cause global warming POSTED : 6:46 a . m . EDT, April 29, 2007 Monday, January 24, 2005 Posted: 3:59 PM EST (2059 GMT) " 90 percent " certainty -- the increase of average global temperatures since the mid-20th century to the increase of manmade greenhouse gases in the atmosphere THAILAND RULES OUT FOREST PROJECTS UNDER CARBON CREDIT SCHEME Therefore, agricultural and forestry activities can both contribute to the accumulation of greenhouse gases in our atmosphere, as well as be used to help prevent climate change, by avoiding further emissions and by sequestering additional carbon .

![การเสียสมดุลของพลังงานความร้อนของโลก ( Earth's Energy Out of Balance ) Global Climate Animations การเสียสมดุลของพลังงานความร้อนของโลกจนถึงปัจจุบันถือได้ว่าอยู่ในระดับสูงตามมาตรฐานของประวัติศาสตร์โลก ทั้งนี้พอยกเป็นตัวอย่างได้ว่า “ การเสียสมดุลพลังงานความร้อนของโลกเพียง 1 วัตต์ - ปี ต่อ ตารางเมตร ติดต่อกันตลอด 10,000 ปีที่ผ่านมา จะมีพลังงานความร้อนมากพอที่จะละลายน้ำแข็งได้จนทำให้ระดับน้ำทะเลสูงขึ้นถึง 1 กิโลเมตร ( ถ้ามีน้ำแข็งที่จะให้ละลายได้มากถึงขนาดนั้น ) หรือ จะเพิ่มอุณหภูมิของมหาสมุทร์ในชั้น thermocline [ the boundary layer between the warm surface waters and the deep ocean ] ได้มากกว่า 100°C” . รังสีคลื่นสั้น รังสีคลื่นยาว รังสีความร้อนสุทธิ พลังงานความร้อนเผาดินและอากาศ ( พลังงานความร้อนสุทธิที่โลกได้รับ ) พลังงานความร้อนเผาน้ำ พลังงานความร้อนที่ถูกเก็บกักไว้ NASA GISS : Research News : Earth's Energy Out of Balance NASA - Scientists Confirm Earth's Energy Is Out of Balance http :// geography . uoregon . edu / envchange / clim_animations /](https://image.slidesharecdn.com/globalworming-100620014457-phpapp01/85/Globalworming-15-320.jpg)


![Cc parliament seminar[1]](https://cdn.slidesharecdn.com/ss_thumbnails/ccparliament-seminar1-100918021244-phpapp02-thumbnail.jpg?width=640&height=640&fit=bounds)


